1. Problem Description
Enterprises know the benefits of merging data from multiple sources, to build more detailed and more complete records about their customers, their products, their employees, etc. The sources may be different departments or computer systems within one enterprise, a combination of internal and external data sources, or the result of corporate merger and acquisition.
Merging data sources is not always easy, however. One challenge in particular is Entity Resolution, deciding when multiple entities from different data sources actually represent the same real-world entity, and then merging them into one entity. Consider the following example:
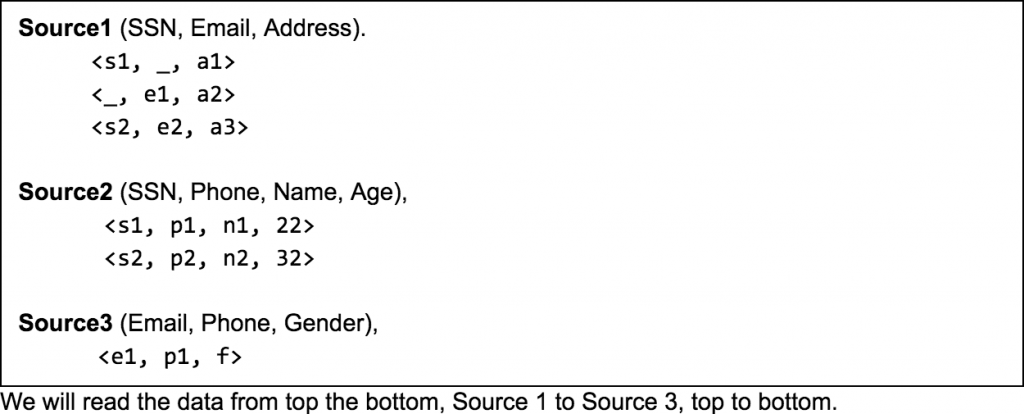
Assume there are three data sources containing the following types of customer information:
Source1 (SSN, Email, Address)
Source2 (SSN, Phone, Name, Age)
Source3 (Email, Phone, Gender)
Furthermore, assume that SSN, Email, and Phone are each sufficient to uniquely identify an individual (that is, they constitute PII, personally identifiable information). In the real world, phone numbers and email addresses might not uniquely identify an individual, but for this example we will assume they do. The problem is that the different sources use different identifiers, and that individual records might be missing some information. Over time, missing PII of a customer may show up later in another data source. The goal is to use whatever PII we have about a customer to find all information (attributes) of a customer across all data sources.
First, if we do not merge the data tables, then trying to piece together information about one customer at runtime is very challenging and very ad hoc. For example, if we want to search on an SSN 123-45-7890 to find all information about this customer, we need to do the following:
- Search Source1 on the SSN column to find Address and Email values.
- If an Email value is present in Source1, then use that Email value (say e1) to search Source3 on the Email column to find Gender and Phone values.
- If a Phone value is present in Source 3, then use that Phone value (say p1) to search Source2 to find Name and Age.
- We also need to search Source2 on SSN to see if there is matching record.
We can try different sequences of searching the three data sources to piece together all the information about one customer. For example, we can first search Source2 on the SSN column, then search Source3 and Source1. Still, any search strategy is going to have the same complexity. This type of back and forth piecing together customer information is not only slow, but also unmanageable considering the complexity of adding more data sources.
To avoid this clumsy runtime searching, we can try to create a new unified table to store all information about customers. For example, we may try to create a unified Customer table like
Customer (SSN, Email, Phone, Name, Age, Gender, Address).
The immediate challenge using RDBMS with this approach is that we don’t know which PII should be used as Primary Key (which doesn’t allow missing information and cannot be NULL) since any of the PII could be missing at sometime. We could add a system-generated unique CustomerID to each row in the Customer table to get around the Primary Key requirement. However, when we need to merge records from multiple data sources to a single record in the Customer table, we need to piece together information back and forth from the multiple data sources (similar to the search example discussed earlier). Relational databases are not designed for complex ETL processing requiring an unknown length of ‘chaining’ and ‘merging’ different records. Every new data source with a new identifier or new attribute will require going through this slow and difficult process of searching on multiple attributes in search of a match, and then creating or altering a table. Experienced RDBMS developers and DBAs know the inherent limitations of RDBMS to handle this type of ETL and entity resolution.
2. Graph-Based Solution
The good news is that Graphs are a natural solution for problems such as a entity resolution.
2.1 Graph Modeling
A recommended graph-based solution is to create a Customer Vertex for each customer, connected to various PII vertices such as SSN, Email, Phone.
Figure 1 shows an example graph schema (created in GraphStudio, TigerGraph’s browser-based visual SDK). Each Customer vertex represents a unique customer. Each PII Vertex (Phone/SSN/ Email) represents a unique PII value. This schema represents our flexible and extensible concept of “identifier” for a Customer. Any of the three vertex types are sufficient, and more can be added. All the other attributes (such as Age, Gender, and Address) will be stored with the Customer vertex.
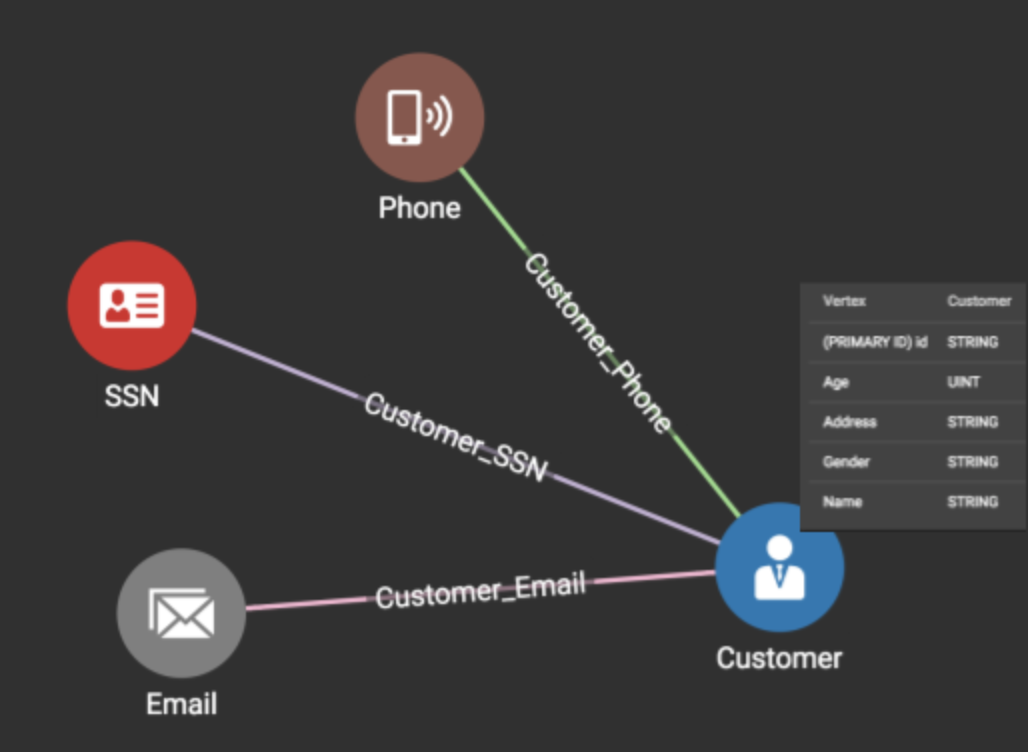
Figure 1
2.2 Data Loading and Graph Creation
We will first show step by step how as data are loaded, we incrementally build and merge a graph. Then we’ll summarize the steps as an algorithm.
Assume we have the following example data as below, where _ means that the information is missing or unavailable at the time.
Line 1: The first line of data in Source1, <s1, _, a1>, generates the graph shown below.
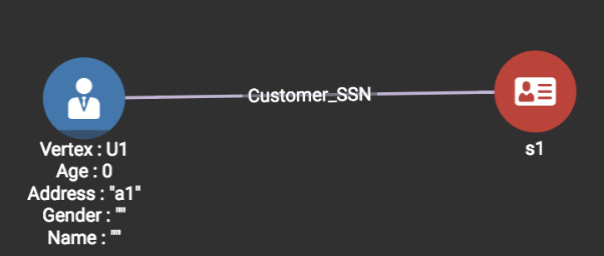
Since SSN s1 has never been in the graph, a SSN vertex s1 is created. Since there is no email present in this record, we neither create an Email vertex nor try to match to an existing Email vertex.Every data record must match to a new or existing customer, so a new Customer vertex U1 is created with the attribute data Address=a1, and an edge between the two vertices (U1 and s1) is added.
Line 2: Loading the second line in Source1 <_,e1, a2> produces the graph shown below.
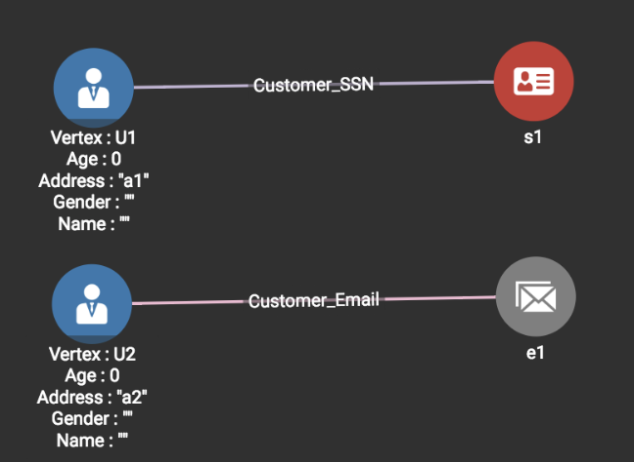
Since Email e1 isn’t in the graph before, a new Email vertex e1 is created. Since no SSN value is present, there is no way we can connect this record to any existing customer. Thus a new Customer vertex U2 is created and an edge between the two vertices (U2—e1) is created.
Line 3: Loading the third line in Source1 <s2, e2, a3> produces the graph shown below.
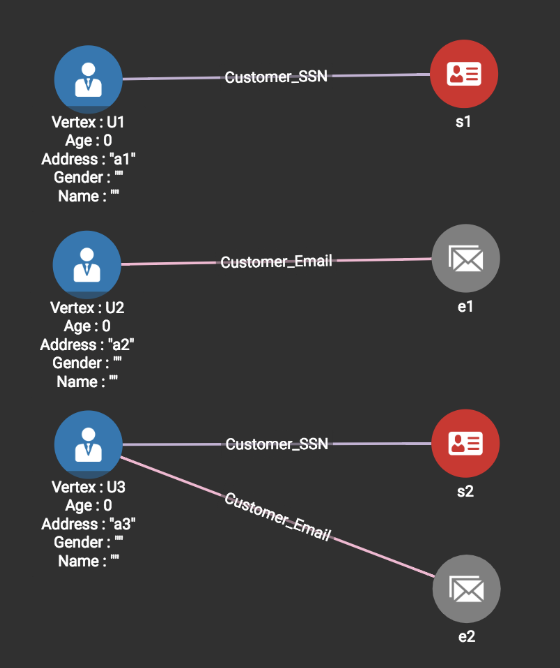
Since neither s2 nor e2 is in the graph, two new vertices (SSN vertex s2, Email vertex e2) are created, a single Customer vertex U3 is created, and two edges (U3—s2 and U3—e2) are added.
So far, each data line has created a separate graph pattern. This is expected, because each line in a table should represent independent information. Next, as we start to read data from Source 2, we have the potential to perform some merging.
Line 4: Loading the first line in Source2 <s1, p1, n1, 22> produces the graph shown below.
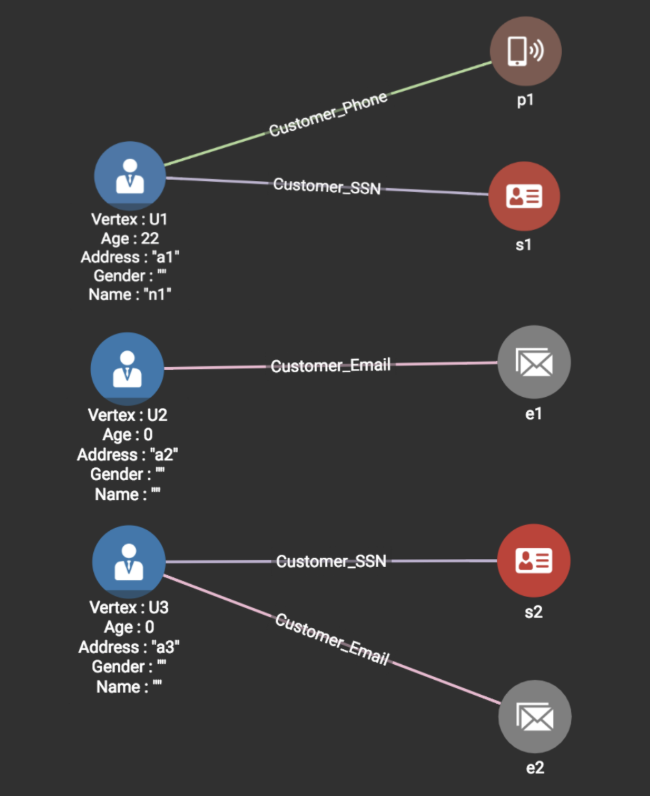
Since s1 is in the graph already, we note its Customer U1. Since p1 isn’t in the graph yet, a Phone Vertex p1 is created, and an edge is added between p1 and s1’s Customer vertex U1. Additionally, we add the attribute values Name=n1 and Age=22 to U1. Notice that here we are essentially ‘merging’ two records: the first record of Source1 and the first record of Source2.
Line 5: Loading the second line in Source2 <s2, p2, n2, 32> produces the graph shown below.
Since SSN s2 vertex is already in the graph, only a Phone Vertex p2 is created, and no new Customer vertex is created. An edge between p2 and s2’s Customer vertex U3 is added. Again we are merging two records, the last record of Source1 and the last record of Source2.
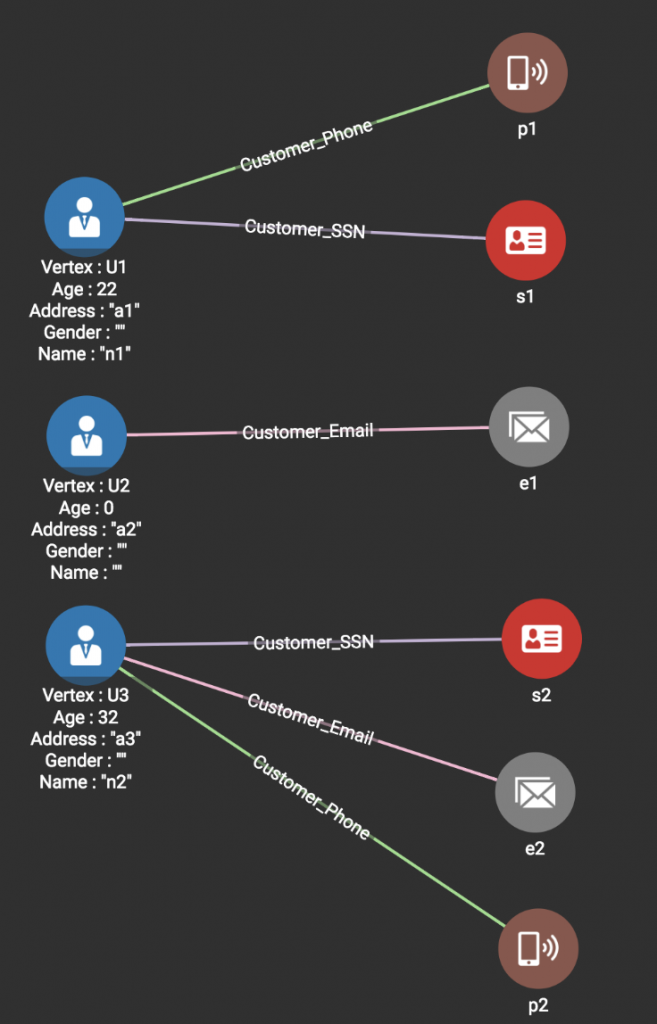
Line 6: Finally, loading the first line in Source3 <e1, p1, f> produces the graph shown below.
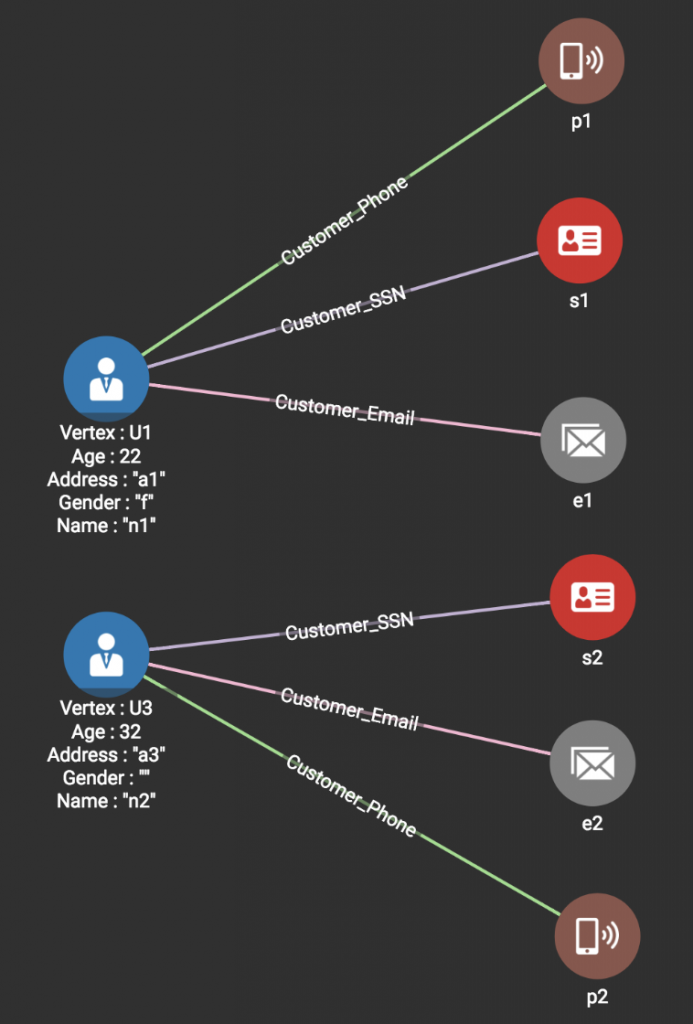
Both e1 and p1 are in the graph already, but are connected to two different Customer vertices (U2 and U1 respectively). If we are certain that all our data values are correct and are unique identifiers, then Customer vertices U1 and U2 should be merged.
Notice that there is a data conflict issue here: U1 has an address a1, and U2 has an address a2. How should we handle data conflicts when we merge two vertices?
In TigerGraph, this is completely up to the user or each use case’s business requirement. User-defined functions can be used in conjunction with GSQL‘s already rich semantics to decide whether to merge and then how to merge. For example, when merging multiple values into one attribute, you can keep the older value, use the newer value, or concatenate/append them as a list of values (and remembering their sources, for data lineage/provenance management). In this example, we retain the vertex U1 and address a1 for simplicity.
2.3 A Data Merging and Entity Resolution Algorithm
The following pseudocode generalizes the steps we presented in our example above:
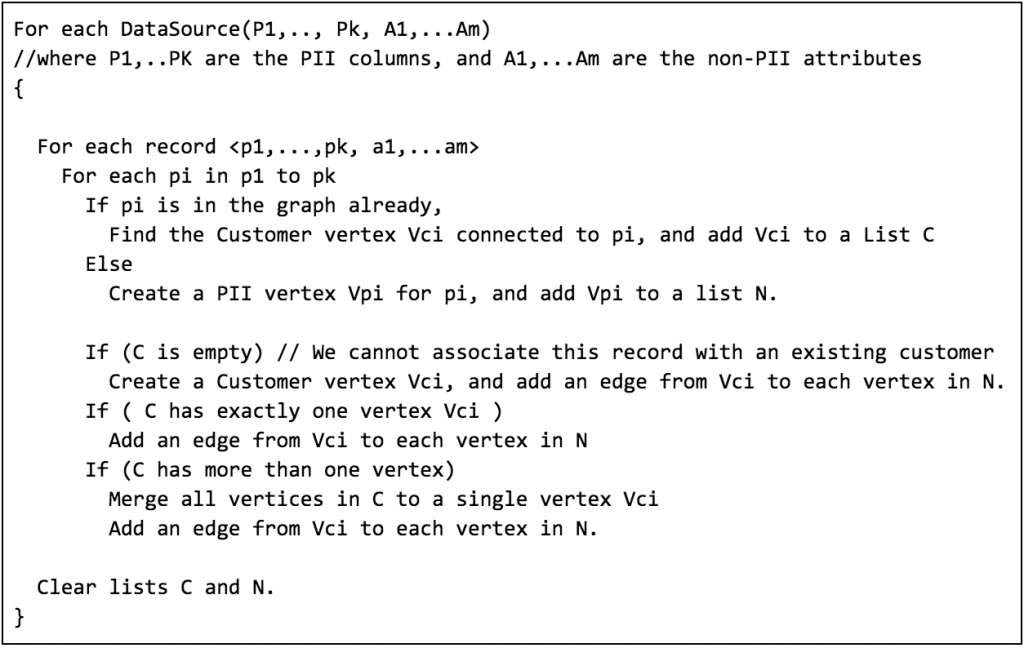
Using TigerGraph’s GSQL high-level loading language, expressing this business logic as a parallel-processing loading job is a straightforward task.
2.4 Querying a customer
Querying a customer using any PII field or a combination of PII fields is straightforward. For example, given any email, phone or SSN, we can quickly find the Customer vertex connected to such PII input vertex and all attributes associated with the Customer vertex. More specifically,
a GSQL query like
getCustomer(SSN s1, Phone p1, Email e1)
takes in a list of PII input and returns all customer information related to the input PII. The only requirement to the query input is that at least one PII is present.
3. Summary
Graph databases provide an easily-understood and efficient way to merge data sets and to perform the critical entity resolution:
- The flexible of graph schemas can easily handle missing information and dynamic schema change.
- Graph-based parallel loading and transformation makes data mapping and resolution efficient and easy to manage.
- Graph-based inference makes chaining/merging of records (entities) simple and efficient.
TigerGraph’s powerful Native Parallel Graph technology [1] offers the best platform for customer entity resolution. Graph-based customer entity resolution is only one example of harnessing the power of a graph database. Connecting your data, and constructing a true Customer 360 or other knowledge graph is only the start. The real benefits of a fast, flexible, and scalable graph database arise from the queries, analytics, and resulting insights available to you. Graph-based customer profiling using techniques such as vertex clustering, vertex and neighbor similarity, influence ranking, temporal analysis, and churn prediction will deliver actionable insights, enriching and empowering any enterprise and putting you ahead of others.
[1] Native Parallel Graph: The Next Generation of Graph Database for Real-Time Deep Link Analytics.