 My daughter, a high schooler heard me chatting with a client last week and asked me, “Why do you keep going on and on about GSQL and something called the accumulators? What’s the big deal?” As I thought about the best way to explain accumulators, a key feature in TigerGraph’s graph query language – GSQL, I realized that it has something in common with a story from our childhood – the story of Hansel and Gretel.
In the story, Hansel and Gretel carry white pebbles in their pockets and keep dropping the pebbles as they walk deeper into the forest so that they can remember the path they took and can find their way back home. Accumulators in GSQL can serve as the “pebbles” in graph traversal algorithms. What’s more, accumulators also come with built-in computational functions and data structures, and most importantly, they are designed to work with parallel computation. That’s as if we had an army of Hansels and Gretels who were also data scientists. We’ll cover each of these three aspects – path traversal, computing, and parallelism, one at a time in the example below.
Let’s consider a common question answered with TigerGraph by our customers in multiple industries including financial services, pharmaceutical, healthcare, telecom, internet and government – given a set of business entities such as two merchants for financial services or two doctors for healthcare, how are they related? Do they have customers or patients in common and how is their relationship evolving over a period of time?
Understanding the relationship between two merchants with relational database
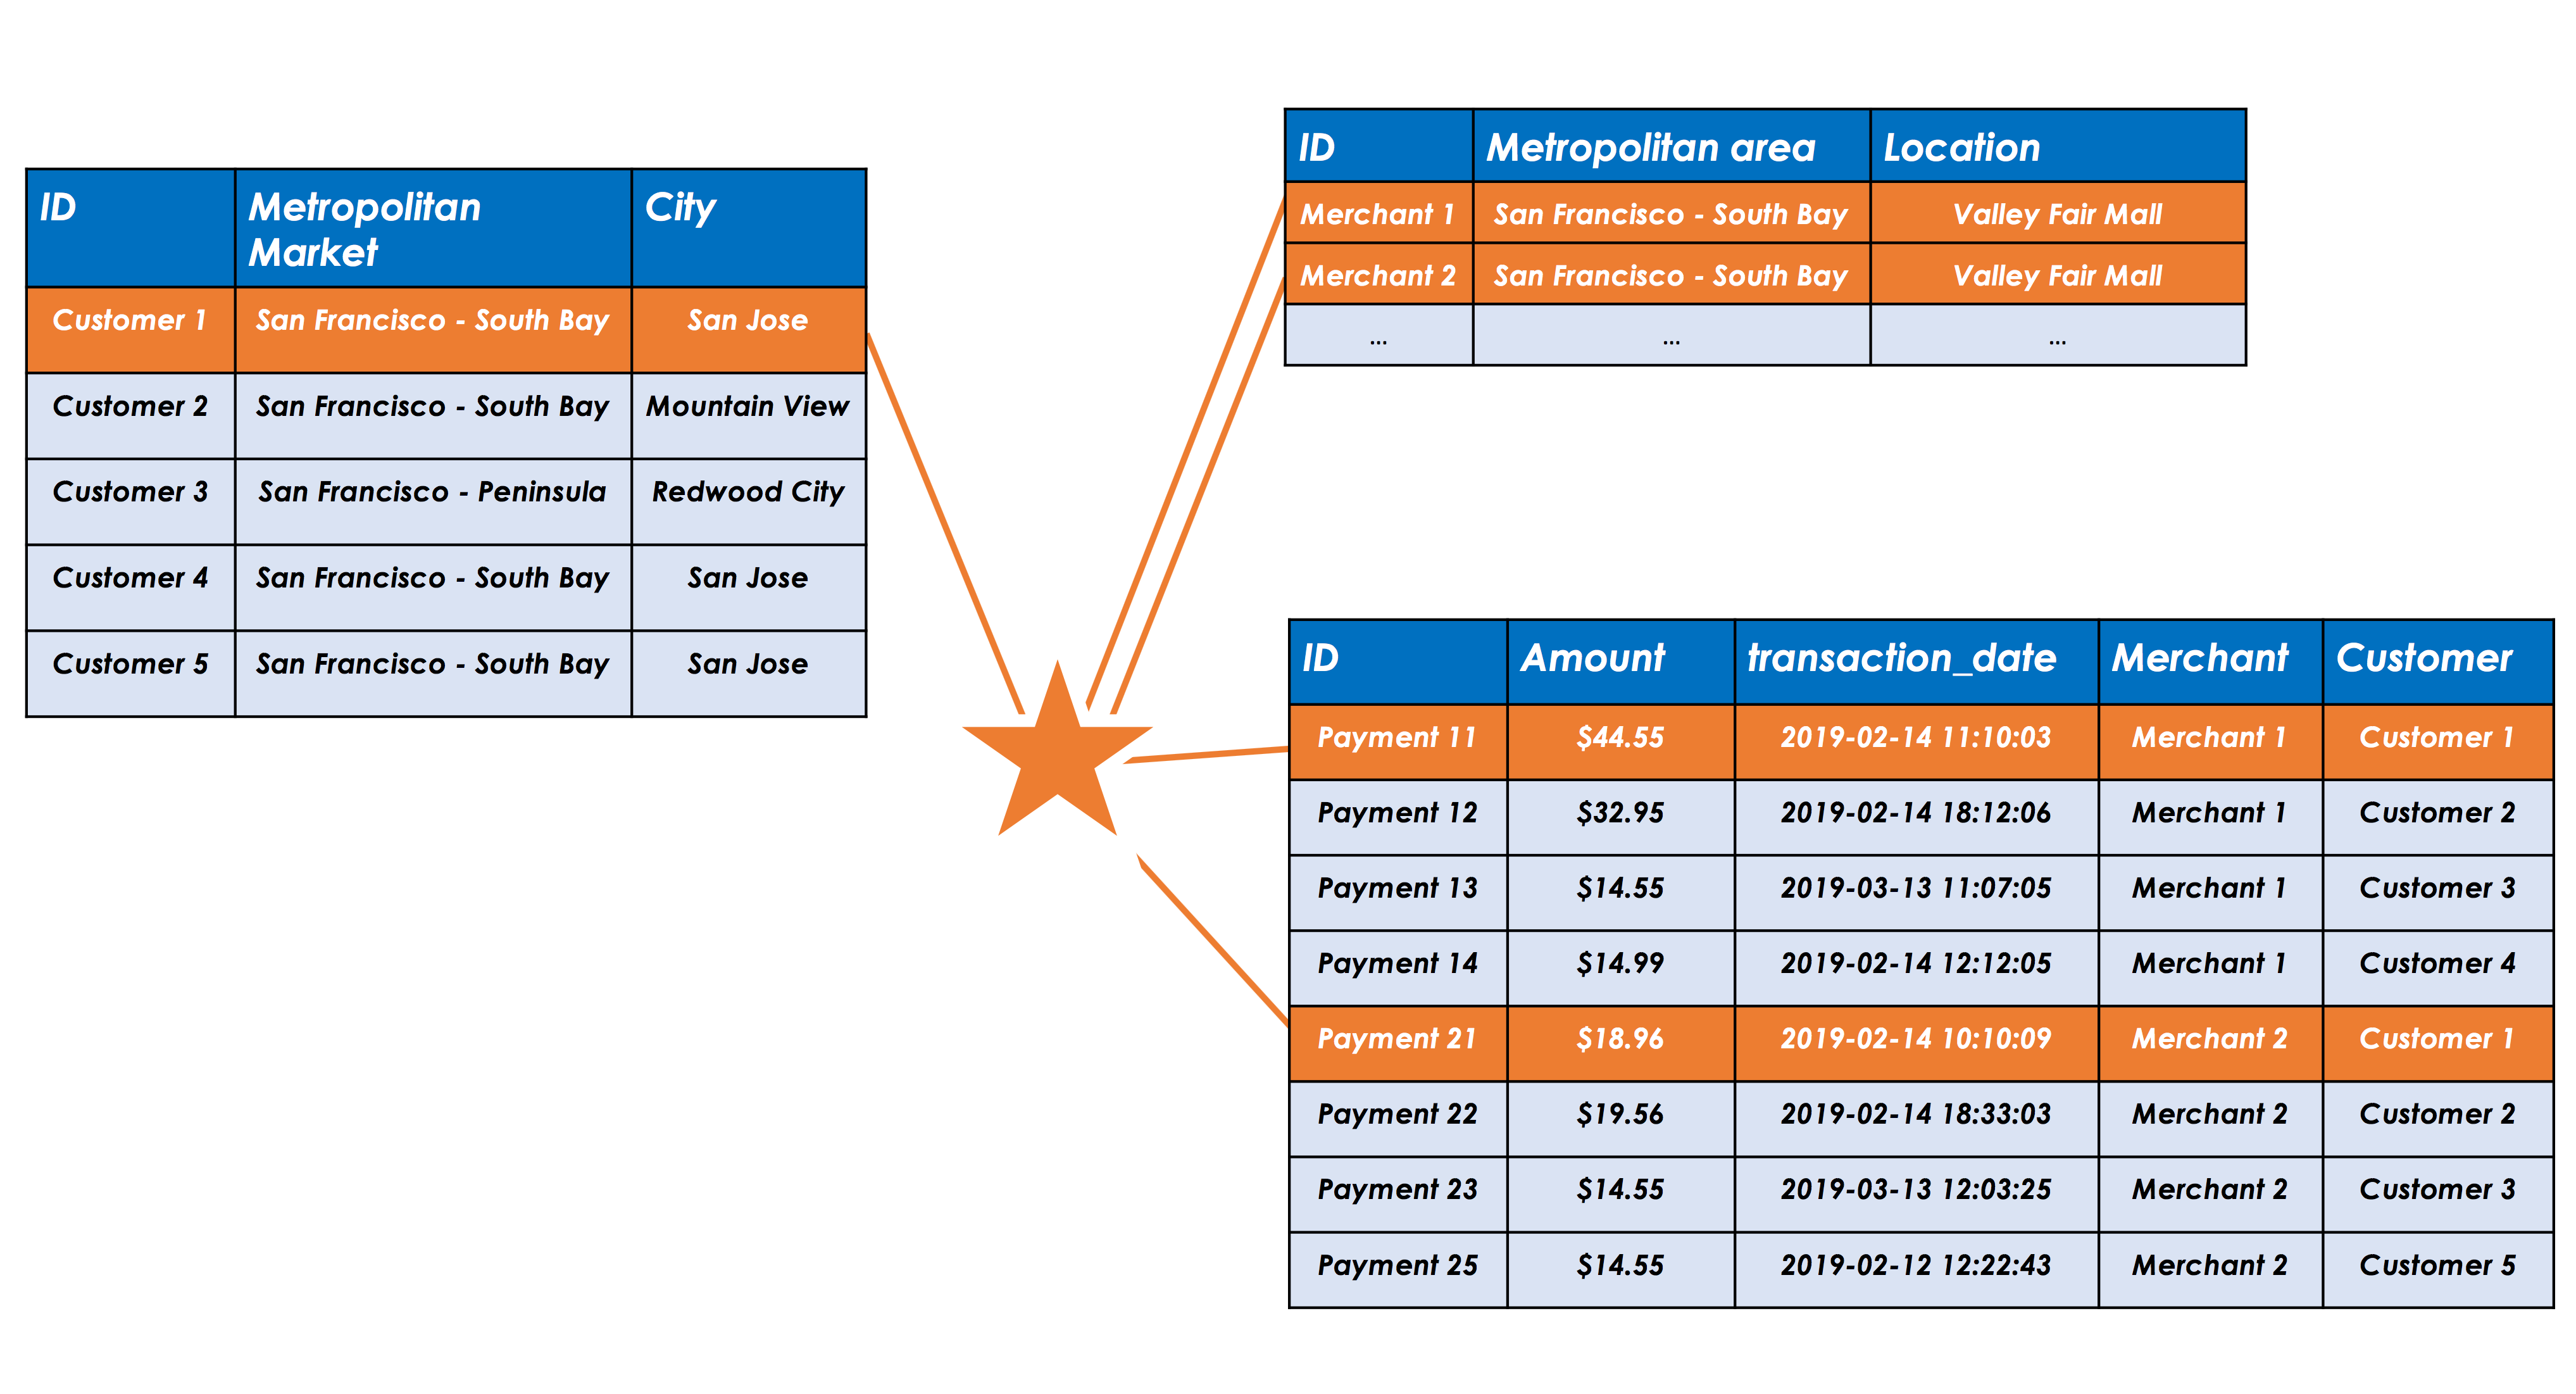
Let’s dig deeper into this topic with an example. Consider two merchants, Merchant 1 and Merchant 2. Customers 1, 2, 3 and 4 shop at Merchant 1, while Customers 1, 2, 3 and 5 shop at Merchant 2, with multiple payment transactions connecting the merchants and their customers. The traditional solution based on a relational database will have a separate table for each entity type – merchant, customer account (such as credit or debit card) and payment. In order to find common customers, we need to join the three tables to build a new “answer” table. As the sizes of the tables grow, to millions of payments and hundreds of thousands to- millions of customers, answering a question as simple as “who are the common customers?” takes a long time. This becomes even more time-consuming and computationally expensive when we are looking to analyze and get insights from the data. For example, add up payments for common customers by week, by month and understand the changes over a period of time to the relationship – Is the relationship getting stronger or weaker over time? Are there specific customers who are shopping more often with these two merchants over time, while others are reducing their spend? Is there a particular pattern based on the payment time-stamps such as the customer is shopping with Merchant 1 first, followed by Merchant 2 within an hour or two?
Mapping out the relationship between two merchants with TigerGraph
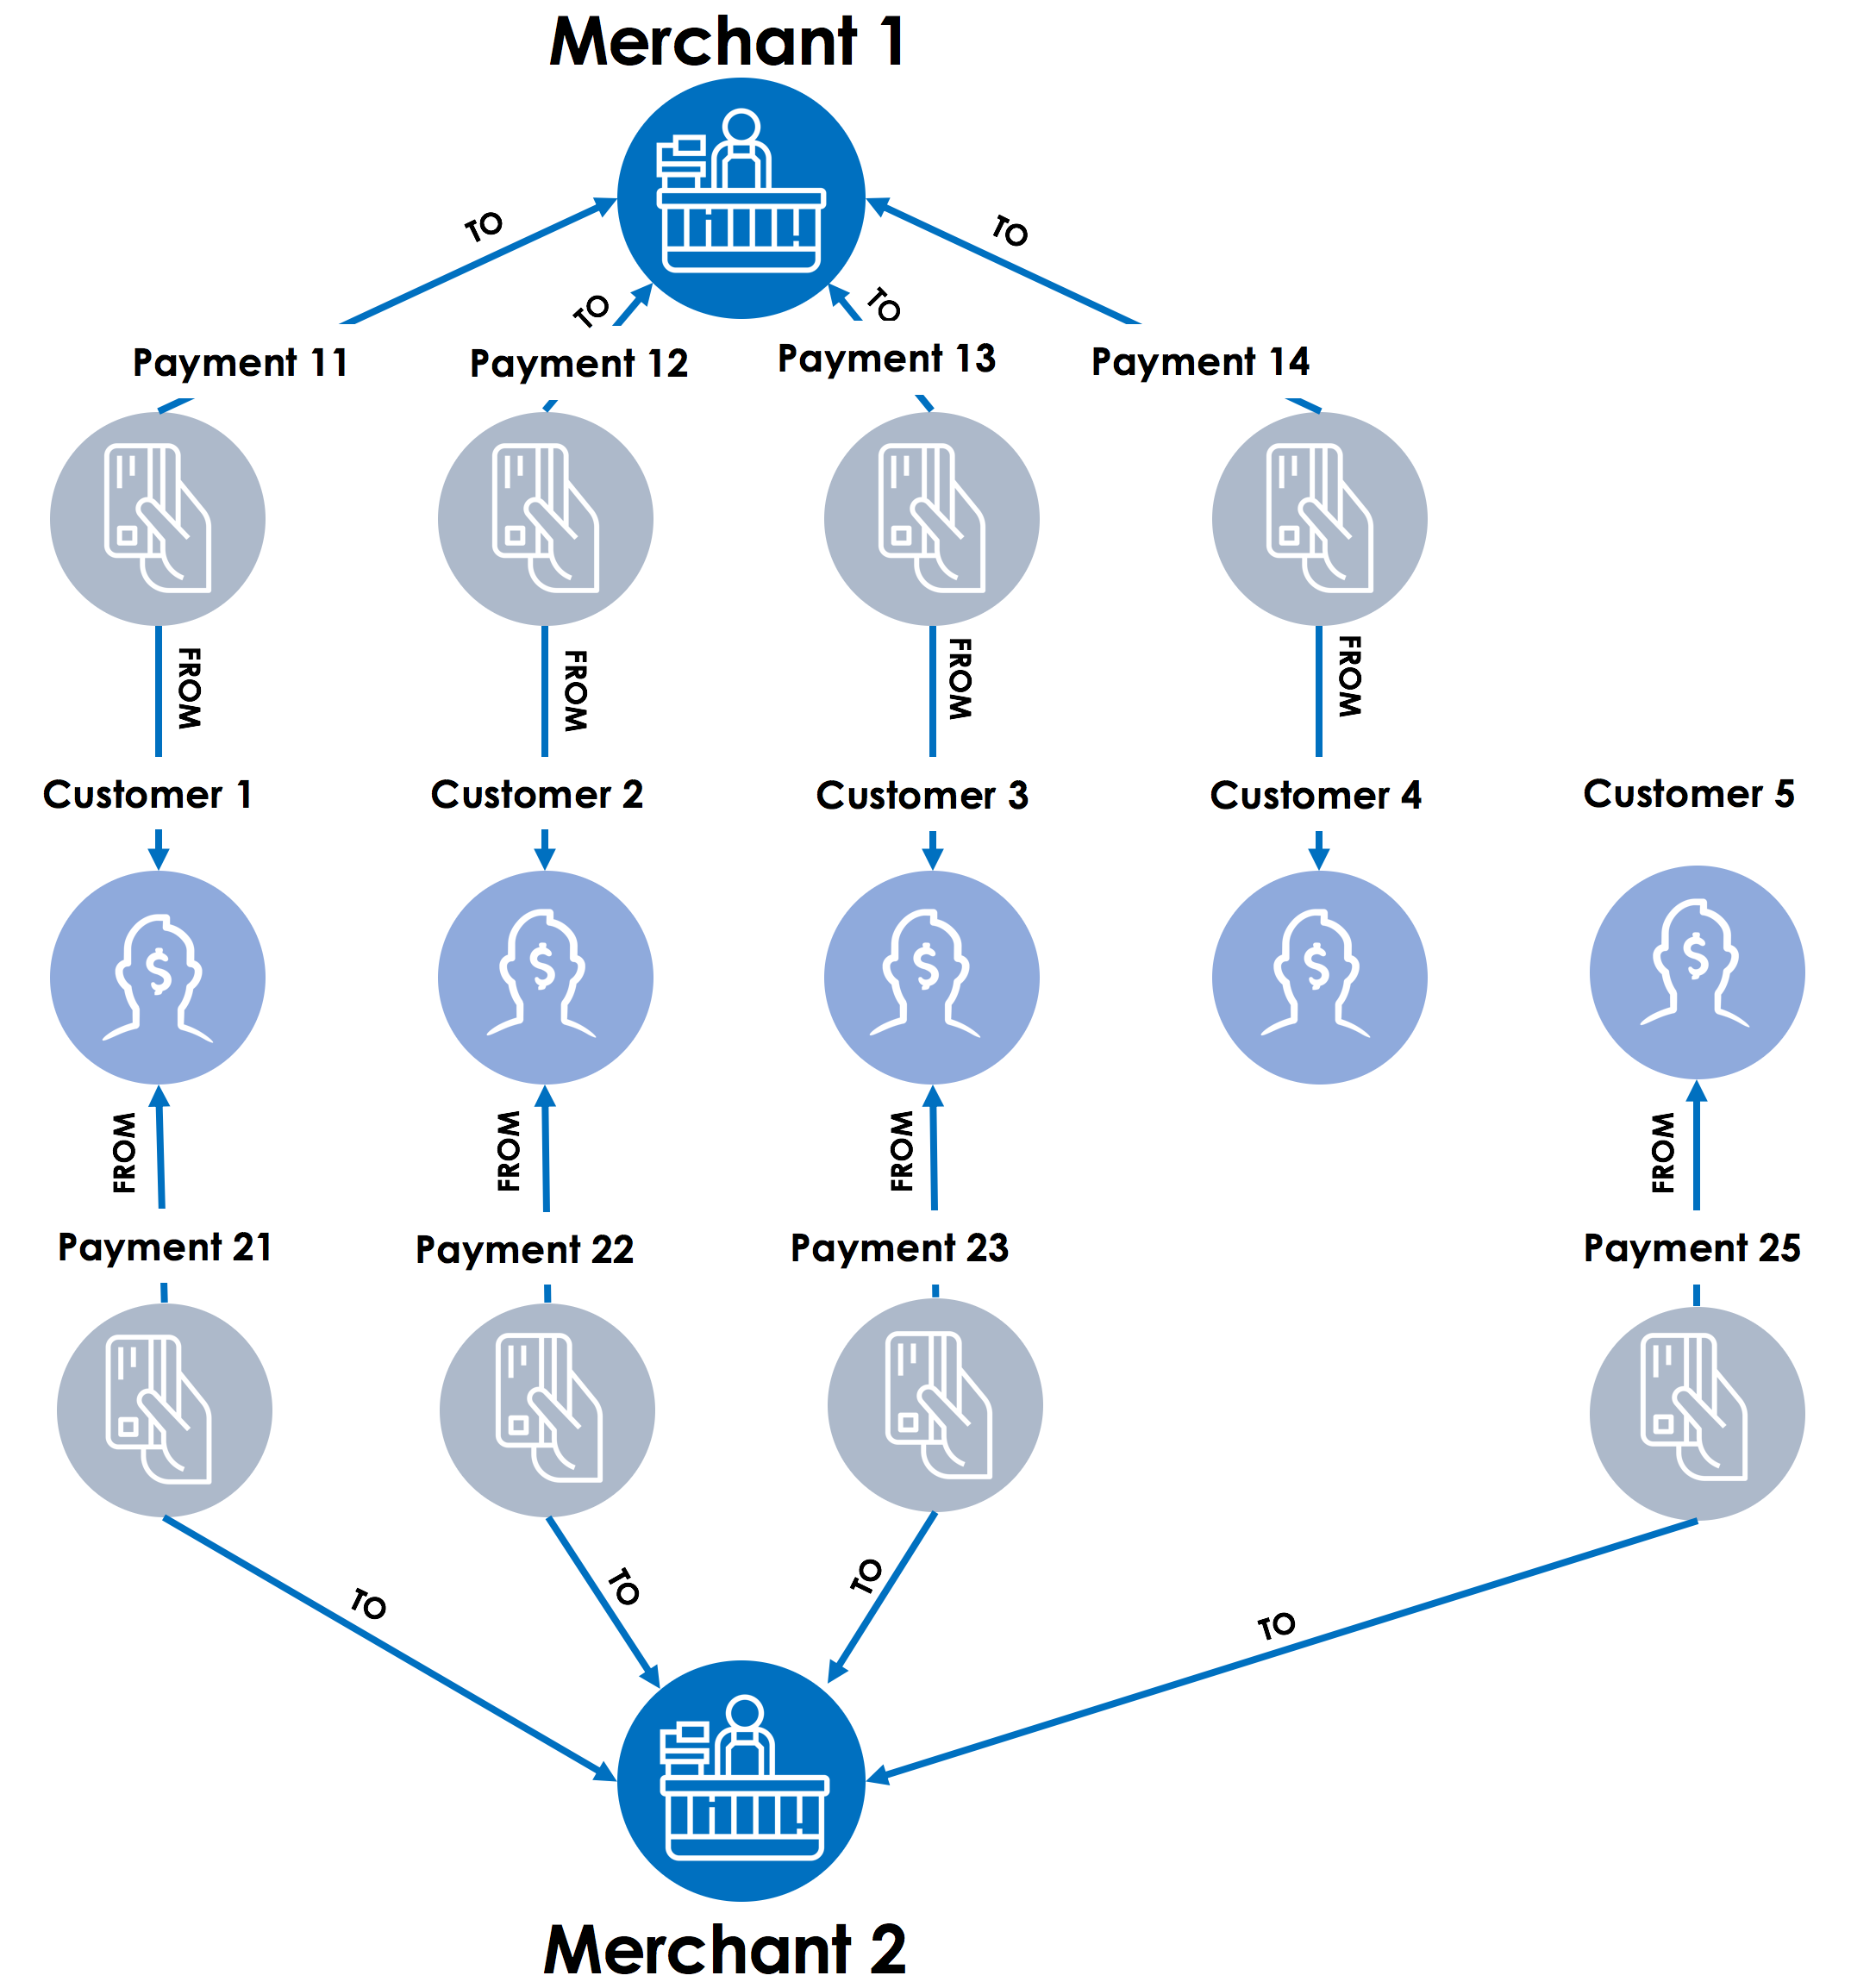
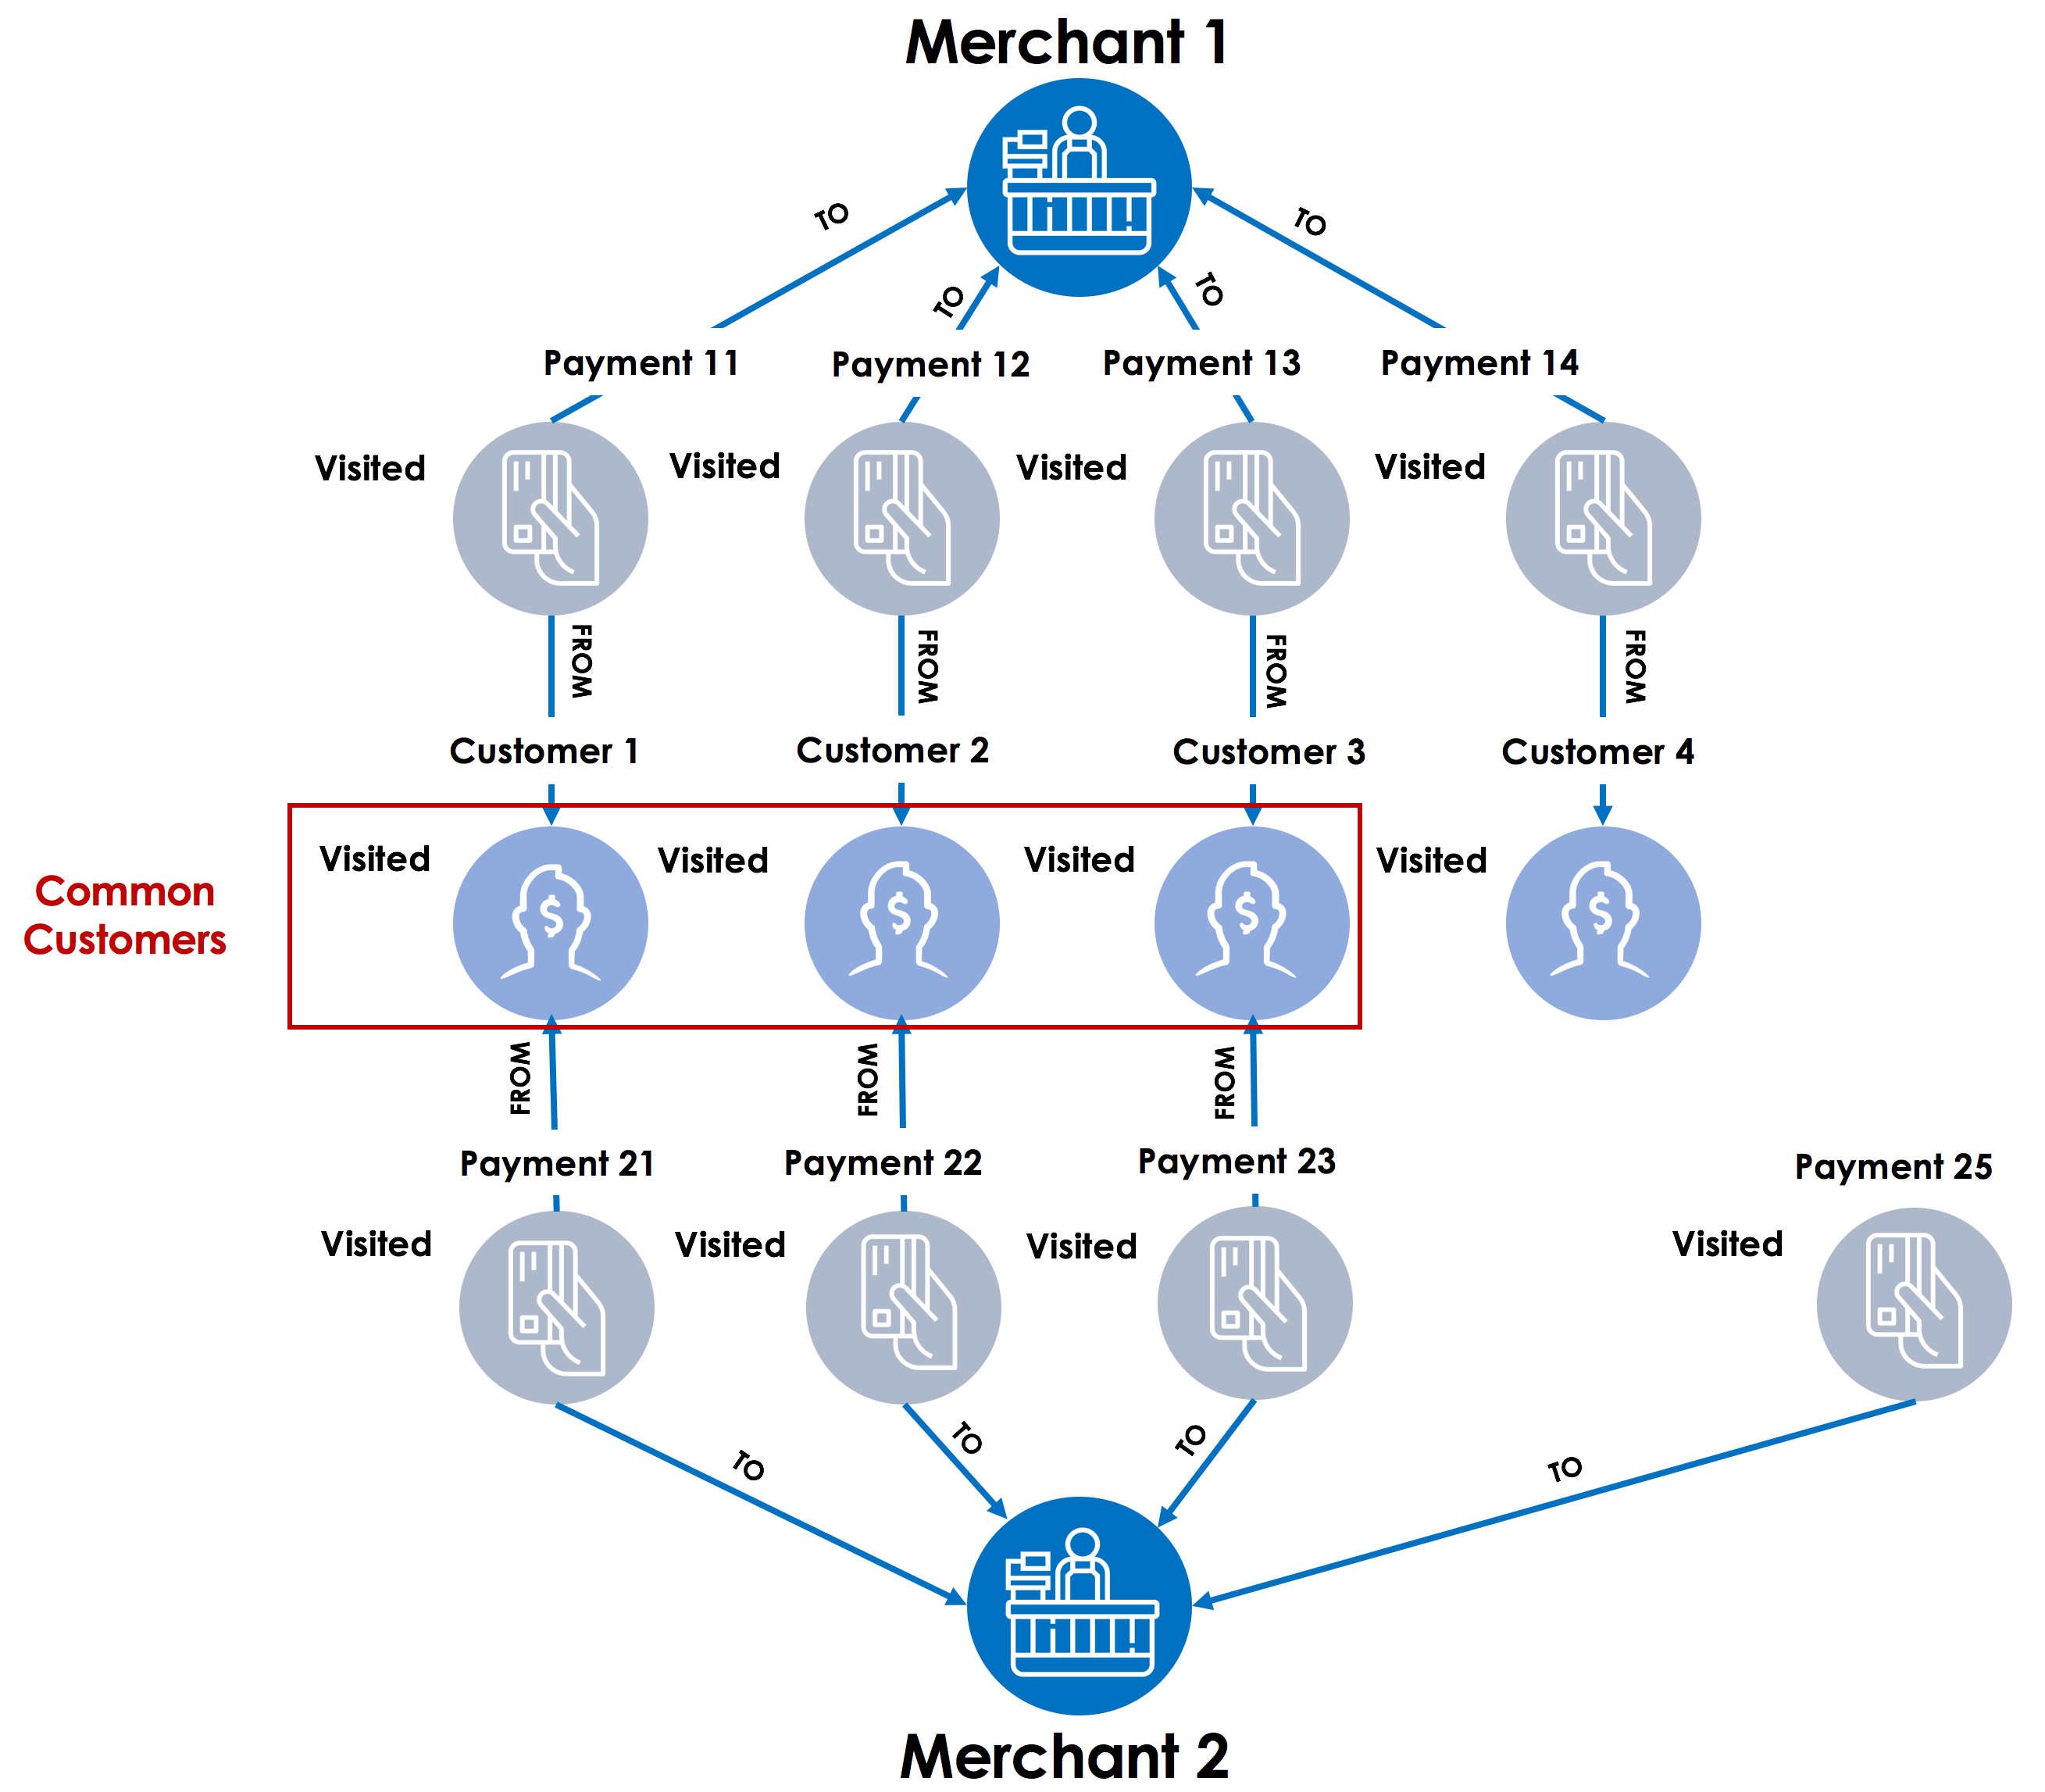
TigerGraph is a native graph platform, which means merchants, customer accounts, payments are represented as business entities with the relationships among them included in the data model. As you can see from the picture, it’s quite easy to visually find the common customers between the two merchants in TigerGraph’s Graphical User Interface (GUI), GraphStudio. But how do you find and export the common customers as a part of a real-time GSQL query? How do you add up the spend among common customers? This is where the accumulators come in.
Walking or traversing the graph to find the common customers
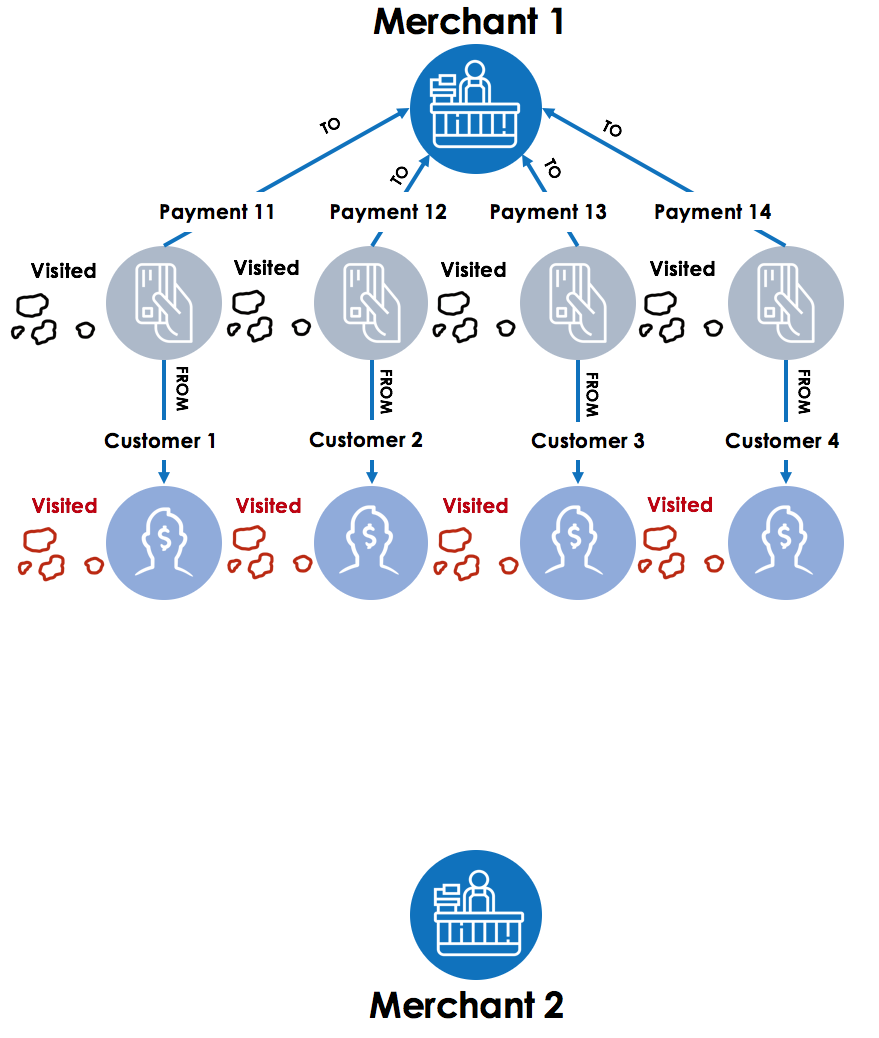
Step 1 – The graph traversal starts with Merchant 1, then travels back across the fund transfer links towards all the payments for the merchant. TigerGraph will use a flag such as “visited” on each payment to remember which payments were visited as a part of walking or traversing the graph. This flag or local variable is an accumulator in GSQL. Much like Hansel and Gretel using the white pebbles to remember the path in the forest, TigerGraph analytics engine uses the “visited” accumulator (“pebble”) to remember the payments that are already visited.
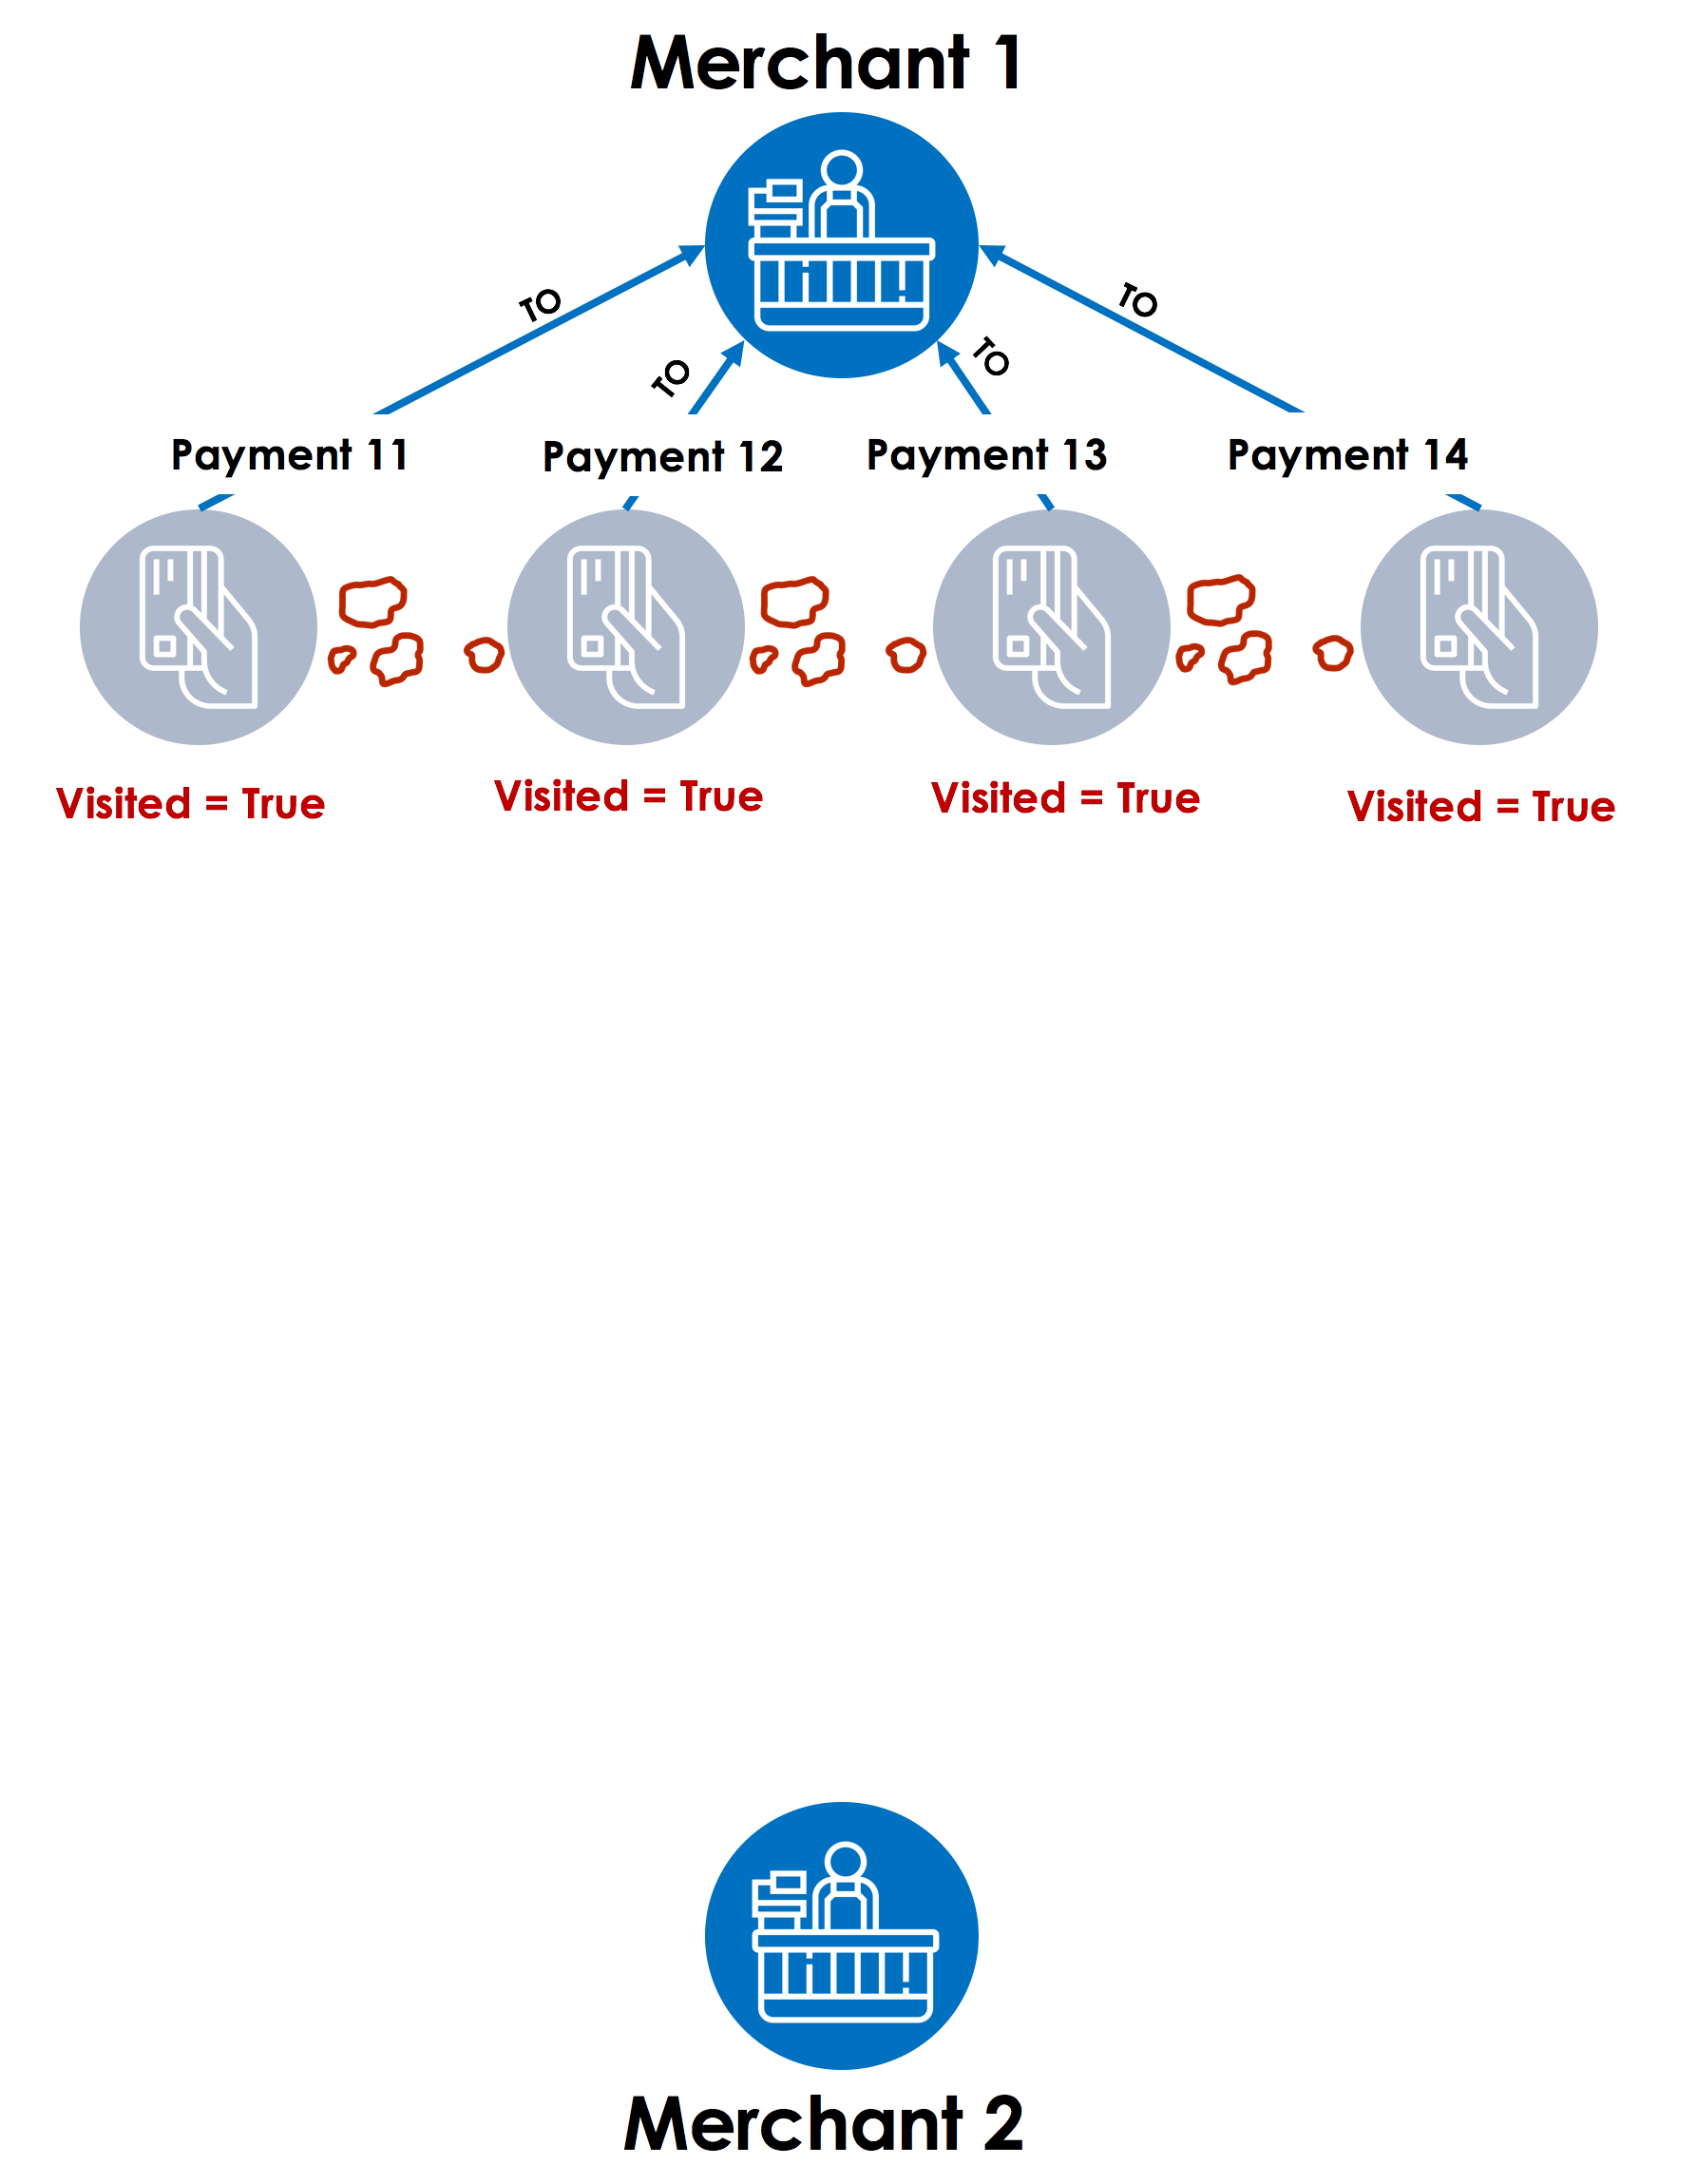
Step 2 – Next, the graph traversal engine moves to each payment in a parallel thread (with TigerGraph’s MPP – Massively Parallel Processing architecture) and looks at the customer accounts linked with those payments. After finding the customer accounts (Customer 1, 2, 3 and 4), the “visited” accumulator value is marked as “True” for those accounts.
Step 3 – Next step for the graph traversal starts from Merchant 2, looking at all the payments for the merchant. After finding all the payments linked to Merchant 2 (Payment 21, 22, 23 and 25), the “visited” accumulator value is marked as “True” for those payments, effectively marking the tree (vertex) in the forest (graph) with the pebble (accumulator).
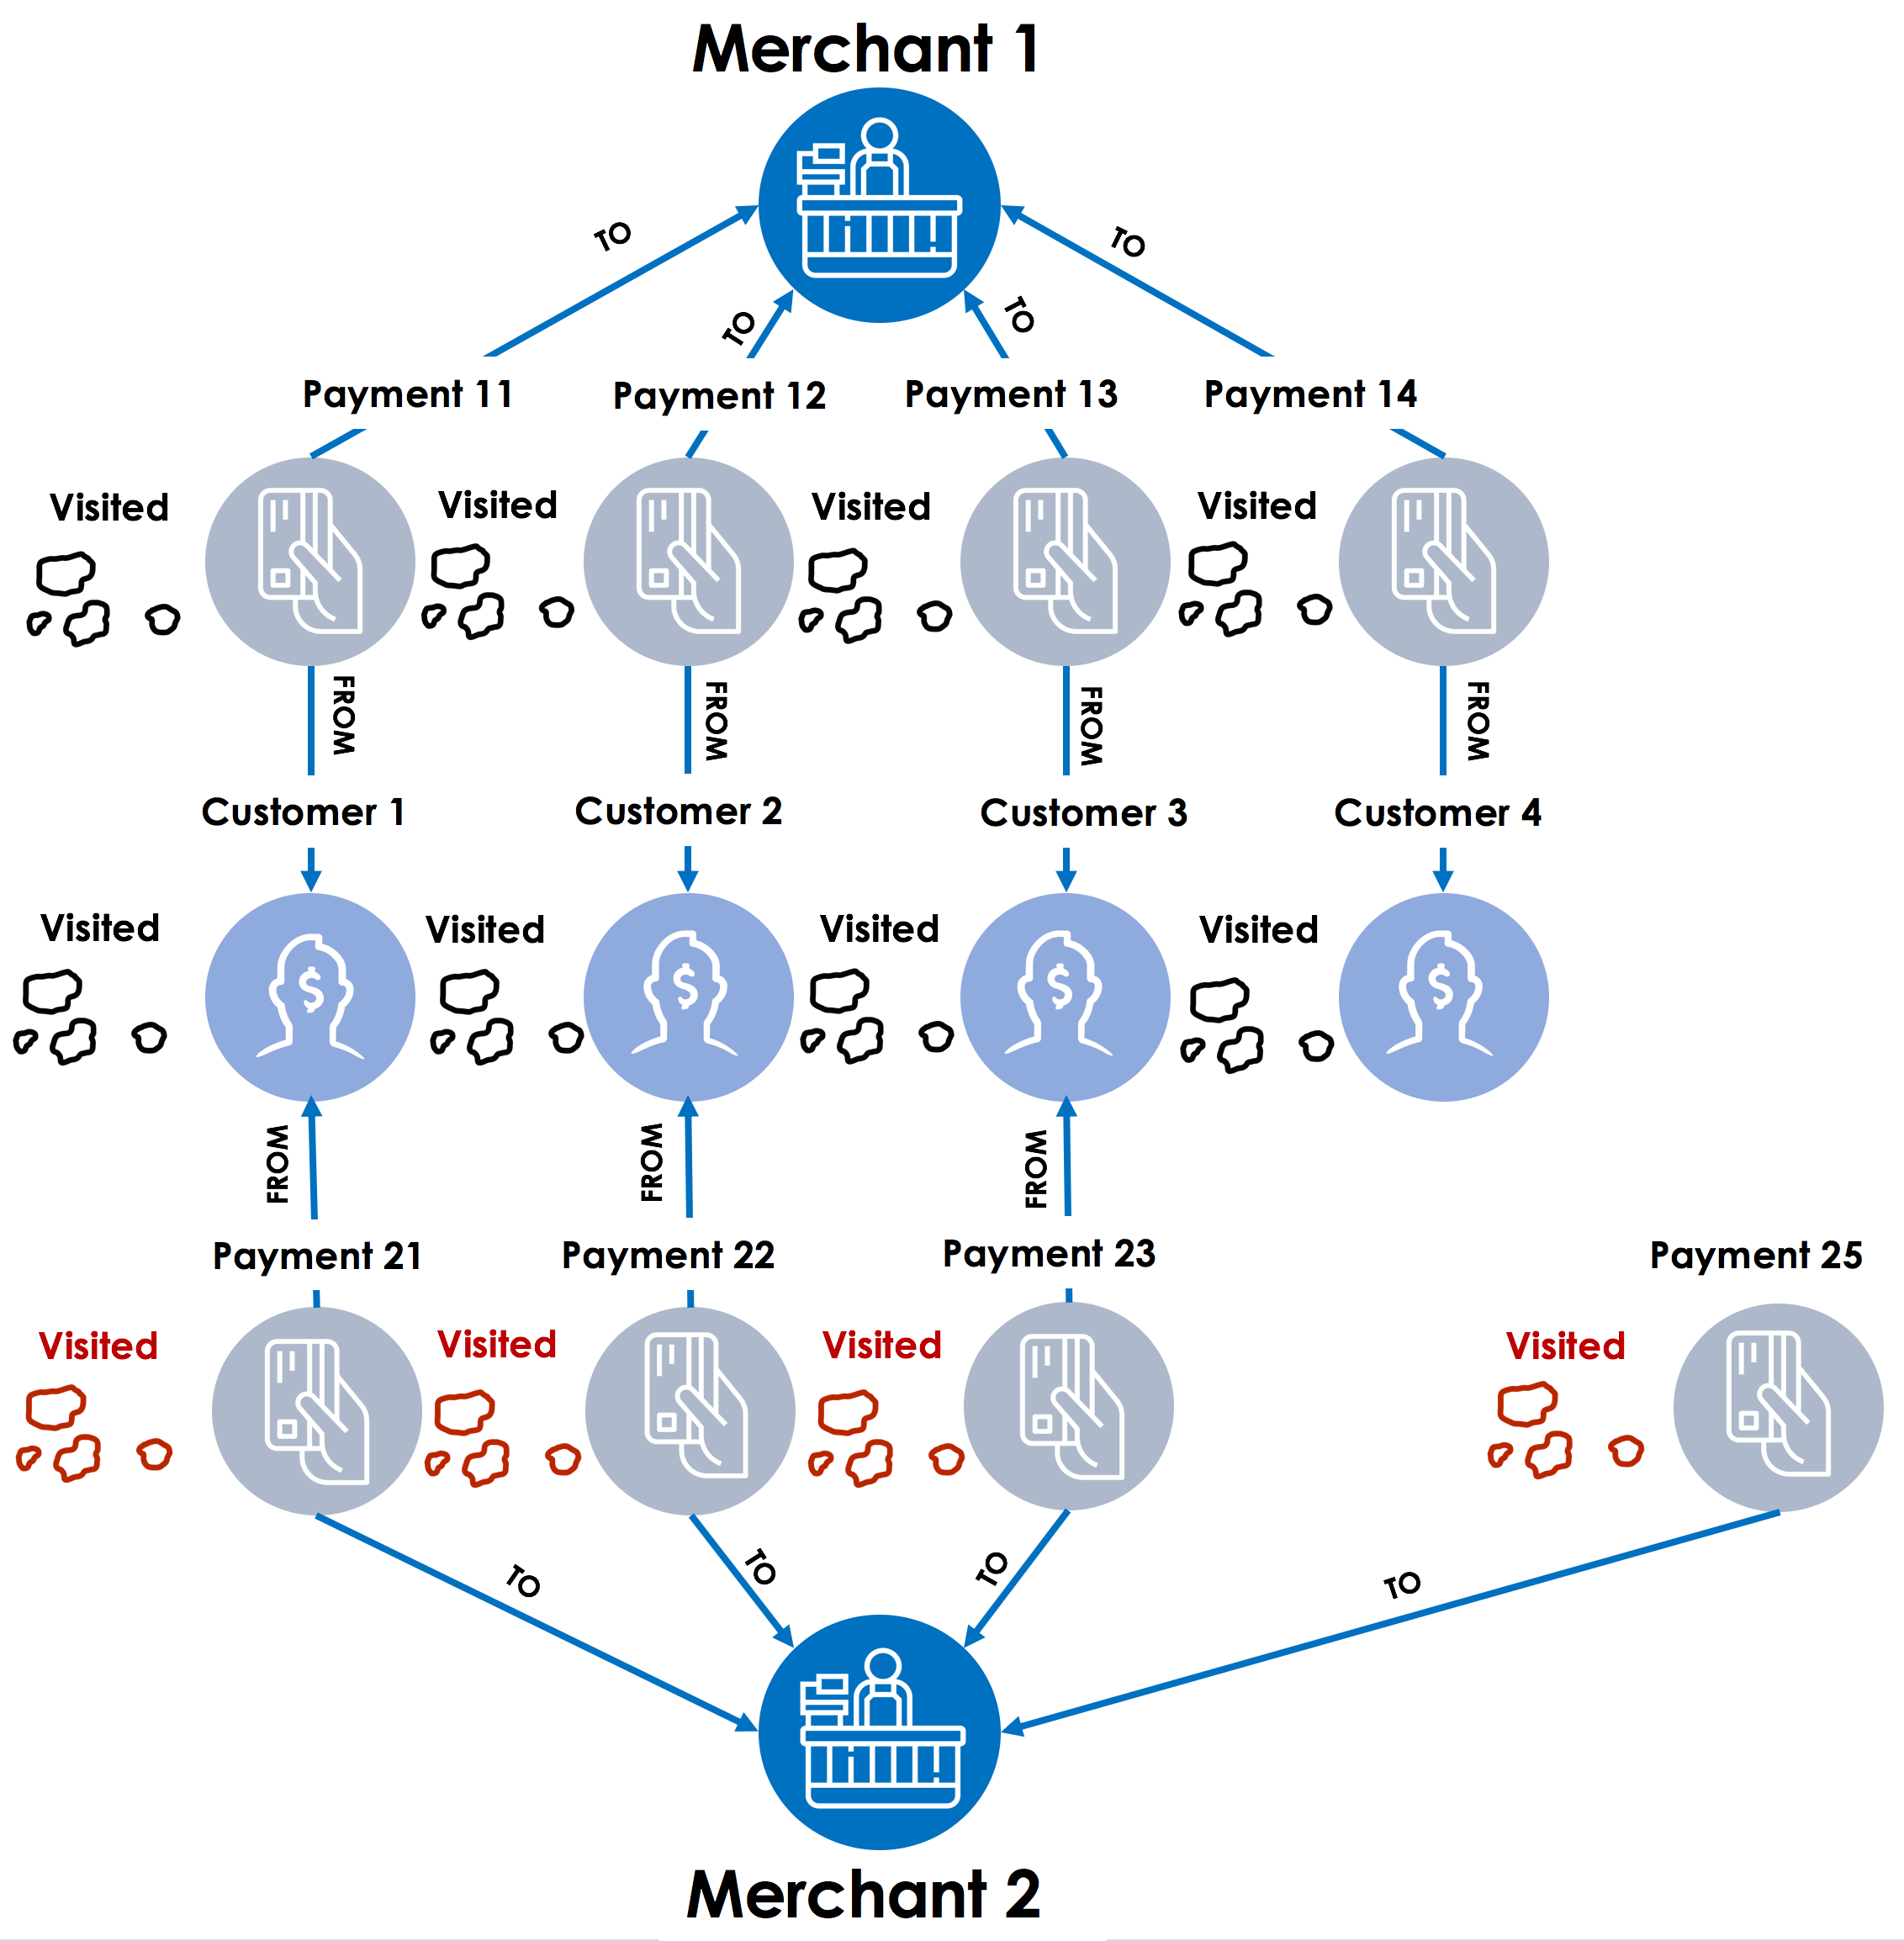
Step 4 – In the final step, graph traversal starts with all payments linked to merchant 2 and then look for customer vertices where the accumulator visited is set to true. These are the common customers between Merchant 1 and Merchant 2.
Magical pebbles aka accumulators in GSQL
Accumulators in GSQL do a lot more than just remember the path taken while traversing the graph or serve as markers while the graph algorithms traverse the topology. There are global accumulators that can be used to collect business entities (e.g. payments, customers, merchants) and edges or relationships among entities (e.g. payment from a customer or payment to a merchant) that meet certain criteria.
In this example, a global SetAccum accumulator can be used to collect business entities or vertices as well as relationships or edges and provide that collection to the TigerGraph GraphStudio or an external visualization engine so that the users can see the subgraph showing the relationship between Merchant 1 and Merchant 2. Starting with the three common customers, Customer 1, Customer 2 and Customer 3, one can traverse the graph to the two merchants in question, Merchant 1 and Merchant 2 in parallel, collect the payments linked to common customers, and store them in a SetAccum global accumulator called “CommonPayments”. In this case, CommonPayments will collect Payment 11, 12 and 13 for Merchant 1 and Payment 21, 22 and 23 for Merchant 2. Next, the amounts for these payments can be added up to determine the total spend by common customers between these two merchants, and even track those over a period of time to understand changes in the spending pattern over weeks, months or years.

In addition to acting as local or global variables, accumulators also provide computational functions such as Min, Max, Average, and Sum and are capable of holding a single value or a collection of business entities and relationships. You can explore the accumulators in TigerGraph Documentation.
Combining accumulators with the TigerGraph’s Massively Parallel Processing (MPP) engine
Accumulators are designed to leverage TigerGraph’s MPP engine and support parallel computation at each vertex and each edge to maximize the throughput possible with your hardware for each query.
Imagine if Hansel and Gretel (the MPP threads) replicated themselves and ran along multiple paths in the forest (graph) while using the pebbles (accumulators) to keep track of each vertex visited and also compute summary information for those vertices (such as the sum of total payments for a customer with a merchant) without tripping over each other – that’s what accumulators combined with TigerGraph MPP deliver for datasets of all sizes. The ability to traverse the graph in parallel while keeping track of each path and performing complex calculations is unique to the combination of accumulators and TigerGraph MPP.
In fact, while we showed four steps (Step 1, 2, 3 and 4) to determine common customers between two merchants, the parallel nature of the TigerGraph platform combined with accumulators allows us to execute this in just two steps with graph traversal from Merchant 1 and Merchant 2 progressing simultaneously to find the common customers. In effect, Step 1(starting from Merchant 1) and Step 3 (starting from Merchant 2) are executed simultaneously. Step 2 and Step 4 are also executed in parallel to find common customers as well as the payments for those customers faster.
The TigerGraph team is working with the Graph Query Language (GQL) initiative to add accumulators as a standard feature for the graph query language. Experience the full performance, scalability, and elegance of TigerGraph GSQL including the accumulators and the graph analytics engine by downloading TigerGraph Developer Edition.
We also encourage you to view the Graph Gurus Episode 11 covering accumulators in-depth.