Impressively, banks are among the most digitized companies in the world, offering customers important services instantaneously, such as payments, cash withdrawals, transfers, conversions, and balance checks. We have grown so accustomed to real-time banking operations our lives revolve around their services with contactless payments, financial management through a dedicated app, and more.
The progress in this industry has largely been fueled by a fast-paced and disruptive fintech sector. With so many innovative startups successfully winning over newer generations of customers, traditional banks have had to alter strategy to keep pace with rising customer expectations.
In many instances, this has meant rapidly building new features into (and over the top of) legacy systems that were never intended for the advanced banking environment they support today. This has led to architectural compromises and less-resilient infrastructure.
As a result, we have seen all over the world the very real and human impacts that are felt when a banking system goes down, halting payments, transfers, mobile services, and with it, pausing lives and livelihoods. Each event becomes a media hive, a PR nightmare for the business and a fascinating unfolding series of events for the general public.
In the face of such a high-profile issue, banks typically compile emergency teams to perform root cause analysis to identify the problem and design and deploy a fix within as short a timeframe as possible. This often involves identifying integration failures and data dependencies across a number of different systems, and data stores within those systems. It also involves multiple stakeholders whose knowledge is critical to both understanding and rectifying the issue.
And crucially, no one person has all of the knowledge required to resolve the issue. Instead, it takes a collaborative effort across different parts of the organization to do so.
Operational Excellence with TigerGraph
At TigerGraph, we know that the flow of data, and the dependencies between different data tables, as well as system owners and data stakeholders, can all be viewed together in one holistic, connected data map or network. With that sort of end-to-end visibility, it becomes possible to analyze and understand exactly what is happening in the moment — or to predict what will happen — should a change or problem occur anywhere in the data landscape.
So when we say ‘real-time data operations,’ that is exactly what we mean: the visibility into your data landscape that enables you to predict or rapidly analyze issues that may otherwise cause serious disruption to your banking business operations. We help identify problems early so your operations remain safe and resilient now and in the future.
In this article, we will walk through three banking scenarios:
- Account Migration Error
- SLA Impact Assessment
- Risk Analysis
Scenario 1: Account Migration Error
Let’s imagine a retail bank is replacing its core banking system with one from a bank it’s just merged with.
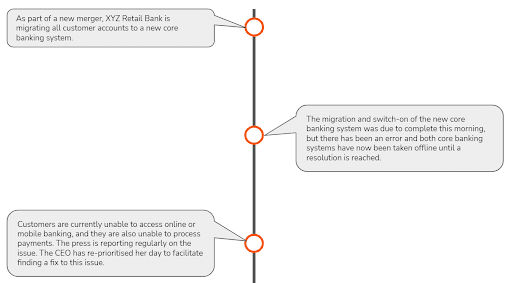
Given the high-profile nature of the failure, this is an urgent, share price-impacting issue. Janie, the implementation manager, is in charge of driving the team towards a fix as quickly as possible and has full support from the CEO. Her team must investigate every possible reason for the failure in order to identify the root cause, which is how they will determine the fix.
How might Janie’s actions be facilitated by TigerGraph?
WITHOUT TigerGraph | WITH TigerGraph |
|
|
TigerGraph becomes a digital replica of how all of the bank’s systems integrate together, modeling data networks and dependencies, as well as data owners and stakeholders. The model includes exactly which data tables are used or links to the account data from the core banking system that is being replaced.
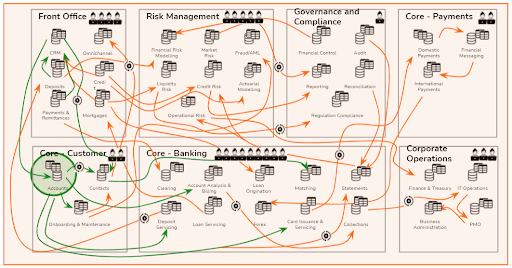
It would then enable Janie’s team to explore exactly what has gone wrong and to directly see that the error has occurred in migrating some specific account types into the new system.
Let’s consider an example question Janie’s team might ask of TigerGraph. Her team might query where the data for a specific account type is usually propagated, both upstream and downstream, of the account master database.
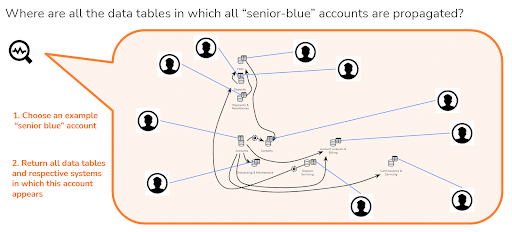
The result: Janie’s team is able to identify rapidly both before and after the switchover which data tables may be affected by the switchover and who owns those systems. Before the switchover, this enables the team to run all of the appropriate design and testing required, with the appropriate owners. After the switchover, this then also enables them to investigate anything they may have missed beforehand. The time to resolution is reduced, as is the cost and negative PR associated with the issue.
Scenario 2: SLA Impact Assessment
Let’s imagine a bank has a number of SLAs in place for customers, including how quickly they cancel credit cards upon request or how quickly they rectify a problem with a payment appearing in a payee’s account. The bank is keen to cut costs by automating the processes involved while remaining compliant with SLA timelines.
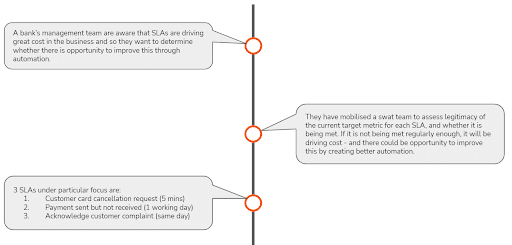
The SWAT team is charged with identifying all existing processes and automations in place to support SLAs, and assessing potential efficiencies that could be gained.
Every process and system automation has a business owner and a data owner, and there are multiple systems usually involved with each step of each workflow. Between them, the SWAT team already knows some of this information from having worked in the business, but knowledge gaps exist the team needs to overcome. but there are gaps in knowledge that need to be filled in quickly to do this analysis properly.
How might TigerGraph change the way the implementation team is able to analyze dependency risks?
WITHOUT TigerGraph | WITH TigerGraph |
|
|
TigerGraph would hold a digital model showing how all systems across the end-to-end banking architecture are connected together. The digital model would determine which data travels upstream and downstream, with which triggers, as well as interested owners and stakeholders.
The SWAT team would be able to scan all dependencies, drilling down on anything that may be of interest and understand the right person to contact for any dependency.
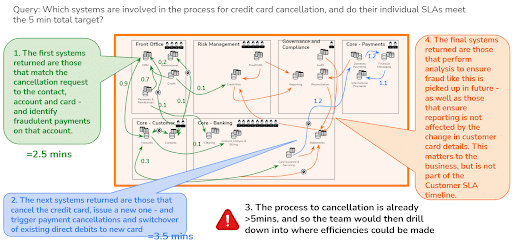
The result: The SWAT team can rapidly identify potential opportunities to create efficiency, with confidence that it’s unlikely to have missed anything. Ultimately, the SWAT team saves time, builds confidence with the management team, and reduces cost and risk to the business.
Scenario 3: Risk Analysis
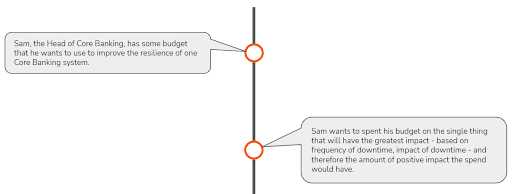
In this scenario, Sam, the Head of Core Banking, is looking to identify the best way to spend his remaining budget this financial quarter. He wants to fund the system fix or upgrade that will have the best possible impact on the business.
How might TigerGraph facilitate Sam’s risk analysis in a way he wouldn’t otherwise be empowered to do?
WITHOUT TigerGraph | WITH TigerGraph |
|
|
How would TigerGraph help calculate risk score to aid prioritization?
Because TigerGraph models how every system, data table, and data item work together in an interdependent network of integrations, it is able to “see” which components of that network hold the highest number of dependencies. It is also able to compare failure rates if each system or data component holds information on how often errors happen, as well as calculate the severity of effects on upstream and downstream systems.
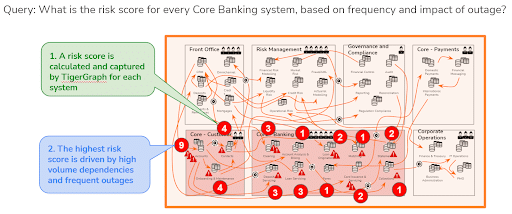
The result: Sam can identify very quickly where he could have the greatest positive impact by spending his remaining budget without making multiple calls or relying on anecdotal information. Ultimately, this saves time for Sam and his team, makes his decisions more effective, and ensures the greatest positive impact on the efficiency of the business.
Getting Started with TigerGraph
You can download our free product if you’d like to get your hands on it straight away. Or you can reach out directly to our sales team if you’d like to see a demo, and talk about how we could run a proof of concept with you using some of your data.