Skip to content
START FOR FREE
START FOR FREE
  • SUPPORT
  • COMMUNITY
Menu
  • SUPPORT
  • COMMUNITY
MENUMENU
  • Products
    • The World’s Fastest and Most Scalable Graph Platform

      LEARN MORE

      Watch a TigerGraph Demo

      TIGERGRAPH CLOUD

      • Overview
      • TigerGraph Cloud Suite
      • FAQ
      • Pricing

      USER TOOLS

      • GraphStudio
      • Insights
      • Application Workbenches
      • Connectors and Drivers
      • Starter Kits
      • openCypher Support

      TIGERGRAPH DB

      • Overview
      • GSQL Query Language
      • Compare Editions

      GRAPH DATA SCIENCE

      • Graph Data Science Library
      • Machine Learning Workbench
  • Solutions
    • The World’s Fastest and Most Scalable Graph Platform

      LEARN MORE

      Watch a TigerGraph Demo

      Solutions

      • Solutions Overview

      INCREASE REVENUE

      • Customer Journey/360
      • Product Marketing
      • Entity Resolution
      • Recommendation Engine

      MANAGE RISK

      • Fraud Detection
      • Anti-Money Laundering
      • Threat Detection
      • Risk Monitoring

      IMPROVE OPERATIONS

      • Supply Chain Analysis
      • Energy Management
      • Network Optimization

      By Industry

      • Advertising, Media & Entertainment
      • Financial Services
      • Healthcare & Life Sciences

      FOUNDATIONAL

      • AI & Machine Learning
      • Time Series Analysis
      • Geospatial Analysis
  • Customers
    • The World’s Fastest and Most Scalable Graph Platform

      LEARN MORE

      CUSTOMER SUCCESS STORIES

      • Ford
      • Intuit
      • JPMorgan Chase
      • READ MORE SUCCESS STORIES
      • Jaguar Land Rover
      • United Health Group
      • Xbox
  • Partners
    • The World’s Fastest and Most Scalable Graph Platform

      LEARN MORE

      PARTNER PROGRAM

      • Partner Benefits
      • TigerGraph Partners
      • Sign Up
      TigerGraph partners with organizations that offer complementary technology solutions and services.​
  • Resources
    • The World’s Fastest and Most Scalable Graph Platform

      LEARN MORE

      BLOG

      • TigerGraph Blog

      RESOURCES

      • Resource Library
      • Benchmarks
      • Demos
      • O'Reilly Graph + ML Book

      EVENTS & WEBINARS

      • Graph+AI Summit
      • Graph for All - Million Dollar Challenge
      • Events &Trade Shows
      • Webinars

      DEVELOPERS

      • Documentation
      • Ecosystem
      • Developers Hub
      • Community Forum

      SUPPORT

      • Contact Support
      • Production Guidelines

      EDUCATION

      • Training & Certifications
  • Company
    • Join the World’s Fastest and Most Scalable Graph Platform

      WE ARE HIRING

      COMPANY

      • Company Overview
      • Leadership
      • Legal Terms
      • Patents
      • Security and Compliance

      CAREERS

      • Join Us
      • Open Positions

      AWARDS

      • Awards and Recognition
      • Leader in Forrester Wave
      • Gartner Research

      PRESS RELEASE

      • Read All Press Releases
      TigerGraph Recognized in 2022 Gartner® Critical Capabilities for Cloud Database Management Systems for Analytical Use Cases
      January 12, 2023
      Read More »

      NEWS

      • Read All News

      A Shock to the System: ShockNet Predicts How Economic Shocks Could Affect the World Economy

      TigerGraph Recognized for the First Time in the 2022 Gartner® Magic Quadrant™ for Cloud Database Management Systems

  • START FREE
    • The World’s Fastest and Most Scalable Graph Platform

      GET STARTED

      • Request a Demo
      • CONTACT US
      • Try TigerGraph
      • START FREE
      • TRY AN ONLINE DEMO

Accelerated Graph Analytics to Answer Complex Business Questions

  • TigerGraph
  • March 30, 2022
  • blog, Community, Graph Databases
  • Blog >
  • Accelerated Graph Analytics to Answer Complex Business Questions

This is an abbreviated and edited version of a presentation by Bob DeCarlo, General Manager, Global Accounts, Financial Services, Bank of America at HPE, and Delvon Jones, Director and Chief Technologist at HPE, during the Fall 2021 Graph + AI Summit.

Watch the full session from Graph + AI Summit Fall

The use of graph analytics at large institutions as well as for unique business cases is on the rise. The question is: what does graph analytics offer that’s making this technology more prevalent every day? Simply put, connected data leads to connected insights. Graph analytics is able to explore and analyze data across many different platforms, and in hybrid environments, to drive better business insights and outcomes. 

Use case examples include:

  • An international bank uses graph analytics for anti-fraud and anti-money laundering initiatives, saving hundreds of millions of dollars 
  • Healthcare and pharma organizations use graph analytics for patient 360, and a savings of $150 million
  • A customer-oriented company uses graph analytics to provide real-time recommendations for up to 300 million customers.

Let’s look at a banking example more closely. 

Over the course of a year, the Chief Data Officer could have: 

Challenges

  • 200 billion data queries originating from over 250 petabytes across multiple data warehouses
  • 10,000 complaints with upwards of $500 million dollars of risk 
  • 2,000 projects, across hundreds of programs, managed by groups who have to follow international and domestic (50 states) of compliance laws and tax laws 
  • 100,000 employees to train on policy changes.

Obstacles

  • Time to market: bare metal lacks agility, and customers/stakeholders could be penalized due to delays
  • Cost: 30-40% in data growth but difficult to make accurate predictions on data services
  • Complexity: increased complexity and lack of customer empowerment due to self-service models
  • Productization: new data workloads that benefit from larger CPUs and GPUs (with smaller windows to do the infrastructure capabilities). 

HPE and TigerGraph

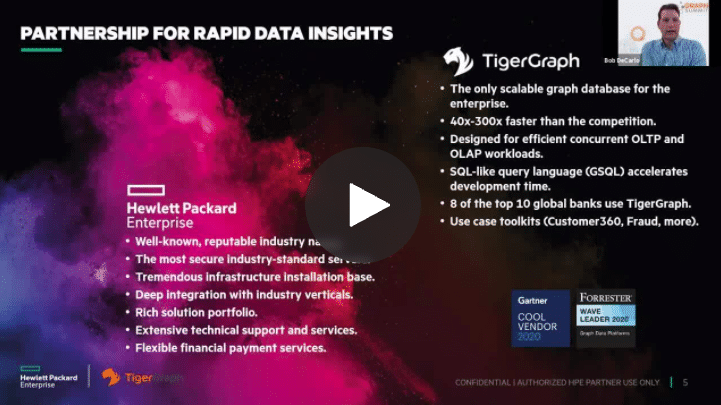
Let’s take a quick look at how Hewlett Packard Enterprise (HPE) and TigerGraph partner to deliver better integrated data science platforms to provide solutions for these and other large, complex business issues. 

HPE offers secure industry standard servers, and platform-oriented solutions that offer both capital purchase options, as well as consumption base, where you pay as you grow and use it as a utility. With a rich solution portfolio, HPE has a footprint in the majority of financial institutions, partnering with them on these unique use cases. 

Why does HPE partner with TigerGraph for graph analytics?

The cool vendor out there is TigerGraph. It’s a scalable graph database for the Enterprise. It’s faster than what’s typically in the marketplace today, in a very fast growing technology sector, and they have a good customer set. They have unique toolkits for:  

  • Fraud detection and anti-money laundering
  • Merchant analytics and payment systems
  • Credit scoring data 
  • Wealth management
  • 360 degree customer view for risk and opportunity assessment
  • Trade surveillance and compliance.

What we see from an impact analysis by looking at the analytics and the trends, longer term, as well as looking at what’s happening today, is we’re immediately getting closer to real-time analytics where you can make decisions on behalf of your customers and partners. Why is this increasingly important?  

Digital Usage Is on the Rise

The amount of fraud and identity theft reports are up from 2019, and there is a direct correlation to COVID. During COVID, one third of U.S. citizens tried ecommerce for the first time with a satisfaction rate of 96%. This represents new users actually jumping into the digital space, increasing the potential for more fraud. In fact, fraud may impact businesses by as much as $6 trillion in 2021.

Increasing and Changing Threats

Along with the increase in actual customers, the threat categories are changing as well. Some of the offenders include wire transfers and credit cards, but there’s also a lot of fraud going after payment gateways, rewards programs, points, etc. To reap the rewards of loyalty programs, people open up second email accounts to accumulate points and get the cash rewards by using different credit cards. There’s a real cost to the institution when people double up by opening and closing cards. 

Edging Towards a Cashless Society

The amount of users globally who prefer to use a card over cash (Reference: STATISTICA) is growing as well. For example, South Korea is at 77% while the U.S. is at 58%. Although the U.S. is nearly 20 percentage points lower, the amount per user is the highest in the world, spending, on average, approximately $7,800 per person. China has the most transactions, but the average spend per user is half. 

Customer Experience is #1

Customer experience is number one in importance for customers right now. You don’t want to be in the scenario where you deny legitimate purchases while approving fraudulent ones. Gen Z and millennials are especially intolerant: they’ll either swap to another card, so the institution loses the transaction fee, or they’ll just switch to another vendor or bank. Banks and FinTechs are all fighting to control the interactions of a user. That’s the new battleground. 

The security threats are changing, and the threat surface is expanding. If you think about what it takes to now protect your business, as well as your clients, you have to analyze vast amounts of data at scale, and you need to do it in real time. It’s almost like if you’re speeding down the road, and your radar detector goes off, telling you you’ve been caught. If you’re a big bank, and you’ve run a batch at night and identified a billion dollars worth of fraud, it’s already too late. So how do you get ahead of that? 

One of the things that TigerGraph is so great at doing is tying all this vast information together, creating a holistic view, and then visualizing it. As an example, to identify fraud rings, there’s a principal in the middle of a chart and you can see the outflows of data going away from that principal. 

You can see if the money is flowing through connected entities, and then coming back to that individual. So what that means from a low code, no code perspective, it’s very easy to analyze data to perform your investigations. TigerGraph has toolkits to help you with this. It makes it very intuitive, very easy for you to spot fraud. The data almost speaks to you visually. 

Without having technology like this, if you’re looking at data in isolation at this scale, and given where we’re going globally, it’s almost impossible to keep on top of this, especially from a real-time perspective. 

Wrap-Up

Going back to a very large bank as an example of how this all comes together. You have massive data coming from multiple sources, and you need to collect and store the data. From an architecture perspective, HPE creates platforms that span edge to cloud. TigerGraph needs a platform that’s fast and secure to run on top of, and Xilinx comes in to speed up the time that it takes to gain insights. 

The combined TigerGraph, HPE and Xilinx platform helps you get to real-time processing and analytics, and can also scale as a company’s transactions increase. The way that TigerGraph ties the data together, ranks the relationships and presents it all visually can produce $50+ million ROI in a use case such as credit card applications.

Having the ability to tie all the data together, TigerGraph also makes additional features available that you can then plug into your ML, or plug into your AI, making your cybersecurity that much better. All in all, it’s very good technology. Most banks use graph technology for that very reason.

Spring 2022 Graph + AI Summit

The Spring 2022 Graph + AI Summit is coming up fast and we’re looking for speakers to contribute to the event! Visit our event page and submit your presentation idea. The call for speakers is open until April 11, 2022. Also, don’t forget to register for the Summit!

You Might Also Like

TigerGraph Showcases Unrivaled Performance at Scale

TigerGraph Showcases Unrivaled Performance at Scale

January 12, 2023
How to Create a Visual Graph Analytics Application Using TigerGraph Insights in 30 mins

How to Create a Visual Graph...

November 14, 2022
Turbocharge your business intelligence with TigerGraph’s ML Workbench on TigerGraph Cloud

Turbocharge your business intelligence with TigerGraph’s...

November 14, 2022

Introducing TigerGraph 3.0

July 1, 2020

Everything to Know to Pass your TigerGraph Certification Test

June 24, 2020

Neo4j 4.0 Fabric – A Look Behind the Curtain

February 7, 2020

TigerGraph Blog

  • Categories
    • blogs
      • About TigerGraph
      • Benchmark
      • Business
      • Community
      • Compliance
      • Customer
      • Customer 360
      • Cybersecurity
      • Developers
      • Digital Twin
      • eCommerce
      • Emerging Use Cases
      • Entity Resolution
      • Finance
      • Fraud / Anti-Money Laundering
      • GQL
      • Graph Database Market
      • Graph Databases
      • GSQL
      • Healthcare
      • Machine Learning / AI
      • Podcast
      • Supply Chain
      • TigerGraph
      • TigerGraph Cloud
    • Graph AI On Demand
      • Analysts and Research
      • Customer 360 and Entity Resolution
      • Customer Spotlight
      • Development
      • Finance, Banking, Insurance
      • Keynote
      • Session
    • Video
  • Recent Posts

    • It’s Time to Harness the Power of Graph Technology [Infographic]
    • TigerGraph Showcases Unrivaled Performance at Scale
    • TigerGraph 101 An Introduction to Graph | Jan 26th @ 9am PST
    • Data Science Salon New York
    • Tech For Retail
    TigerGraph

    Product

    SOLUTIONS

    customers

    RESOURCES

    start for free

    TIGERGRAPH DB
    • Overview
    • Features
    • GSQL Query Language
    GRAPH DATA SCIENCE
    • Graph Data Science Library
    • Machine Learning Workbench
    TIGERGRAPH CLOUD
    • Overview
    • Cloud Starter Kits
    • Login
    • FAQ
    • Pricing
    • Cloud Marketplaces
    USEr TOOLS
    • GraphStudio
    • TigerGraph Insights
    • Application Workbenches
    • Connectors and Drivers
    • Starter Kits
    • openCypher Support
    SOLUTIONS
    • Why Graph?
    industry
    • Advertising, Media & Entertainment
    • Financial Services
    • Healthcare & Life Sciences
    use cases
    • Benefits
    • Product & Service Marketing
    • Entity Resolution
    • Customer 360/MDM
    • Recommendation Engine
    • Anti-Money Laundering
    • Cybersecurity Threat Detection
    • Fraud Detection
    • Risk Assessment & Monitoring
    • Energy Management
    • Network & IT Management
    • Supply Chain Analysis
    • AI & Machine Learning
    • Geospatial Analysis
    • Time Series Analysis
    success stories
    • Customer Success Stories

    Partners

    Partner program
    • Partner Benefits
    • TigerGraph Partners
    • Sign Up
    LIBRARY
    • Resources
    • Benchmark
    • Webinars
    Events
    • Trade Shows
    • Graph + AI Summit
    • Million Dollar Challenge
    EDUCATION
    • Training & Certifications
    Blog
    • TigerGraph Blog
    DEVELOPERS
    • Developers Hub
    • Community Forum
    • Documentation
    • Ecosystem

    COMPANY

    Company
    • Overview
    • Careers
    • News
    • Press Release
    • Awards
    • Legal
    • Patents
    • Security and Compliance
    • Contact
    Get Started
    • Start Free
    • Compare Editions
    • Online Demo - Test Drive
    • Request a Demo

    Product

    • Overview
    • TigerGraph 3.0
    • TIGERGRAPH DB
    • TIGERGRAPH CLOUD
    • GRAPHSTUDIO
    • TRY NOW

    customers

    • success stories

    RESOURCES

    • LIBRARY
    • Events
    • EDUCATION
    • BLOG
    • DEVELOPERS

    SOLUTIONS

    • SOLUTIONS
    • use cases
    • industry

    Partners

    • partner program

    company

    • Overview
    • news
    • Press Release
    • Awards

    start for free

    • Request Demo
    • take a test drive
    • SUPPORT
    • COMMUNITY
    • CONTACT
    • Copyright © 2023 TigerGraph
    • Privacy Policy
    • Linkedin
    • Facebook
    • Twitter

    Copyright © 2020 TigerGraph | Privacy Policy

    Copyright © 2020 TigerGraph Privacy Policy

    • SUPPORT
    • COMMUNITY
    • COMPANY
    • CONTACT
    • Linkedin
    • Facebook
    • Twitter

    Copyright © 2020 TigerGraph

    Privacy Policy

    • Products
    • Solutions
    • Customers
    • Partners
    • Resources
    • Company
    • START FREE
    START FOR FREE
    START FOR FREE
    TigerGraph
    PRODUCT
    PRODUCT
    • Overview
    • GraphStudio UI
    • Graph Data Science Library
    TIGERGRAPH DB
    • Overview
    • Features
    • GSQL Query Language
    TIGERGRAPH CLOUD
    • Overview
    • Cloud Starter Kits
    TRY TIGERGRAPH
    • Get Started for Free
    • Compare Editions
    SOLUTIONS
    SOLUTIONS
    • Why Graph?
    use cases
    • Benefits
    • Product & Service Marketing
    • Entity Resolution
    • Customer Journey/360
    • Recommendation Engine
    • Anti-Money Laundering (AML)
    • Cybersecurity Threat Detection
    • Fraud Detection
    • Risk Assessment & Monitoring
    • Energy Management
    • Network Resources Optimization
    • Supply Chain Analysis
    • AI & Machine Learning
    • Geospatial Analysis
    • Time Series Analysis
    industry
    • Advertising, Media & Entertainment
    • Financial Services
    • Healthcare & Life Sciences
    CUSTOMERS
    read all success stories


    PARTNERS
    Partner program
    • Partner Benefits
    • TigerGraph Partners
    • Sign Up
    RESOURCES
    LIBRARY
    • Resource Library
    • Benchmark
    • Webinars
    Events
    • Trade Shows
    • Graph + AI Summit
    • Graph for All - Million Dollar Challenge
    EDUCATION
    • TigerGraph Academy
    • Certification
    Blog
    • TigerGraph Blog
    DEVELOPERS
    • Developers Hub
    • Community Forum
    • Documentation
    • Ecosystem
    COMPANY
    COMPANY
    • Overview
    • Leadership
    • Careers  
    NEWS
    PRESS RELEASE
    AWARDS
    START FREE
    Start Free
    • Request a Demo
    • SUPPORT
    • COMMUNITY
    • CONTACT
    Dr. Jay Yu

    Dr. Jay Yu | VP of Product and Innovation

    Dr. Jay Yu is the VP of Product and Innovation at TigerGraph, responsible for driving product strategy and roadmap, as well as fostering innovation in graph database engine and graph solutions. He is a proven hands-on full-stack innovator, strategic thinker, leader, and evangelist for new technology and product, with 25+ years of industry experience ranging from highly scalable distributed database engine company (Teradata), B2B e-commerce services startup, to consumer-facing financial applications company (Intuit). He received his PhD from the University of Wisconsin - Madison, where he specialized in large scale parallel database systems

    Todd Blaschka | COO

    Todd Blaschka is a veteran in the enterprise software industry. He is passionate about creating entirely new segments in data, analytics and AI, with the distinction of establishing graph analytics as a Gartner Top 10 Data & Analytics trend two years in a row. By fervently focusing on critical industry and customer challenges, the companies under Todd's leadership have delivered significant quantifiable results to the largest brands in the world through channel and solution sales approach. Prior to TigerGraph, Todd led go to market and customer experience functions at Clustrix (acquired by MariaDB), Dataguise and IBM.