Skip to content
START FOR FREE
START FOR FREE
  • SUPPORT
  • COMMUNITY
Menu
  • SUPPORT
  • COMMUNITY
MENUMENU
  • Products
    • The World’s Fastest and Most Scalable Graph Platform

      LEARN MORE

      Watch a TigerGraph Demo

      TIGERGRAPH CLOUD

      • Overview
      • TigerGraph Cloud Suite
      • FAQ
      • Pricing

      USER TOOLS

      • GraphStudio
      • Insights
      • Application Workbenches
      • Connectors and Drivers
      • Starter Kits
      • openCypher Support

      TIGERGRAPH DB

      • Overview
      • GSQL Query Language
      • Compare Editions

      GRAPH DATA SCIENCE

      • Graph Data Science Library
      • Machine Learning Workbench
  • Solutions
    • The World’s Fastest and Most Scalable Graph Platform

      LEARN MORE

      Watch a TigerGraph Demo

      Solutions

      • Solutions Overview

      INCREASE REVENUE

      • Customer Journey/360
      • Product Marketing
      • Entity Resolution
      • Recommendation Engine

      MANAGE RISK

      • Fraud Detection
      • Anti-Money Laundering
      • Threat Detection
      • Risk Monitoring

      IMPROVE OPERATIONS

      • Supply Chain Analysis
      • Energy Management
      • Network Optimization

      By Industry

      • Advertising, Media & Entertainment
      • Financial Services
      • Healthcare & Life Sciences

      FOUNDATIONAL

      • AI & Machine Learning
      • Time Series Analysis
      • Geospatial Analysis
  • Customers
    • The World’s Fastest and Most Scalable Graph Platform

      LEARN MORE

      CUSTOMER SUCCESS STORIES

      • Ford
      • Intuit
      • JPMorgan Chase
      • READ MORE SUCCESS STORIES
      • Jaguar Land Rover
      • United Health Group
      • Xbox
  • Partners
    • The World’s Fastest and Most Scalable Graph Platform

      LEARN MORE

      PARTNER PROGRAM

      • Partner Benefits
      • TigerGraph Partners
      • Sign Up
      TigerGraph partners with organizations that offer complementary technology solutions and services.​
  • Resources
    • The World’s Fastest and Most Scalable Graph Platform

      LEARN MORE

      BLOG

      • TigerGraph Blog

      RESOURCES

      • Resource Library
      • Benchmarks
      • Demos
      • O'Reilly Graph + ML Book

      EVENTS & WEBINARS

      • Graph+AI Summit
      • Graph for All - Million Dollar Challenge
      • Events &Trade Shows
      • Webinars

      DEVELOPERS

      • Documentation
      • Ecosystem
      • Developers Hub
      • Community Forum

      SUPPORT

      • Contact Support
      • Production Guidelines

      EDUCATION

      • Training & Certifications
  • Company
    • Join the World’s Fastest and Most Scalable Graph Platform

      WE ARE HIRING

      COMPANY

      • Company Overview
      • Leadership
      • Legal Terms
      • Patents
      • Security and Compliance

      CAREERS

      • Join Us
      • Open Positions

      AWARDS

      • Awards and Recognition
      • Leader in Forrester Wave
      • Gartner Research

      PRESS RELEASE

      • Read All Press Releases
      TigerGraph Recognized in 2022 Gartner® Critical Capabilities for Cloud Database Management Systems for Analytical Use Cases
      January 12, 2023
      Read More »

      NEWS

      • Read All News

      A Shock to the System: ShockNet Predicts How Economic Shocks Could Affect the World Economy

      TigerGraph Recognized for the First Time in the 2022 Gartner® Magic Quadrant™ for Cloud Database Management Systems

  • START FREE
    • The World’s Fastest and Most Scalable Graph Platform

      GET STARTED

      • Request a Demo
      • CONTACT US
      • Try TigerGraph
      • START FREE
      • TRY AN ONLINE DEMO

‘+=’ As The Key That Unlocks The Power of the Network

  • Richard Henderson
  • September 23, 2019
  • blog, Developers, GSQL
  • Blog >
  • ‘+=’ As The Key That Unlocks The Power of the Network

My job as a TigerGraph SE is to help a prospective customer solve their problems using our product. We are unusually successful, even though we are not yet as well-known as some of our competitors. This is only explainable because we provide the 10X or 100X solution. This truly is a disruptive technology, finally delivering on the promise of graph databases.

My aim in this blog is to explain a little about how TigerGraph does this by exposing one small command, ‘+=’, that is arguably the key that changes the game. This one operation, in combination with ‘accumulators’, is what distills all the complexity and power of the platform, making it available to business and data professionals without requiring a PhD. The beauty of the design is that it is not dumbing anything down. It provides the maximum power for the minimum effort. 

Previously our VP of Engineering Mingxi explained what Accumulators were in TigerGraph, and how they are used. See here: https://www.tigergraph.com/2019/07/23/accumulator-101/ I greatly recommend that blog. Accumulators are the data side of this story, and ‘+=’ is the mechanism that brings the idea to life. As Mingxi explains, accumulators may be local or global, and they accumulate values using the ‘+=’ operator according to the semantics of each accumulator.

It is also worth understanding a little about what distinguishes a graph database, from a more conventional table-structured database (be it relational or NoSQL). For that I recommend a blog by Gaurav Deshpande our VP of Marketing: https://www.tigergraph.com/2019/06/11/what-is-a-graph-database-and-why-should-you-care/

What I’d like to elaborate here is how this takes the graph from being a database, to a uniquely powerful data engine. I’ll also say a little about what sort of impressive mechanics are happening behind the scenes to achieve this, and why this small command is such a significant addition to the data professional. It takes the idea of the graph beyond simply storing and retrieving networked data, to providing graph-native computation. Furthermore, the TigerGraph implementation very directly exploits the structure of the graph to make scalable massively parallel computation available without any special knowledge or expertise.

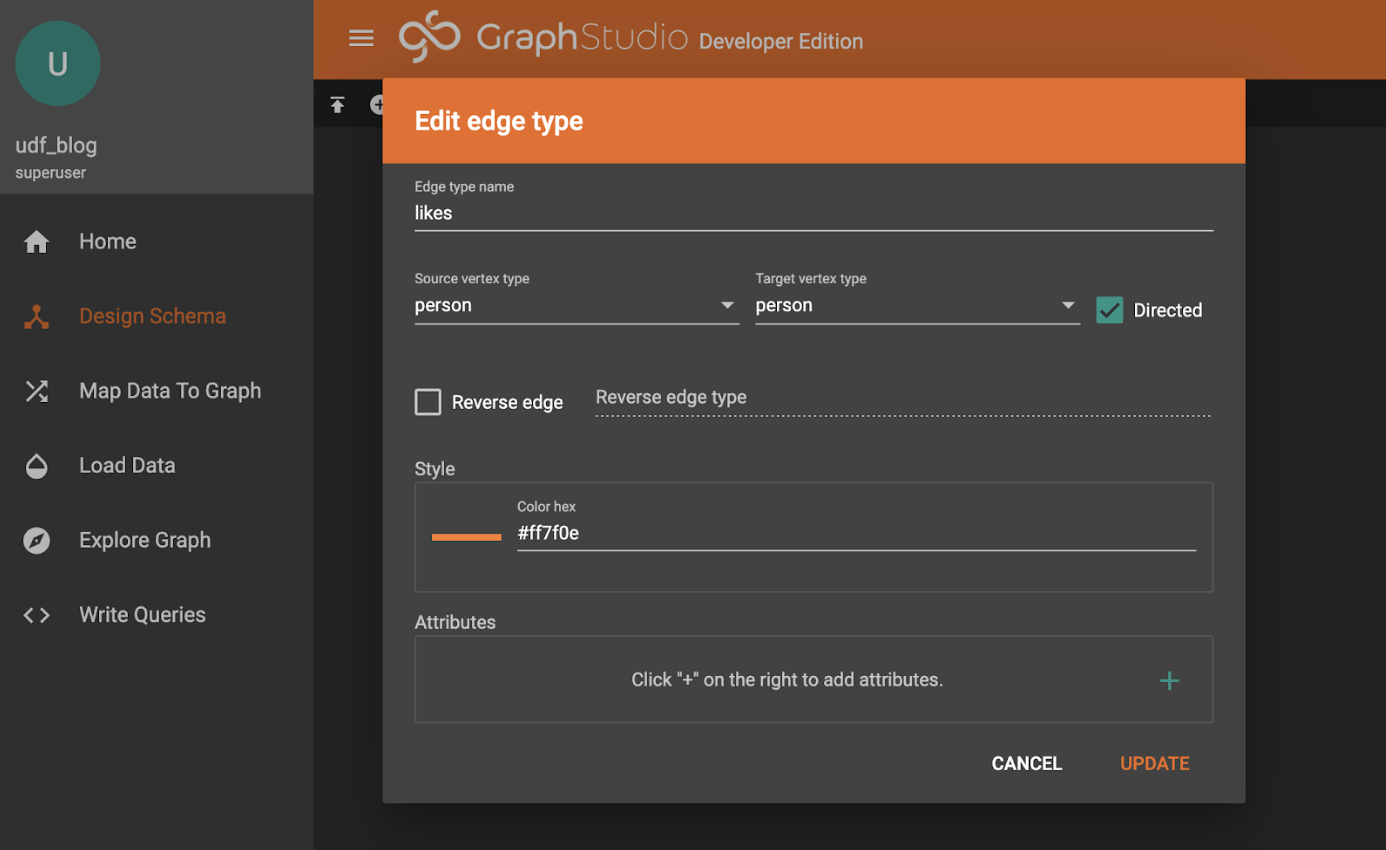
To illustrate this I’m starting with a really simple schema using the Design Schema tab of TigerGraph Graph Studio:

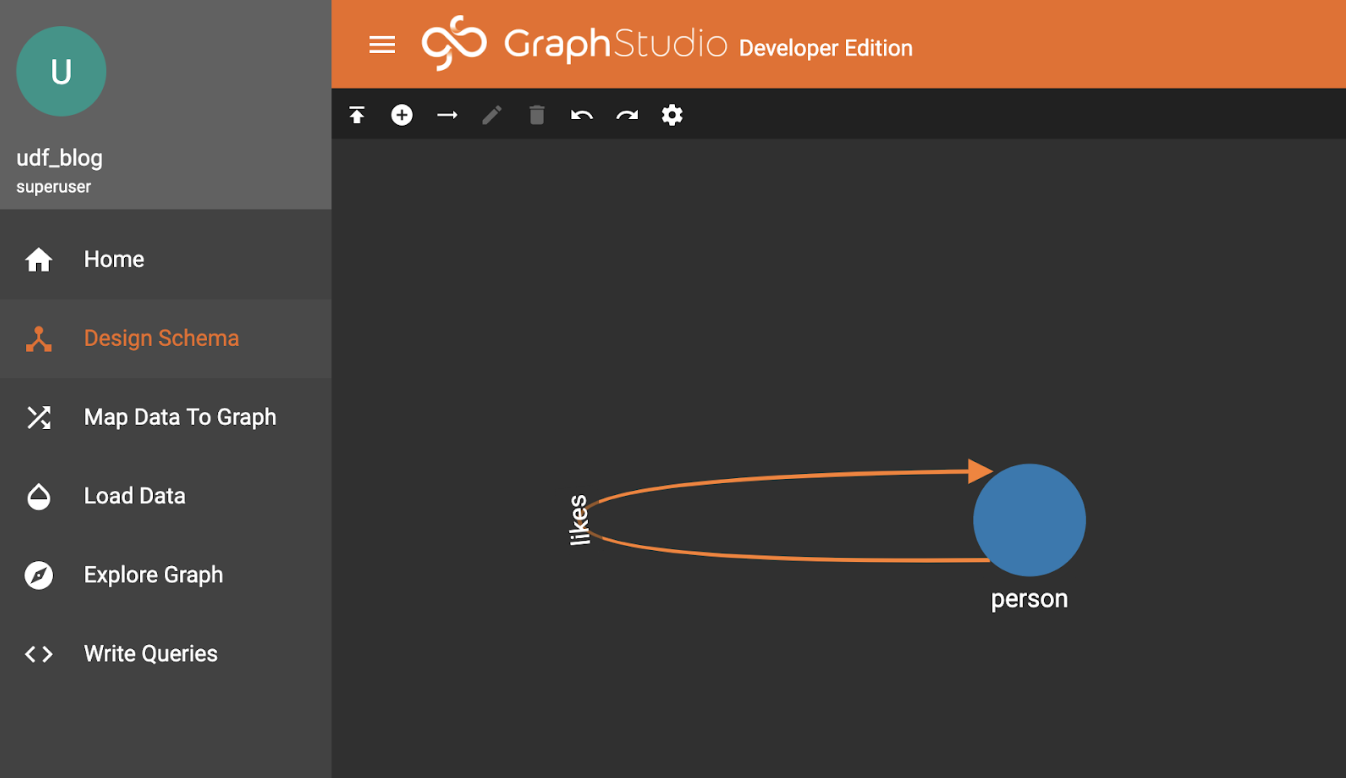
“likes” is a simple edge, directed in this case.

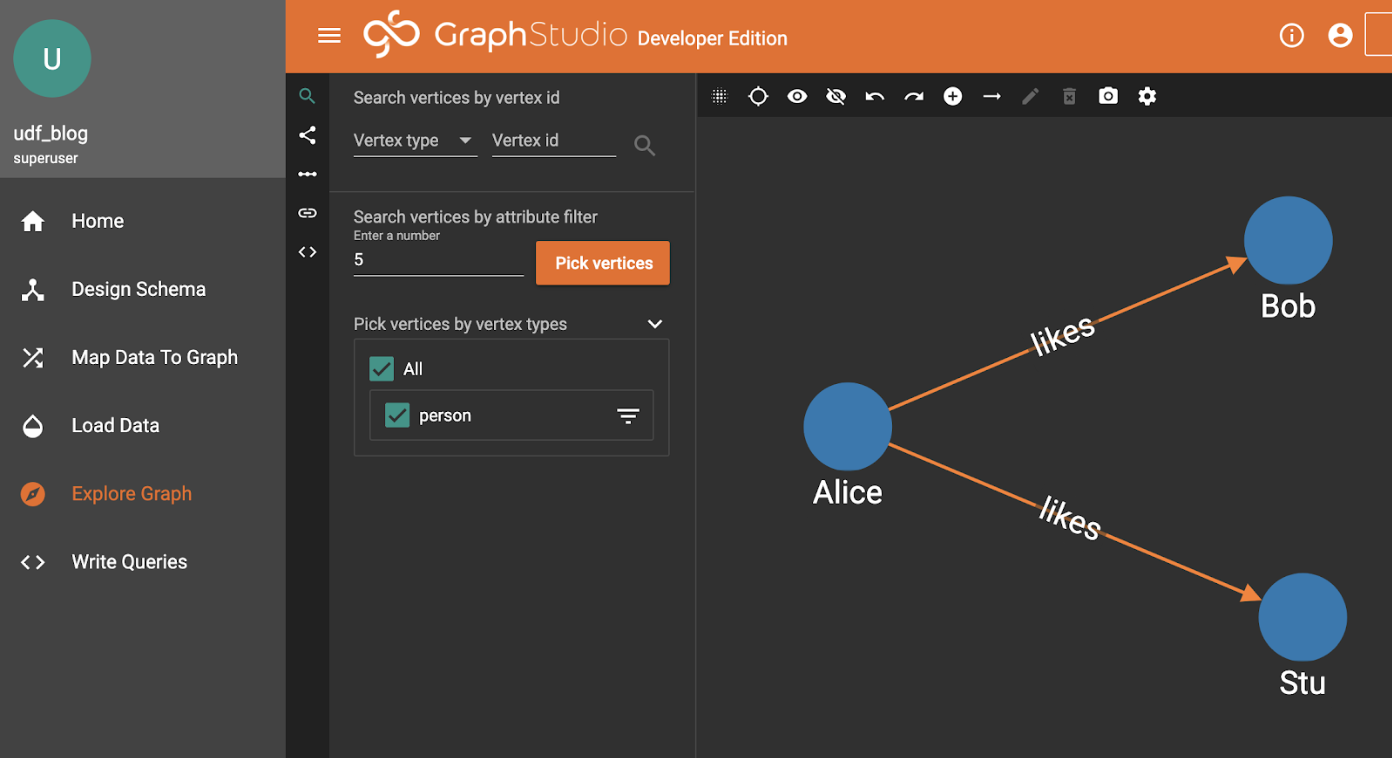
I’ve added three Person records for the sake of demonstration, Alice and Bob and Stu. I did this using the “+” icon above the graph display.

It turns out that Alice likes Bob and Stu so there are “likes” edge between them.

Here is where it gets a little more interesting.

What we want to do is move some information (a number of “buttons”) from Alice to her friends. 

In TigerGraph GSQL this is easily and directly expressed.

Here’s what the query looks like. I’m going to go into some detail here, so feel free to skip ahead if you are familiar with GSQL query calling conventions.

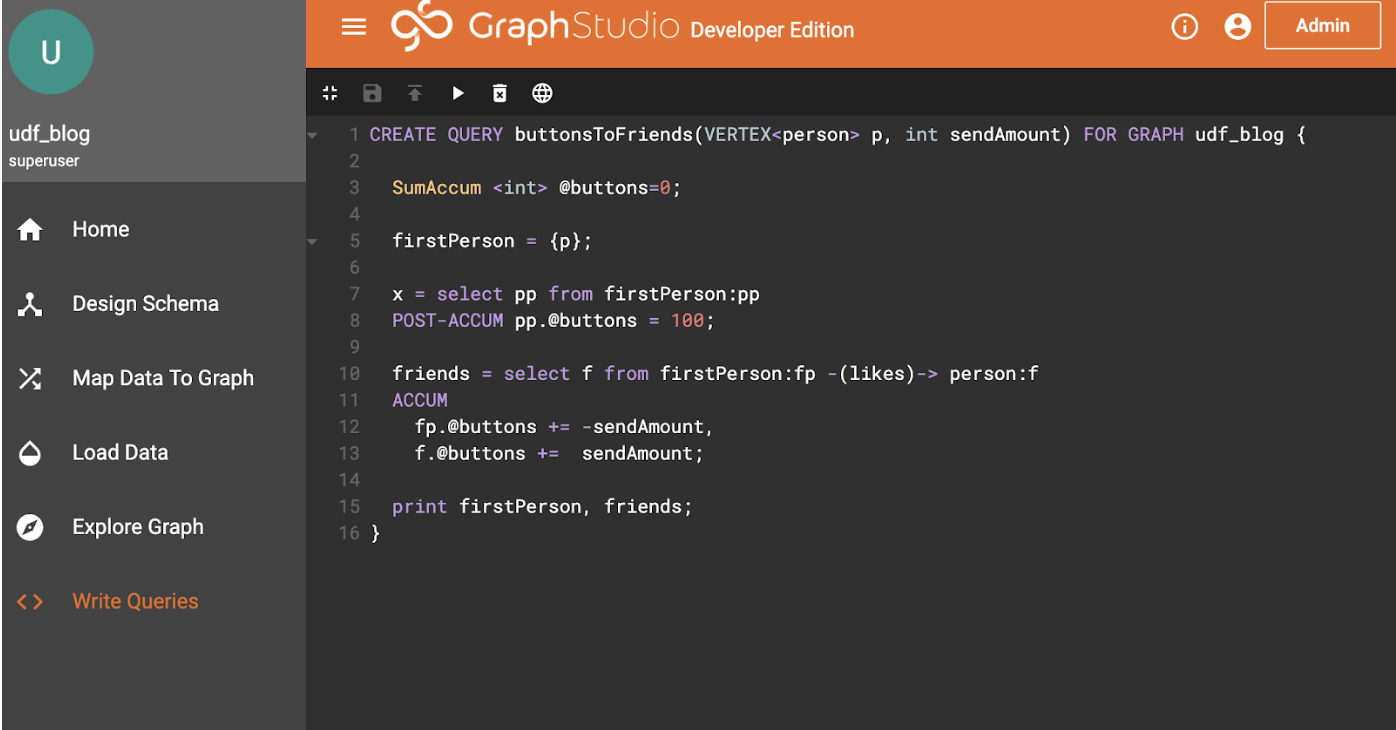
Line 1: Our query takes a parameter of a starting person, and an amount to send.

Physically, the argument “p” is passed as the primary key (usually a string). This is automatically looked up at calling time, so “p” becomes a reference to the vertex.

Line 3: Declares an accumulator that sums its entries.

Accumulators come in various varieties, which describe what happens when a value is “accumulated” (using the += operator). Check out the documentation to see what alternatives are available including averaging accumulators and so on. The key observation is that accumulators will have the same value at the end of a series of accumulations, no matter what order they happen. This is an important quality that allows very high performance parallel computation.

Line 5: Converts the person parameter into a starting “vertex seed set” called firstPerson. This is our starting point, and can be seen in the following query, acting like a table in the FROM clause of SQL. 

Line 7-8: selects (and implicitly “activates”) all person vertices in the firstPerson set, attaching an @buttons accumulator to the activated vertices, and sets the accumulator value to 100. Note that the returned set of vertices isn’t needed later, but syntactically needs to be assigned, here to a variable ‘x’.

Activation is the loading of the vertex into a memory structure, if it hasn’t already been loaded in a previous SELECT block within this query. Automatically these vertices can have any declared accumulators attached to them. Thus our graph goes from being static on-disk data, to an active dynamic participant in a calculation.

POST-ACCUM is the command which acts upon the resulting vertex set, here acting upon the “pp” result set to attach the accumulator @buttons to each of the vertices in the “pp” result-set, accumulating its value to 100.

Lines 10-13: The magic happens here. The ACCUM clause says what we want to happen on each traversed edge, defined by the pattern in the “from” part of the expression.

It basically says “for each edge traversed do the following functions. We can see our operator “+=”, and for the ACCUM clause we can operate on vertices at either end of the edge as well as the edge itself.

This ability is the primary way of sending information along edges.

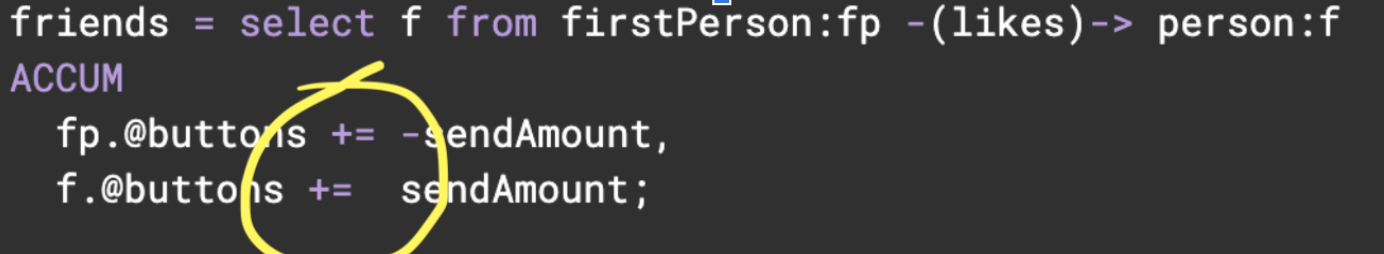
So, here, we have removed “sendAmount” from the “fp” vertex, and added that value to the “f” vertex, for each edge. 

If we have multiple edges to a vertex, all the values will be summed. This is how we express a “flow”, moving values from upstream (“fp”) vertices to downstream “f”) vertices.

Line 15: Just print the results.

If we run it and look at the JSON output, it works as expected. We first set up the parameters:

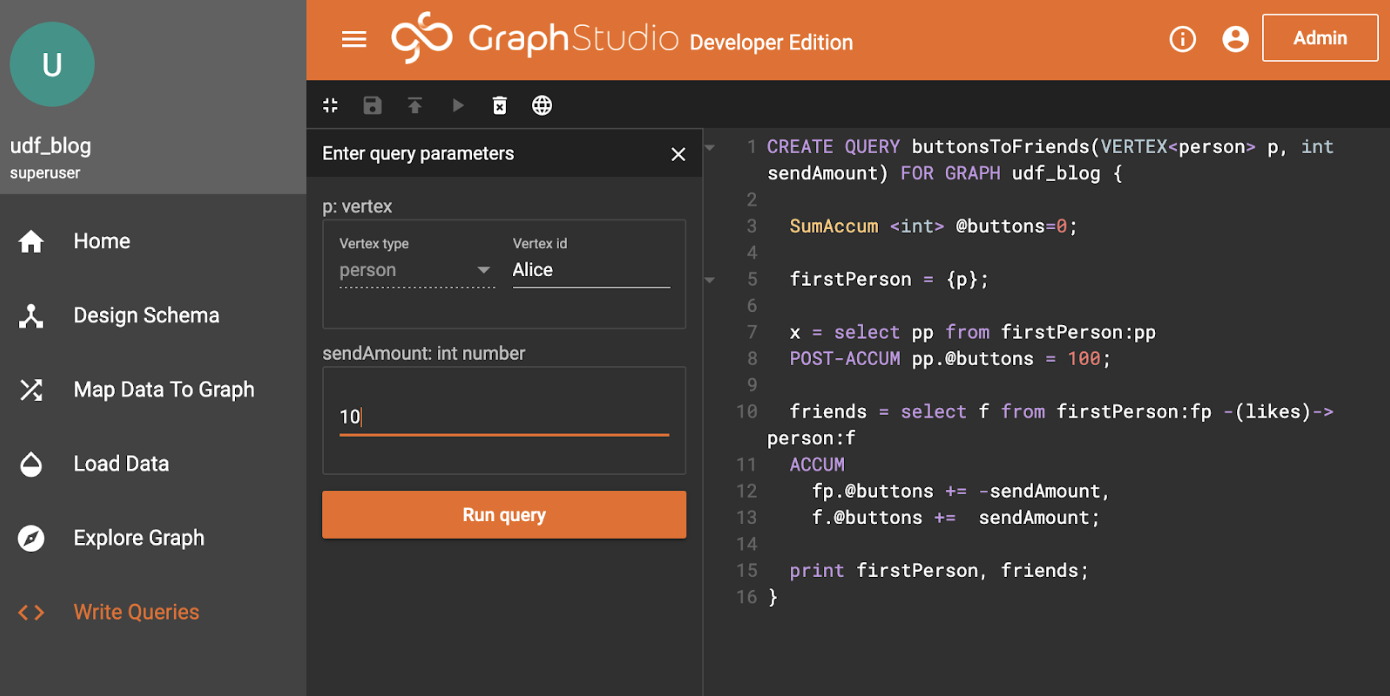
Hit the Run Query button, and select the JSON output from the output selection menu <…>:

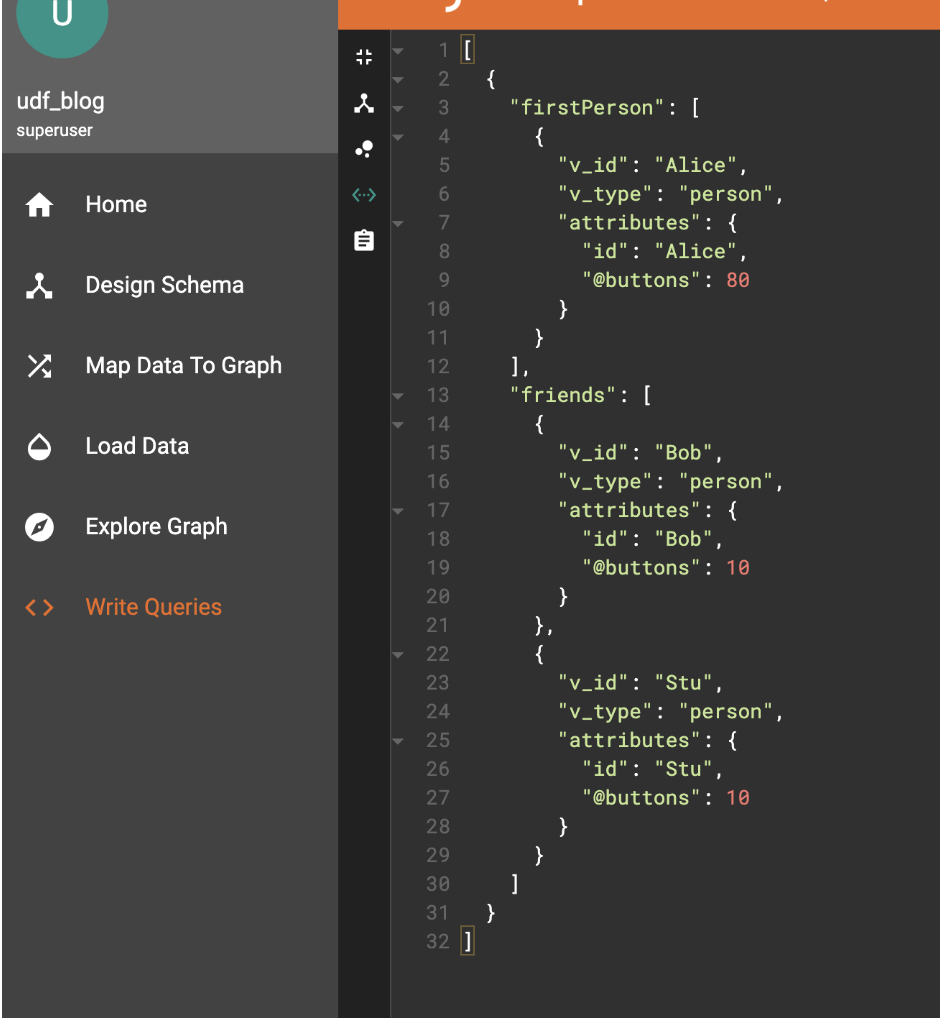
As we can see, there are two edges from Alice, so it has 10 taken twice leaving 80 (recall Alice was initialized with 100). Each of the destinations gets one of those added (10 each, they were never initialized, and the default value is 0 in the declaration).

Which all seems pretty easy, but I think there are two things to consider given what we said about order-independent operations, and the ACCUM statement semantics. 

Firstly, this can run at pretty much any scale. We have data-sets running into the billions of vertices, and this routine can still run in real-time. Furthermore, we are a distributed database, so in a cluster, Alice’s vertex is very likely to be on a different node than Bob or Stuart, yet the calculation happens as if they are local to each other. 

Additionally, each of the edges is followed in parallel, which is why we describe our system as MPP. It isn’t just running each query in parallel, within a single query, each edge is traversed and ACCUM’ulated in parallel with its own logical thread. That is why it is fast and scalable.

Physically, the system is implemented as closely as possible to this idea. Just as we are talking about flowing information along edges, internally each machine’s GPE (graph processing engine) is physically sending messages between each node and accumulating. This is either by retrieving the node’s data, and accumulating on the GPE that started the query, or in fully distributed mode sending the message to another machine’s GPE, so it can act upon the vertices local to it.

Such an architecture, where the logical operation is very directly expressed in the physical operation, is considered to have “mechanical sympathy”. The benefits are two-fold: one is that it can be very efficient because it doesn’t waste operations translating representations back and forth; the other is that we can reason about what the engine is doing to express what we have coded. That second quality is highly desirable to architects and developers, and generally results in predictable high performance. Linearly scalable algorithms in theory will often run with linear scale in practice without needing tortuous tuning and optimization.

Let’s move back up to the logical abstraction of what we are functionally achieving. As we can see in our simple example, the “@buttons” accumulator is attached to each vertex, thus the phrase “computing on the graph”. We have, with very little effort or complicated coding, performed a useful trick. We have described a way of “flowing” data (in this case buttons) between nodes along specific directed edges.

It turns out this trick actually gives us tremendous power. The solution to a large class of graph analytic problems can be expressed very easily in terms of data flows like this. Google depends on this to perform PageRank algorithms, where the information flowing along edges is the popularity of a page measured by how many links it has. Arguably their entire business is encapsulated by this type of operation. Community labelling flows community labels among all the connected vertices until each island-like community agrees on its common identity, which is basically what Facebook, Twitter and LinkedIn rely on.

In a use case I elaborated elsewhere (hyper-personalized recommendation engines: https://info.tigergraph.com/graph-gurus-16) we show how analytic operations like cosine affinity among enormous networks of vertices can be simply expressed and computed in real-time directly on the graph. No need to load the data into a separate processing system. No need to translate the data into an alternate matrix or tabular representation. No need to use black-box special operations in order to exploit parallelism. 

All that complexity is avoided by using our powerful graph architecture. Some of our major customers such as Wish.com, the largest online retail platform in the world by volume, rely on exactly this capability to make customers happy by suggesting exactly the right product at the right time, in real time, at a massive scale. A multinational financial services company uses it to detect and predict weaknesses in their IT network, so they can avoid outages. Alibaba uses it to detect fraudsters before the fraud has happened.

To summarize, the simple powerful idea of an accumulation operator combined with a native-graph data-engine lies at the heart of some of our most successful applications. An idea that you too can use with or without that PhD.

All this power and value coming from just two characters “+=”, and some rather clever technology.

TigerGraph, the only truly scalable, and I would argue, only elegant, graph analytic database.

To see more, please visit our website. For some more detail on what GSQL can do, please see our e-book: https://info.tigergraph.com/ebook

You Might Also Like

TigerGraph Showcases Unrivaled Performance at Scale

TigerGraph Showcases Unrivaled Performance at Scale

January 12, 2023
How to Create a Visual Graph Analytics Application Using TigerGraph Insights in 30 mins

How to Create a Visual Graph...

November 14, 2022
Turbocharge your business intelligence with TigerGraph’s ML Workbench on TigerGraph Cloud

Turbocharge your business intelligence with TigerGraph’s...

November 14, 2022

Introducing TigerGraph 3.0

July 1, 2020

Everything to Know to Pass your TigerGraph Certification Test

June 24, 2020

Neo4j 4.0 Fabric – A Look Behind the Curtain

February 7, 2020

TigerGraph Blog

  • Categories
    • blogs
      • About TigerGraph
      • Benchmark
      • Business
      • Community
      • Compliance
      • Customer
      • Customer 360
      • Cybersecurity
      • Developers
      • Digital Twin
      • eCommerce
      • Emerging Use Cases
      • Entity Resolution
      • Finance
      • Fraud / Anti-Money Laundering
      • GQL
      • Graph Database Market
      • Graph Databases
      • GSQL
      • Healthcare
      • Machine Learning / AI
      • Podcast
      • Supply Chain
      • TigerGraph
      • TigerGraph Cloud
    • Graph AI On Demand
      • Analysts and Research
      • Customer 360 and Entity Resolution
      • Customer Spotlight
      • Development
      • Finance, Banking, Insurance
      • Keynote
      • Session
    • Video
  • Recent Posts

    • It’s Time to Harness the Power of Graph Technology [Infographic]
    • TigerGraph Showcases Unrivaled Performance at Scale
    • TigerGraph 101 An Introduction to Graph | Jan 26th @ 9am PST
    • Data Science Salon New York
    • Tech For Retail
    TigerGraph

    Product

    SOLUTIONS

    customers

    RESOURCES

    start for free

    TIGERGRAPH DB
    • Overview
    • Features
    • GSQL Query Language
    GRAPH DATA SCIENCE
    • Graph Data Science Library
    • Machine Learning Workbench
    TIGERGRAPH CLOUD
    • Overview
    • Cloud Starter Kits
    • Login
    • FAQ
    • Pricing
    • Cloud Marketplaces
    USEr TOOLS
    • GraphStudio
    • TigerGraph Insights
    • Application Workbenches
    • Connectors and Drivers
    • Starter Kits
    • openCypher Support
    SOLUTIONS
    • Why Graph?
    industry
    • Advertising, Media & Entertainment
    • Financial Services
    • Healthcare & Life Sciences
    use cases
    • Benefits
    • Product & Service Marketing
    • Entity Resolution
    • Customer 360/MDM
    • Recommendation Engine
    • Anti-Money Laundering
    • Cybersecurity Threat Detection
    • Fraud Detection
    • Risk Assessment & Monitoring
    • Energy Management
    • Network & IT Management
    • Supply Chain Analysis
    • AI & Machine Learning
    • Geospatial Analysis
    • Time Series Analysis
    success stories
    • Customer Success Stories

    Partners

    Partner program
    • Partner Benefits
    • TigerGraph Partners
    • Sign Up
    LIBRARY
    • Resources
    • Benchmark
    • Webinars
    Events
    • Trade Shows
    • Graph + AI Summit
    • Million Dollar Challenge
    EDUCATION
    • Training & Certifications
    Blog
    • TigerGraph Blog
    DEVELOPERS
    • Developers Hub
    • Community Forum
    • Documentation
    • Ecosystem

    COMPANY

    Company
    • Overview
    • Careers
    • News
    • Press Release
    • Awards
    • Legal
    • Patents
    • Security and Compliance
    • Contact
    Get Started
    • Start Free
    • Compare Editions
    • Online Demo - Test Drive
    • Request a Demo

    Product

    • Overview
    • TigerGraph 3.0
    • TIGERGRAPH DB
    • TIGERGRAPH CLOUD
    • GRAPHSTUDIO
    • TRY NOW

    customers

    • success stories

    RESOURCES

    • LIBRARY
    • Events
    • EDUCATION
    • BLOG
    • DEVELOPERS

    SOLUTIONS

    • SOLUTIONS
    • use cases
    • industry

    Partners

    • partner program

    company

    • Overview
    • news
    • Press Release
    • Awards

    start for free

    • Request Demo
    • take a test drive
    • SUPPORT
    • COMMUNITY
    • CONTACT
    • Copyright © 2023 TigerGraph
    • Privacy Policy
    • Linkedin
    • Facebook
    • Twitter

    Copyright © 2020 TigerGraph | Privacy Policy

    Copyright © 2020 TigerGraph Privacy Policy

    • SUPPORT
    • COMMUNITY
    • COMPANY
    • CONTACT
    • Linkedin
    • Facebook
    • Twitter

    Copyright © 2020 TigerGraph

    Privacy Policy

    • Products
    • Solutions
    • Customers
    • Partners
    • Resources
    • Company
    • START FREE
    START FOR FREE
    START FOR FREE
    TigerGraph
    PRODUCT
    PRODUCT
    • Overview
    • GraphStudio UI
    • Graph Data Science Library
    TIGERGRAPH DB
    • Overview
    • Features
    • GSQL Query Language
    TIGERGRAPH CLOUD
    • Overview
    • Cloud Starter Kits
    TRY TIGERGRAPH
    • Get Started for Free
    • Compare Editions
    SOLUTIONS
    SOLUTIONS
    • Why Graph?
    use cases
    • Benefits
    • Product & Service Marketing
    • Entity Resolution
    • Customer Journey/360
    • Recommendation Engine
    • Anti-Money Laundering (AML)
    • Cybersecurity Threat Detection
    • Fraud Detection
    • Risk Assessment & Monitoring
    • Energy Management
    • Network Resources Optimization
    • Supply Chain Analysis
    • AI & Machine Learning
    • Geospatial Analysis
    • Time Series Analysis
    industry
    • Advertising, Media & Entertainment
    • Financial Services
    • Healthcare & Life Sciences
    CUSTOMERS
    read all success stories


    PARTNERS
    Partner program
    • Partner Benefits
    • TigerGraph Partners
    • Sign Up
    RESOURCES
    LIBRARY
    • Resource Library
    • Benchmark
    • Webinars
    Events
    • Trade Shows
    • Graph + AI Summit
    • Graph for All - Million Dollar Challenge
    EDUCATION
    • TigerGraph Academy
    • Certification
    Blog
    • TigerGraph Blog
    DEVELOPERS
    • Developers Hub
    • Community Forum
    • Documentation
    • Ecosystem
    COMPANY
    COMPANY
    • Overview
    • Leadership
    • Careers  
    NEWS
    PRESS RELEASE
    AWARDS
    START FREE
    Start Free
    • Request a Demo
    • SUPPORT
    • COMMUNITY
    • CONTACT
    Dr. Jay Yu

    Dr. Jay Yu | VP of Product and Innovation

    Dr. Jay Yu is the VP of Product and Innovation at TigerGraph, responsible for driving product strategy and roadmap, as well as fostering innovation in graph database engine and graph solutions. He is a proven hands-on full-stack innovator, strategic thinker, leader, and evangelist for new technology and product, with 25+ years of industry experience ranging from highly scalable distributed database engine company (Teradata), B2B e-commerce services startup, to consumer-facing financial applications company (Intuit). He received his PhD from the University of Wisconsin - Madison, where he specialized in large scale parallel database systems

    Todd Blaschka | COO

    Todd Blaschka is a veteran in the enterprise software industry. He is passionate about creating entirely new segments in data, analytics and AI, with the distinction of establishing graph analytics as a Gartner Top 10 Data & Analytics trend two years in a row. By fervently focusing on critical industry and customer challenges, the companies under Todd's leadership have delivered significant quantifiable results to the largest brands in the world through channel and solution sales approach. Prior to TigerGraph, Todd led go to market and customer experience functions at Clustrix (acquired by MariaDB), Dataguise and IBM.