Skip to content
START FOR FREE
START FOR FREE
  • SUPPORT
  • COMMUNITY
  • CONTACT
Menu
  • SUPPORT
  • COMMUNITY
  • CONTACT
MENUMENU
  • Products
    • The World’s Fastest and Most Scalable Graph Platform

      LEARN MORE

      Watch a TigerGraph Demo

      PRODUCTS

      • Why Graph?
      • Products Overview
      • What's New
      • GraphStudio User Interface
      • Visualization Toolkits
      • GSQL Query Language
      • Connectors

      TigerGRAPH ENTERPRISE

      • Enterprise Overview
      • Features

      TIGERGRAPH CLOUD

      • Cloud Overview
      • Cloud Starter Kits
      • Login/Sign Up
      • FAQ
      • Pricing
      • Marketplaces

      Graph Data Science

      • Graph Data Science Library
      • Machine Learning Workbench

      TRY TIGERGRAPH

      • Get Started for Free
      • Compare Editions
      • Test Drive - Online Demo
      • Watch Demos
      • Request a Demo
  • Solutions
    • The World’s Fastest and Most Scalable Graph Platform

      LEARN MORE

      Watch a TigerGraph Demo

      Solutions

      • Solutions Overview

      INCREASE REVENUE

      • Customer Journey/360
      • Product Marketing
      • Entity Resolution
      • Recommendation Engine

      MANAGE RISK

      • Fraud Detection
      • Anti-Money Laundering
      • Threat Detection
      • Risk Monitoring

      IMPROVE OPERATIONS

      • Supply Chain Analysis
      • Energy Management
      • Network Optimization

      By Industry

      • Advertising, Media & Entertainment
      • Financial Services
      • Healthcare & Life Sciences

      FOUNDATIONAL

      • AI & Machine Learning
      • Time Series Analysis
      • Geospatial Analysis
  • Customers
    • The World’s Fastest and Most Scalable Graph Platform

      LEARN MORE

      CUSTOMER SUCCESS STORIES

      • Citrix
      • Ford
      • Intuit
      • JPMorgan Chase
      • READ MORE SUCCESS STORIES
      • Jaguar Land Rover
      • United Health Group
      • Xbox
  • Partners
    • The World’s Fastest and Most Scalable Graph Platform

      LEARN MORE

      PARTNER PROGRAM

      • Partner Benefits
      • TigerGraph Partners
      • Sign Up
      TigerGraph partners with organizations that offer complementary technology solutions and services.​
  • Resources
    • The World’s Fastest and Most Scalable Graph Platform

      LEARN MORE

      BLOG

      • TigerGraph Blog

      RESOURCES

      • Resource Library
      • Benchmarks
      • Demos
      • O'Reilly Graph + ML Book

      EVENTS & WEBINARS

      • Graph+AI Summit
      • Graph for All - Million Dollar Challenge
      • Events &Trade Shows
      • Webinars

      DEVELOPERS

      • Documentation
      • Ecosystem
      • Developers Hub
      • Community Forum

      SUPPORT

      • Contact Support
      • Production Guidelines

      EDUCATION

      • Training & Certifications
  • Company
    • Join the World’s Fastest and Most Scalable Graph Platform

      WE ARE HIRING

      COMPANY

      • Company Overview
      • Leadership
      • Legal Terms
      • Patents
      • Security and Compliance

      CAREERS

      • Join Us
      • Open Positions

      AWARDS

      • Awards and Recognition
      • Leader in Forrester Wave
      • Gartner Research

      PRESS RELEASE

      • Read All Press Releases
      NCS partners with TigerGraph to collaborate on joint solutions in graph analytics
      August 12, 2022
      Read More »

      NEWS

      • Read All News

      Four Lessons For New And Would-Be Founders I Learned When I Made A Career Pivot

      Hashmap on Tap

      #133 Connecting the Dots Faster Than Ever with Dr. Victor Lee at TigerGraph

  • START FOR FREE
    • The World’s Fastest and Most Scalable Graph Platform

      GET STARTED

      • Request a Demo
      • CONTACT US
      • Try TigerGraph
      • GET STARTED FOR FREE
      • TRY AN ONLINE DEMO

Building YouTube/TikTok Recommendations in TigerGraph

  • TigerGraph
  • August 20, 2021
  • blog, Community, Recommendation Engine
  • Blog >
  • Building YouTube/TikTok Recommendations in TigerGraph

This article will demonstrate how you can build your own analytical video recommendation system using GraphStudio through TGCloud.

I have provided the source files below, so you can follow along with my project from start to finish using only your web browser.

Create a Default Solution

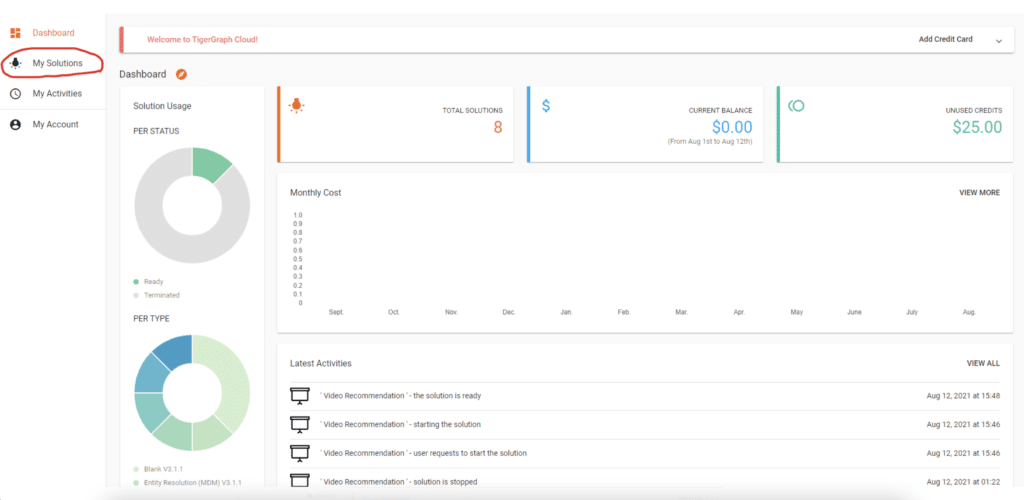
First, visit tgcloud.io and register for a free account. Then, log in and click on the “My Solutions” tab

Then, click on “Create Solution” in the upper-right corner


Create a blank solution, and make sure the TigerGraph version is 3.1.1 (compatibility for later versions is not guaranteed)

For instance settings, keep everything at the free defaults

For solution settings, the only required field is setting a password

Once you have confirmed your solution settings, you will be brought back to the dashboard. Wait until your solution status is “Ready” and then open it through GraphStudi

Downloading Project Files

Now that your instance is ready, you can download a copy of my solution and two basic CSV datasets. [Download them here]

Import Solution

From the GraphStudio landing page, click on “Import an Existing Solution” and select the downloaded file solution.tar.gz


Select “Overwrite” when presented with an import warning

At the top-left corner, select the “TikTok” graph

Understanding the Graph Schema

We will now step through each of the tabs in the left-hand menu before we can start analyzing the data. First, we click on “Design Schema”:

  • A user is identified by their username, and they also have attributes communityID (INT) and country (STRING)
  • A video is identified by its videoID, and it also has attribute country (STRING)
  • A tag and audio are both identified by their content

Here are the vertices and interactions (edges) that we will observe…

A user can follow another user

CREATE DIRECTED EDGE following (FROM user, TO user)

A user can watch a video

CREATE UNDIRECTED EDGE watched (
FROM user, 
TO video, 
percentWatched INT, 
commented BOOL, 
liked BOOL)

A video can contain identifiable audio (exists as an integer ID)

CREATE UNDIRECTED EDGE VIDEO_HAS_AUDIO (FROM video, TO audio)

A video can point to a tag that describes its content (i.e. finance, pets, sports)

CREATE UNDIRECTED EDGE VIDEO_HAS_TAG (FROM video, TO tag)

Loading Data + Setup

Now we will load the two downloaded CSVs. First click on “Map Data to Graph”. The files are already mapped but they still need to be uploaded.

Click “Add data file”

Upload the CSVs to the server and then click “Cancel” (they will still be added)

Then, proceed to the “Load Data” tab and press the start button


(You may have to wait a bit for this button to light up and be pressable)

Finally, proceed to the “Write Queries” tab and click on “Install All Queries”


Running Both Analytics Queries

The first query, algoLouvain, is responsible for community detection within the data. Every community is assigned a unique communityID, and this query fills every user’s communityID attribute based on the network of people that they follow. This will be used later to promote recommendations of videos that other users in your community have interacted with.

(algoLouvain is adapted from our Community Graph Algorithm Library)

The output of this query prints a map of all the community sizes and the corresponding IDs within each size group. You can run it by clicking on the play button icon in the header.


The query parameter only affects printed output, the backend ID assignment always works the same.

The main query is recommendVideo. It accepts 2 parameters: targetUsername (identifies which user to recommend videos to) and minWatchPercent (identifies the minimum watch percentage to count as a view).

targetUsername should be either leo, ben, matt, don, or joe

The output will be a sorted collection of all the videos in the database, ordered by a per-video interest score that represents how applicable a video is to the target user’s current interests and community.

Output of calling the function with leo and 50% minimum watch time:

 {
 “attributes”: {
 “@matchingTagsAndAudios”: 2,
 “@score”: 5.5,
 “country”: “Canada”
 },
 “v_id”: “6”,
 “v_type”: “video”
 }, {
 “attributes”: {
 “@matchingTagsAndAudios”: 1,
 “@score”: 3.5,
 “country”: “USA”
 },
 “v_id”: “5”,
 “v_type”: “video”
 }, ... (lists all videos)

Note: if a video’s score is -1, it means the target user already watched it

Understanding the Main Query

Now that the functionality has been demonstrated, we will dive into a few ways in which these video interest scores are calculated through graphical relationships in our data.

First, we establish a singleton vertex set only containing the target user:

allUsers = {user.*};targetUser = SELECT s 
             FROM allUsers:s
             WHERE s.username == targetUsername
             ACCUM targetUserCountry = s.country,
                   targetUserCommunity = s.communityID;

Then, we develop something of a profile for this target user, where we store information about the tags and audios from their watched videos

SetAccum<STRING> @@targetUserTags;
SetAccum<INT> @@targetUserAudios;watchedVideos = SELECT t
                FROM targetUser:s - (watched:e) - video:t
                WHERE watched.percentWatched >= minWatchPercent;fillTags = SELECT t
           FROM watchedVideos:s - (VIDEO_HAS_TAG:e) - tag:t
           ACCUM @@targetUserTags += t.content;
    
fillAudio = SELECT t
            FROM watchedVideos:s - (VIDEO_HAS_AUDIO:e) - audio:t
            ACCUM @@targetUserAudios += t.content;

With this interest profile, we can start identifying other videos (containing the target tags and audios) that the user would probably also enjoy

// Per-vertex variables
SumAccum<FLOAT> @matchingTagsAndAudios;
SumAccum<FLOAT> @score;// Every matching tag/audio in a video adds 2 points
allVids = {video.*};giveScores = SELECT s
             FROM allVids:s - (VIDEO_HAS_TAG:e) - tag:t
             ACCUM IF @@targetUserTags.contains(t.content) THEN                  
                      [email protected] += 2,                                               
                      [email protected] += 1
                   END;
                 
giveScores = SELECT s
             FROM allVids:s - (VIDEO_HAS_AUDIO:e) - audio:t
             ACCUM IF @@targetUserAudios.contains(t.content) THEN 
                      [email protected] += 2,                                                           
                      [email protected] += 1                                              
                   END;// Bonus point if 2 or more tags/audios match the user's preference
giveBonusForSimilar = SELECT s
                      FROM allVids:s
                      WHERE [email protected] > 1
                      ACCUM [email protected] += 1;

The communityID generation by the previous query also comes into play.

Videos that have been liked/commented on by members of the target community receive bonus points

// Bump videos liked/commented on within a user's community
allUsers = {user.*};
communityUsers = SELECT s
                 FROM allUsers:s
                 WHERE s.communityID == targetUserCommunity;
    
communityLiked = SELECT t
                 FROM communityUsers:s - (watched:e) - video:t
                 WHERE watched.liked
                 ACCUM [email protected] += 0.5;
    
communityCommented = SELECT t
                     FROM communityUsers:s - (watched:e) - video:t
                     WHERE watched.commented
                     ACCUM [email protected] += 0.5;

Finally, we bump the scores of videos liked by users who liked a video in common with the target user. See the related diagram below:

likedVideos = SELECT t
              FROM targetUser:s - (watched:e) - video:t
              WHERE watched.liked;
    
relatedUsers = SELECT t
               FROM likedVideos:s - (watched:e) - user:t
               WHERE watched.liked;
    
relatedVideos = SELECT t
                FROM relatedUsers:s - (watched:e) - video:t
                WHERE watched.liked
                ACCUM [email protected] += 0.25;
 

Each arrow represents a hop

These are just a few of the relationships that can be analyzed to improve the catering of video content to individual users and their interests.

My exact point system is quite arbitrary and simplistic. It should be refined for real-world applications by observing its behavior and tendencies with larger sets of data.

If you have any questions, feel free to ask others in the community forum or also on Discord.

You Might Also Like

Developer Spotlight: David Baker Effendi

Developer Spotlight: David Baker Effendi

August 11, 2022
AI and Graph in the Retail Industry

AI and Graph in the Retail...

August 9, 2022
Get to Know the Latest TigerGraph Cloud Release

Get to Know the Latest TigerGraph...

August 2, 2022

Introducing TigerGraph 3.0

July 1, 2020

Everything to Know to Pass your TigerGraph Certification Test

June 24, 2020

Neo4j 4.0 Fabric – A Look Behind the Curtain

February 7, 2020

TigerGraph Blog

  • Categories
    • ASIA PACIFIC EVENTS
    • blogs
      • About TigerGraph
      • Benchmark
      • Business
      • Community
      • Compliance
      • Customer
      • Customer 360
      • Cybersecurity
      • Developers
      • Digital Twin
      • eCommerce
      • Emerging Use Cases
      • Entity Resolution
      • Finance
      • Fraud / Anti-Money Laundering
      • GQL
      • Graph Database Market
      • Graph Databases
      • GSQL
      • Healthcare
      • Machine Learning / AI
      • Podcast
      • Supply Chain
      • TigerGraph
      • TigerGraph Cloud
    • Graph AI On Demand
      • Keynote
      • Session
    • Video
  • Recent Posts

    • Evanta CDO Executive Summit – Chicago
    • FIMA Europe 2022
    • Data. AI. Precision. Innovation. For Pharma, Healthcare & Partners
    • Gartner IT Symposium/Xpo
    • Fachkonferenz Versicherungsbetrug 2022
    TigerGraph

    Product

    SOLUTIONS

    customers

    RESOURCES

    start for free

    PRODUCT
    • Overview
    • What's New
    • Toolkits
    • Connectors
    • Data Science Library
    TIGERGRAPH DB
    • Overview
    • No-Code Graph Analytics
    • Features
    • GSQL Query Language
    TIGERGRAPH CLOUD
    • Overview
    • Cloud Starter Kits
    • Login
    • FAQ
    • Pricing
    • Cloud Marketplaces
    GRAPHSTUDIO
    • Overview
    • Take a Test Drive
    TRY NOW
    • Get Started for Free
    • Compare Editions
    • License FAQ
    SOLUTIONS
    • Why Graph?
    industry
    • Advertising, Media & Entertainment
    • Financial Services
    • Healthcare & Life Sciences
    use cases
    • Benefits
    • Product & Service Marketing
    • Entity Resolution
    • Customer 360/MDM
    • Recommendation Engine
    • Anti-Money Laundering
    • Cybersecurity Threat Detection
    • Fraud Detection
    • Risk Assessment & Monitoring
    • Energy Management
    • Network & IT Management
    • Supply Chain Analysis
    • AI & Machine Learning
    • Geospatial Analysis
    • Time Series Analysis
    success stories
    • Customer Success Stories

    Partners

    Partner program
    • Partner Benefits
    • TigerGraph Partners
    • Sign Up
    LIBRARY
    • Resources
    • Benchmark
    • Webinars
    Events
    • Trade Shows
    • Graph + AI Summit
    • Million Dollar Challenge
    EDUCATION
    • Training & Certifications
    Blog
    • TigerGraph Blog
    DEVELOPERS
    • Developers Hub
    • Community Forum
    • Documentation
    • Ecosystem

    COMPANY

    Company
    • Overview
    • Careers
    • News
    • Press Release
    • Awards
    • Legal
    • Patents
    • Security and Compliance
    Get Started
    • Get TigerGraph
    • Compare Editions
    • Online Demo - Test Drive
    • Request a Demo

    Product

    • Overview
    • TigerGraph 3.0
    • TIGERGRAPH DB
    • TIGERGRAPH CLOUD
    • GRAPHSTUDIO
    • TRY NOW

    customers

    • success stories

    RESOURCES

    • LIBRARY
    • Events
    • EDUCATION
    • BLOG
    • DEVELOPERS

    SOLUTIONS

    • SOLUTIONS
    • use cases
    • industry

    Partners

    • partner program

    company

    • Overview
    • news
    • Press Release
    • Awards

    start for free

    • Request Demo
    • take a test drive
    • SUPPORT
    • COMMUNITY
    • CONTACT
    • Copyright © 2022 TigerGraph
    • Privacy Policy
    • Linkedin
    • Facebook
    • Twitter

    Copyright © 2020 TigerGraph | Privacy Policy

    Copyright © 2020 TigerGraph Privacy Policy

    • SUPPORT
    • COMMUNITY
    • COMPANY
    • CONTACT
    • Linkedin
    • Facebook
    • Twitter

    Copyright © 2020 TigerGraph

    Privacy Policy

    • Products
    • Solutions
    • Customers
    • Partners
    • Resources
    • Company
    • START FOR FREE
    START FOR FREE
    START FOR FREE
    TigerGraph
    PRODUCT
    PRODUCT
    • Overview
    • GraphStudio UI
    • Graph Data Science Library
    TIGERGRAPH DB
    • Overview
    • Features
    • GSQL Query Language
    TIGERGRAPH CLOUD
    • Overview
    • Cloud Starter Kits
    TRY TIGERGRAPH
    • Get Started for Free
    • Compare Editions
    SOLUTIONS
    SOLUTIONS
    • Why Graph?
    use cases
    • Benefits
    • Product & Service Marketing
    • Entity Resolution
    • Customer Journey/360
    • Recommendation Engine
    • Anti-Money Laundering (AML)
    • Cybersecurity Threat Detection
    • Fraud Detection
    • Risk Assessment & Monitoring
    • Energy Management
    • Network Resources Optimization
    • Supply Chain Analysis
    • AI & Machine Learning
    • Geospatial Analysis
    • Time Series Analysis
    industry
    • Advertising, Media & Entertainment
    • Financial Services
    • Healthcare & Life Sciences
    CUSTOMERS
    read all success stories


    PARTNERS
    Partner program
    • Partner Benefits
    • TigerGraph Partners
    • Sign Up
    RESOURCES
    LIBRARY
    • Resource Library
    • Benchmark
    • Webinars
    Events
    • Trade Shows
    • Graph + AI Summit
    • Graph for All - Million Dollar Challenge
    EDUCATION
    • TigerGraph Academy
    • Certification
    Blog
    • TigerGraph Blog
    DEVELOPERS
    • Developers Hub
    • Community Forum
    • Documentation
    • Ecosystem
    COMPANY
    COMPANY
    • Overview
    • Leadership
    • Careers  
    NEWS
    PRESS RELEASE
    AWARDS
    START FOR FREE
    Start For Free
    • Try TigerGraph Now
    • Request a Demo
    • SUPPORT
    • COMMUNITY
    • CONTACT
    Dr. Jay Yu

    Dr. Jay Yu | VP of Product and Innovation

    Dr. Jay Yu is the VP of Product and Innovation at TigerGraph, responsible for driving product strategy and roadmap, as well as fostering innovation in graph database engine and graph solutions. He is a proven hands-on full-stack innovator, strategic thinker, leader, and evangelist for new technology and product, with 25+ years of industry experience ranging from highly scalable distributed database engine company (Teradata), B2B e-commerce services startup, to consumer-facing financial applications company (Intuit). He received his PhD from the University of Wisconsin - Madison, where he specialized in large scale parallel database systems

    Todd Blaschka | COO

    Todd Blaschka is a veteran in the enterprise software industry. He is passionate about creating entirely new segments in data, analytics and AI, with the distinction of establishing graph analytics as a Gartner Top 10 Data & Analytics trend two years in a row. By fervently focusing on critical industry and customer challenges, the companies under Todd's leadership have delivered significant quantifiable results to the largest brands in the world through channel and solution sales approach. Prior to TigerGraph, Todd led go to market and customer experience functions at Clustrix (acquired by MariaDB), Dataguise and IBM.