Skip to content
START FOR FREE
START FOR FREE
  • SUPPORT
  • COMMUNITY
  • CONTACT
Menu
  • SUPPORT
  • COMMUNITY
  • CONTACT
MENUMENU
  • Products
    • The World’s Fastest and Most Scalable Graph Platform

      LEARN MORE

      Watch a TigerGraph Demo

      PRODUCTS

      • Why Graph?
      • Products Overview
      • What's New
      • GraphStudio User Interface
      • Visualization Toolkits
      • GSQL Query Language
      • Connectors

      TigerGRAPH ENTERPRISE

      • Enterprise Overview
      • Features

      TIGERGRAPH CLOUD

      • Cloud Overview
      • Cloud Starter Kits
      • Login/Sign Up
      • FAQ
      • Pricing
      • Marketplaces

      Graph Data Science

      • Graph Data Science Library
      • Machine Learning Workbench

      TRY TIGERGRAPH

      • Get Started for Free
      • Compare Editions
      • Test Drive - Online Demo
      • Watch Demos
      • Request a Demo
  • Solutions
    • The World’s Fastest and Most Scalable Graph Platform

      LEARN MORE

      Watch a TigerGraph Demo

      Solutions

      • Solutions Overview

      INCREASE REVENUE

      • Customer Journey/360
      • Product Marketing
      • Entity Resolution
      • Recommendation Engine

      MANAGE RISK

      • Fraud Detection
      • Anti-Money Laundering
      • Threat Detection
      • Risk Monitoring

      IMPROVE OPERATIONS

      • Supply Chain Analysis
      • Energy Management
      • Network Optimization

      By Industry

      • Advertising, Media & Entertainment
      • Financial Services
      • Healthcare & Life Sciences

      FOUNDATIONAL

      • AI & Machine Learning
      • Time Series Analysis
      • Geospatial Analysis
  • Customers
    • The World’s Fastest and Most Scalable Graph Platform

      LEARN MORE

      CUSTOMER SUCCESS STORIES

      • Citrix
      • Ford
      • Intuit
      • JPMorgan Chase
      • READ MORE SUCCESS STORIES
      • Jaguar Land Rover
      • United Health Group
      • Xbox
  • Partners
    • The World’s Fastest and Most Scalable Graph Platform

      LEARN MORE

      PARTNER PROGRAM

      • Partner Benefits
      • TigerGraph Partners
      • Sign Up
      TigerGraph partners with organizations that offer complementary technology solutions and services.​
  • Resources
    • The World’s Fastest and Most Scalable Graph Platform

      LEARN MORE

      BLOG

      • TigerGraph Blog

      RESOURCES

      • Resource Library
      • Benchmarks
      • Demos
      • O'Reilly Graph + ML Book

      EVENTS & WEBINARS

      • Graph+AI Summit
      • Graph for All - Million Dollar Challenge
      • Events &Trade Shows
      • Webinars

      DEVELOPERS

      • Documentation
      • Ecosystem
      • Developers Hub
      • Community Forum

      SUPPORT

      • Contact Support
      • Production Guidelines

      EDUCATION

      • Training & Certifications
  • Company
    • Join the World’s Fastest and Most Scalable Graph Platform

      WE ARE HIRING

      COMPANY

      • Company Overview
      • Leadership
      • Legal Terms
      • Patents
      • Security and Compliance

      CAREERS

      • Join Us
      • Open Positions

      AWARDS

      • Awards and Recognition
      • Leader in Forrester Wave
      • Gartner Research

      PRESS RELEASE

      • Read All Press Releases
      TigerGraph Appoints Eisuke Saito as General Manager and VP, Japan
      August 7, 2022
      Read More »

      NEWS

      • Read All News

      Four Lessons For New And Would-Be Founders I Learned When I Made A Career Pivot

      Hashmap on Tap

      #133 Connecting the Dots Faster Than Ever with Dr. Victor Lee at TigerGraph

  • START FOR FREE
    • The World’s Fastest and Most Scalable Graph Platform

      GET STARTED

      • Request a Demo
      • CONTACT US
      • Try TigerGraph
      • GET STARTED FOR FREE
      • TRY AN ONLINE DEMO

Coronavirus: A Serious Need for Analyzing Connections

  • Victor Lee
  • February 27, 2020
  • blog, Graph Database Market, Healthcare
  • Blog >
  • Coronavirus: A Serious Need for Analyzing Connections

Graph Analytics may be invaluable to help prevent epidemics.

On February 24, James Hamblin published an article in The Atlantic with the attention-grabbing headline, “You’re Likely to Get the Coronavirus.” In it, he compares the current COVID-19 epidemic with previous events: H5N1 Avian Flu, SARS, and MERS. Each of these was much more fatal to humans. Fortunately, they were also more confined in their spread, keeping the total fatalities to fewer than 1000 persons each. On the other hand, many public health scientists are pessimistic about keeping COVID-19 tightly confined, in part because it is less virulent. One scientist expects it will eventually be like the cold or the flu — a seasonal malady which is global and kills a certain number of persons every year.

Here is the reasoning: persons infected with COVID-19 are slow to show symptoms; they can be contagious without knowing it. Therefore, infected persons will continue normal activity for a while and will infect many others. Conversely, persons who had SARS felt sick, stopped moving about, and in many cases died, ending further infection from them. 

Viral Propagation

This discussion about the dynamics of infection — viral propagation — called to mind mathematical models that I had read about in my grad school days when I first started to study graph analytics and network dynamics. One paper that has stuck with me is Maximizing the spread of influence through a social network, by David Kempe and Jon Kleinberg. They described two categories of propagation mechanism — linear threshold, where a target is activated when enough of its neighbors are activated, and independent cascade, where each activated person has a certain probability of activating each of its neighbors. The independent cascade model seems to fit COVID-19 better.

The Johns Hopkins Center for Systems Science and Engineering is maintaining a global map of COVID-19 cases, visually depicting the vital statistics by location, down to the city when possible. When I see where the disease has reached North America, I see a high correlation to the major international airports, because of course air passengers were the means by which the virus crossed the oceans.

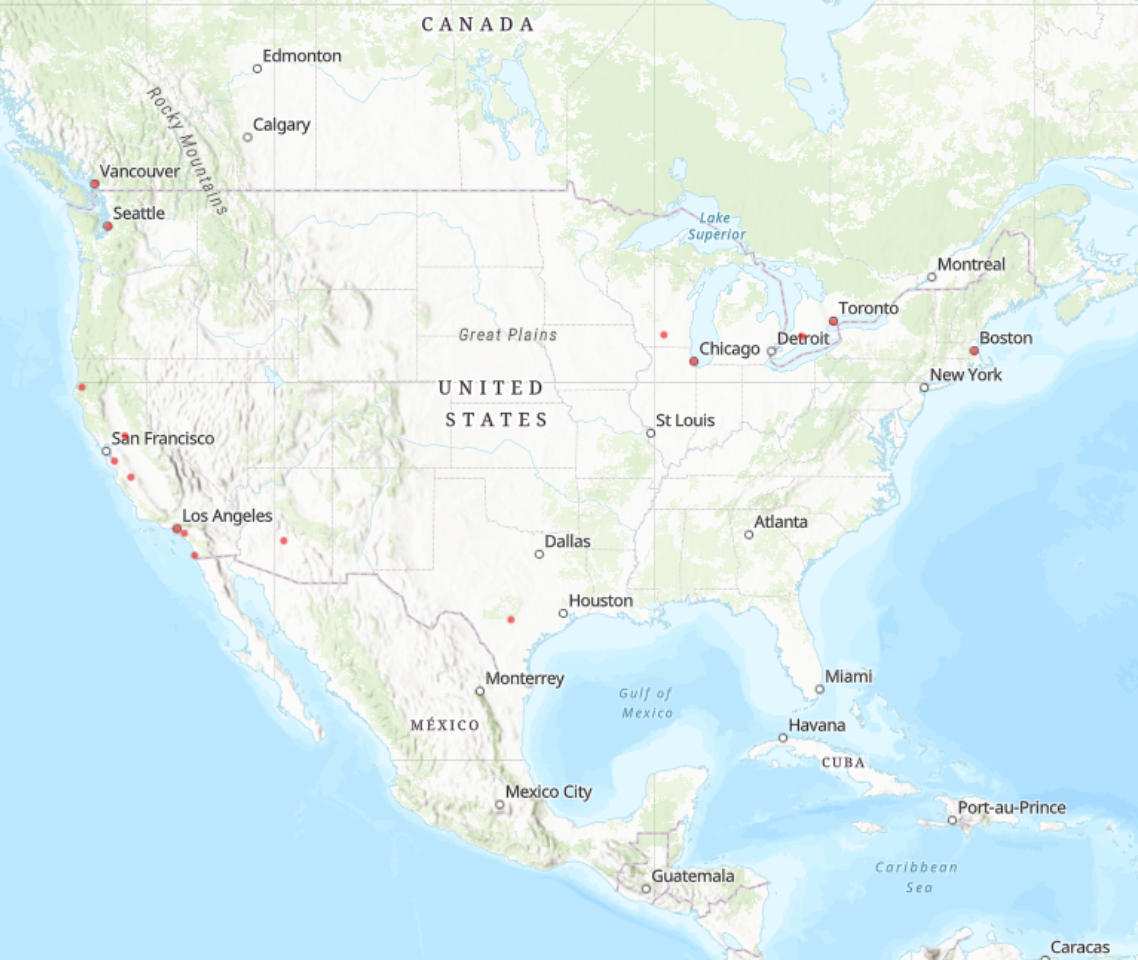
Screenshot from Johns Hopkins CSSE Coronavirus-19 map, taken on February 26, 2020.

Modeling the Spread of COVID-19

Where is all of this leading? We could build a simple graph-based model to model the spread of an infectious disease like COVID-19.

1. Recently I presented some webinars on graph algorithms that used the global commercial flight routes as a dataset. Use this graph or a similar one to model the high-level COVID-19 propagation pathways.

2. Using the Independent Cascade model, describe the basic dynamics. Take into account the factors mentioned in the Atlantic article and others that seem relevant:
         1. likelihood of being infected by a neighbor
         2. simple probabilistic and timestep (Markov) model for the states of an infected person, such as
                        – Number of air passengers per day on each route.
                        – Likelihood of being contagious, with delay and duration times
                        – Likelihood of feeling unwell, with delay and duration times
                        – Likelihood of dying, the delay times

Is this an amateurish approach? Sure. But it might at least be a good educational tool to explain how and why different diseases propagate differently.

For serious work, you would want to couple this with models of land-based propagation. Here is where it gets much more complex because there is a much higher degree of human interaction. Epidemiologists have existing techniques for these studies, and no doubt some of them are using graph modeling already. The graph could model both geolocation data as well as more abstract things such as steps in a screening and quarantine program. Researchers in the biological sciences are also already using graphs to model metabolic processes and pathways and using subgraph similarity in the search for effective treatments. Bioscientists have driven many of the advances in network analytics. Graph analytics is also providing richer data to train deep learning applications, finding patterns and solutions that humans overlook.

Connecting Ideas

Our colleagues at TigerGraph’s sales office in China have granted the local authorities a license to use TigerGraph Enterprise Edition for the duration of the crisis. At the main TigerGraph offices in the U.S., we’re planning how we can likewise assist in the race against COVID-19. We already offer free versions, on the cloud or to install on your own.

This is an opportunity for people from different fields and backgrounds to collaborate on a common concern. We’re setting up a special forum at https://community.tigergraph.com/c/project-impact/covid-19. If you have ideas and questions about using graph models and analytics or are looking for collaborators, we invite you to join us there.

Learn more at https://www.tigergraph.com/stopcoronavirus/

You Might Also Like

Get to Know the Latest TigerGraph Cloud Release

Get to Know the Latest TigerGraph...

August 2, 2022
Interview with Million Dollar Challenge Grand Prize Winners - Mental Health Hero

Interview with Million Dollar Challenge Grand...

August 1, 2022
Podcast: Learn More About the TigerGraph Cloud July 2022 Release

Podcast: Learn More About the TigerGraph...

July 28, 2022

Introducing TigerGraph 3.0

July 1, 2020

Everything to Know to Pass your TigerGraph Certification Test

June 24, 2020

Neo4j 4.0 Fabric – A Look Behind the Curtain

February 7, 2020

TigerGraph Blog

  • Categories
    • ASIA PACIFIC EVENTS
    • blogs
      • About TigerGraph
      • Benchmark
      • Business
      • Community
      • Compliance
      • Customer
      • Customer 360
      • Cybersecurity
      • Developers
      • Digital Twin
      • eCommerce
      • Emerging Use Cases
      • Entity Resolution
      • Finance
      • Fraud / Anti-Money Laundering
      • GQL
      • Graph Database Market
      • Graph Databases
      • GSQL
      • Healthcare
      • Machine Learning / AI
      • Podcast
      • Supply Chain
      • TigerGraph
      • TigerGraph Cloud
    • Graph AI On Demand
      • Keynote
      • Session
    • Video
  • Recent Posts

    • Evanta CDO Executive Summit – Chicago
    • FIMA Europe 2022
    • Data. AI. Precision. Innovation. For Pharma, Healthcare & Partners
    • Gartner IT Symposium/Xpo
    • Fachkonferenz Versicherungsbetrug 2022
    TigerGraph

    Product

    SOLUTIONS

    customers

    RESOURCES

    start for free

    PRODUCT
    • Overview
    • What's New
    • Toolkits
    • Connectors
    • Data Science Library
    TIGERGRAPH DB
    • Overview
    • No-Code Graph Analytics
    • Features
    • GSQL Query Language
    TIGERGRAPH CLOUD
    • Overview
    • Cloud Starter Kits
    • Login
    • FAQ
    • Pricing
    • Cloud Marketplaces
    GRAPHSTUDIO
    • Overview
    • Take a Test Drive
    TRY NOW
    • Get Started for Free
    • Compare Editions
    • License FAQ
    SOLUTIONS
    • Why Graph?
    industry
    • Advertising, Media & Entertainment
    • Financial Services
    • Healthcare & Life Sciences
    use cases
    • Benefits
    • Product & Service Marketing
    • Entity Resolution
    • Customer 360/MDM
    • Recommendation Engine
    • Anti-Money Laundering
    • Cybersecurity Threat Detection
    • Fraud Detection
    • Risk Assessment & Monitoring
    • Energy Management
    • Network & IT Management
    • Supply Chain Analysis
    • AI & Machine Learning
    • Geospatial Analysis
    • Time Series Analysis
    success stories
    • Customer Success Stories

    Partners

    Partner program
    • Partner Benefits
    • TigerGraph Partners
    • Sign Up
    LIBRARY
    • Resources
    • Benchmark
    • Webinars
    Events
    • Trade Shows
    • Graph + AI Summit
    • Million Dollar Challenge
    EDUCATION
    • Training & Certifications
    Blog
    • TigerGraph Blog
    DEVELOPERS
    • Developers Hub
    • Community Forum
    • Documentation
    • Ecosystem

    COMPANY

    Company
    • Overview
    • Careers
    • News
    • Press Release
    • Awards
    • Legal
    • Patents
    • Security and Compliance
    Get Started
    • Get TigerGraph
    • Compare Editions
    • Online Demo - Test Drive
    • Request a Demo

    Product

    • Overview
    • TigerGraph 3.0
    • TIGERGRAPH DB
    • TIGERGRAPH CLOUD
    • GRAPHSTUDIO
    • TRY NOW

    customers

    • success stories

    RESOURCES

    • LIBRARY
    • Events
    • EDUCATION
    • BLOG
    • DEVELOPERS

    SOLUTIONS

    • SOLUTIONS
    • use cases
    • industry

    Partners

    • partner program

    company

    • Overview
    • news
    • Press Release
    • Awards

    start for free

    • Request Demo
    • take a test drive
    • SUPPORT
    • COMMUNITY
    • CONTACT
    • Copyright © 2022 TigerGraph
    • Privacy Policy
    • Linkedin
    • Facebook
    • Twitter

    Copyright © 2020 TigerGraph | Privacy Policy

    Copyright © 2020 TigerGraph Privacy Policy

    • SUPPORT
    • COMMUNITY
    • COMPANY
    • CONTACT
    • Linkedin
    • Facebook
    • Twitter

    Copyright © 2020 TigerGraph

    Privacy Policy

    • Products
    • Solutions
    • Customers
    • Partners
    • Resources
    • Company
    • START FOR FREE
    START FOR FREE
    START FOR FREE
    TigerGraph
    PRODUCT
    PRODUCT
    • Overview
    • GraphStudio UI
    • Graph Data Science Library
    TIGERGRAPH DB
    • Overview
    • Features
    • GSQL Query Language
    TIGERGRAPH CLOUD
    • Overview
    • Cloud Starter Kits
    TRY TIGERGRAPH
    • Get Started for Free
    • Compare Editions
    SOLUTIONS
    SOLUTIONS
    • Why Graph?
    use cases
    • Benefits
    • Product & Service Marketing
    • Entity Resolution
    • Customer Journey/360
    • Recommendation Engine
    • Anti-Money Laundering (AML)
    • Cybersecurity Threat Detection
    • Fraud Detection
    • Risk Assessment & Monitoring
    • Energy Management
    • Network Resources Optimization
    • Supply Chain Analysis
    • AI & Machine Learning
    • Geospatial Analysis
    • Time Series Analysis
    industry
    • Advertising, Media & Entertainment
    • Financial Services
    • Healthcare & Life Sciences
    CUSTOMERS
    read all success stories


    PARTNERS
    Partner program
    • Partner Benefits
    • TigerGraph Partners
    • Sign Up
    RESOURCES
    LIBRARY
    • Resource Library
    • Benchmark
    • Webinars
    Events
    • Trade Shows
    • Graph + AI Summit
    • Graph for All - Million Dollar Challenge
    EDUCATION
    • TigerGraph Academy
    • Certification
    Blog
    • TigerGraph Blog
    DEVELOPERS
    • Developers Hub
    • Community Forum
    • Documentation
    • Ecosystem
    COMPANY
    COMPANY
    • Overview
    • Leadership
    • Careers  
    NEWS
    PRESS RELEASE
    AWARDS
    START FOR FREE
    Start For Free
    • Try TigerGraph Now
    • Request a Demo
    • SUPPORT
    • COMMUNITY
    • CONTACT
    Dr. Jay Yu

    Dr. Jay Yu | VP of Product and Innovation

    Dr. Jay Yu is the VP of Product and Innovation at TigerGraph, responsible for driving product strategy and roadmap, as well as fostering innovation in graph database engine and graph solutions. He is a proven hands-on full-stack innovator, strategic thinker, leader, and evangelist for new technology and product, with 25+ years of industry experience ranging from highly scalable distributed database engine company (Teradata), B2B e-commerce services startup, to consumer-facing financial applications company (Intuit). He received his PhD from the University of Wisconsin - Madison, where he specialized in large scale parallel database systems

    Todd Blaschka | COO

    Todd Blaschka is a veteran in the enterprise software industry. He is passionate about creating entirely new segments in data, analytics and AI, with the distinction of establishing graph analytics as a Gartner Top 10 Data & Analytics trend two years in a row. By fervently focusing on critical industry and customer challenges, the companies under Todd's leadership have delivered significant quantifiable results to the largest brands in the world through channel and solution sales approach. Prior to TigerGraph, Todd led go to market and customer experience functions at Clustrix (acquired by MariaDB), Dataguise and IBM.