This is an abbreviated and edited version of a presentation by Dan Romuald Mbanga, Head of Product Strategy, ML, at Amazon Web Services and Deepak Juneja, Vice President – Global Data Management / Data Fabric Practice Leader, at Capgemini plus Michael Shaler, VP of Business Development at TigerGraph during the Fall 2021 Graph + AI Fall Summit conference.
Watch the full session from Graph + AI Summit Fall
Graph and artificial intelligence with machine learning solve many business challenges, in a variety of use cases across many industries. Companies that choose to be data-forward see higher profitability, higher revenue per employee, operational efficiencies, and overall they have the ability to make critical decisions faster. Yet, approximately 71% of organizations lag in terms of leveraging data.
Let’s look at this technology, how companies leverage it, and how it drives business outcomes.
Creating data, processing data, and proactively leveraging that data to bring value to customers, clients, and the company, as well as continually innovating, are traits of organizations that are “Data Masters.” Going a bit deeper, two characteristics of data-forward companies include:
- Foundation Capabilities: What companies have done in building the data platform, how they process the data, how they establish the governance and quality of the data, and making data available and self-service for business users.
- Data Behavior: It’s the DNA of the organization, the people, processes, skill-set, and the culture of the organization.
To become a data master or data-forward company, organizations need to make critical business decisions that are contextual, connected, and continuous. You need to understand the context and purpose when you are using your AI models to make decisions. Data needs to be connected to other decision-making in the enterprise. Data can’t be siloed, and it needs to be agile. Graph and AI are key to achieving this.
In the financial industry, like many others, use of the digital channel continues to increase. How do we better engage and how do we bring more value and better service?
There are a number of use cases that Graph + AI assists with:
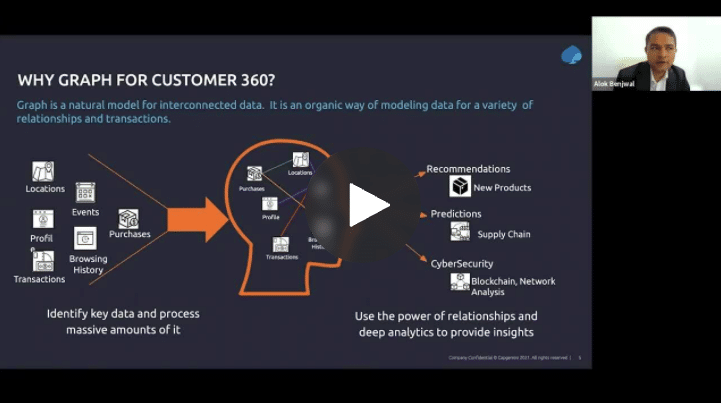
- Customer 360 and Product Recommendations: It’s critical to offer the right products at the right time to cross-sell
- Fraud Detection: As activity increases so does the chance of fraud. Checking for fraud, identifying anomalies becomes increasingly important (for cost savings)
- Transaction Monitoring: With companies having on-prem data while using multi-cloud, navigating the data landscape is complex
- Data Management/Data Trust: There are many facets to consider regarding your data, including data lineage, data quality, access management, data privacy compliance, data fabric, and others.
The following image shows what a graph data platform should look like, where you bring data, structured or unstructured, in from multiple sources, then integrate that data into a connected graph database and have the relationships, but more importantly, uncover the unknown or hidden relationships. Then you can use algorithms to drive the insights, which you can make available for visualization, and for business users to ultimately make decisions and take action.
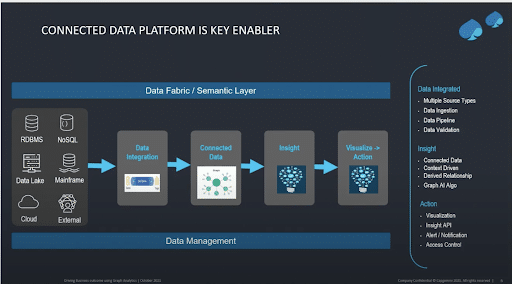
You can start with one use case and expand, such as starting with customer 360, then adding fraud, and also using it for your data platform.
The story between machine learning and data, however, is complex.
The modern data platform, where you go from the data fabric, to the knowledge layer, to the semantic layer, and so on is exciting. But there’s still a lot of work to do underneath the hood, things like labeling the data, dealing with data types, preparing the data for the purpose of machine learning, modeling, storing, and governing the data that you have to deal with. There’s still a lot of work on the backend.
Graph is essentially what you need to have better representations of your data in terms of dealing with data types, having a unified data model, having a way to represent your data in order for you to get the most effective business outcome from the perspective of graph and AI. You’re taking raw data and turning it into a super high valued asset – essentially transformed and processed data.
Traditionally, in machine learning, what has been happening is that the work that happens in between is called feature engineering. That work is essentially to get the essence of the data in terms of not just the fields, but the column relationships between the data tables, and the relationship between the columns. For example, if you have a customer in the finance database, and you have a customer in a marketing database, even if they have different relationships with the business, from a finance and marketing standpoint, there is still an opportunity. And that’s why graph feature learning is a massive opportunity.
There are a couple of challenges. One is getting your data, transforming it with a lot of hard work, and representing it to get answers out of it. Another challenge is to essentially fuel learning on top of those capabilities.
That work has been happening over and over again for every single problem you have to work on. Preparing the specific data for a specific algorithm, then getting the signal out of the work that you’ve been doing for the algorithm, and then improving the model for accuracy has essentially been a lot of work that after answers are generated for a specific problem, that entire work goes away.
The opportunity for graph and machine learning is to essentially move from that iterative “throwaway” work to learning an efficient and task-independent representation of the data upon which you can apply some machine learning techniques and essentially get insights and answers.
When we talk about linking records, when we talk about linking tables, when we talk about finding relationships in the data itself, that is a data level operation. And that’s the beauty – that’s an opportunity that graph and machine learning representation of data give us when we want to work on these problems.
If you want to solve the problem of detecting a fraudulent user, typically, you would have to find properties about the user or that specific customer in a database, and try to understand, based on either the location or the device they’re using, whether a transaction is a fraudulent one. A missed opportunity here is to figure out whether this user is using a credit card that was previously used by a user that you’ve identified as a fraudulent user. That is, again, data layer data level operation. Information that exists in the graph data structure you can mine, essentially, for the answer to your question, without having to do that entire “throwaway” work that you had to do in the past with regards to machine learning. This kind of operation is called node-level prediction.
The opportunity, again, at the data layer, is to find a relationship among different entities. Find the relationship between genes, drug compounds and disease, and so on, to see if an existing drug might be beneficial to a particular disease.
Example: How One Bank Successfully Drove Business Outcomes via Graph+AI+ML
TigerGraph helped one of the largest banks in the U.S., which had to pay a fine the previous quarter, with a specific challenge: reduce the number of false positives while increasing the accuracy of “non-obvious” relationships in anti-money laundering investigations.
Anti-money laundering is not just about finding the mules; it’s about finding the rings. You have to be able to connect your customer’s customer’s customers. You can’t do that with a traditional database. You can only do that with the combination of graph + AI + ML.
This bank was on a journey to become data masters, in a very powerful way, very quickly. They leveraged graph analytics both algorithmically as well as leveraging queries. They were able to transform the way they handled anti-money laundering.
TigerGraph can bring in the entire transactional history and ingest that into the graph database, and we’re able to automate that. On top of that, we built a solution that gave them a workflow for investigations. They were able to share findings and, ultimately, increase accuracy. Their false positives went down and they were able to reduce $10M in process automation costs. They were able to be much more efficient, more effective, and deliver a real-time system. It changed the bank’s posture on the persistent financial threats in anti-money laundering.
The summary here is that it’s not just graph, it’s all the things that go along with graph: connected data, connected insights, and connected learning.
It takes graph, plus AI + ML and humans to equal great business outcomes.
Spring 2022 Graph + AI Summit
The Spring 2022 Graph + AI Summit is coming up fast and we’re looking for speakers to contribute to the event! Visit our event page and submit your presentation idea. The call for speakers is open until April 11, 2022.