Skip to content
START FOR FREE
START FOR FREE
  • SUPPORT
  • COMMUNITY
Menu
  • SUPPORT
  • COMMUNITY
MENUMENU
  • Products
    • The World’s Fastest and Most Scalable Graph Platform

      LEARN MORE

      Watch a TigerGraph Demo

      TIGERGRAPH CLOUD

      • Overview
      • TigerGraph Cloud Suite
      • FAQ
      • Pricing

      USER TOOLS

      • GraphStudio
      • Insights
      • Application Workbenches
      • Connectors and Drivers
      • Starter Kits
      • openCypher Support

      TIGERGRAPH DB

      • Overview
      • GSQL Query Language
      • Compare Editions

      GRAPH DATA SCIENCE

      • Graph Data Science Library
      • Machine Learning Workbench
  • Solutions
    • The World’s Fastest and Most Scalable Graph Platform

      LEARN MORE

      Watch a TigerGraph Demo

      Solutions

      • Solutions Overview

      INCREASE REVENUE

      • Customer Journey/360
      • Product Marketing
      • Entity Resolution
      • Recommendation Engine

      MANAGE RISK

      • Fraud Detection
      • Anti-Money Laundering
      • Threat Detection
      • Risk Monitoring

      IMPROVE OPERATIONS

      • Supply Chain Analysis
      • Energy Management
      • Network Optimization

      By Industry

      • Advertising, Media & Entertainment
      • Financial Services
      • Healthcare & Life Sciences

      FOUNDATIONAL

      • AI & Machine Learning
      • Time Series Analysis
      • Geospatial Analysis
  • Customers
    • The World’s Fastest and Most Scalable Graph Platform

      LEARN MORE

      CUSTOMER SUCCESS STORIES

      • Ford
      • Intuit
      • JPMorgan Chase
      • READ MORE SUCCESS STORIES
      • Jaguar Land Rover
      • United Health Group
      • Xbox
  • Partners
    • The World’s Fastest and Most Scalable Graph Platform

      LEARN MORE

      PARTNER PROGRAM

      • Partner Benefits
      • TigerGraph Partners
      • Sign Up
      TigerGraph partners with organizations that offer complementary technology solutions and services.​
  • Resources
    • The World’s Fastest and Most Scalable Graph Platform

      LEARN MORE

      BLOG

      • TigerGraph Blog

      RESOURCES

      • Resource Library
      • Benchmarks
      • Demos
      • O'Reilly Graph + ML Book

      EVENTS & WEBINARS

      • Graph+AI Summit
      • Graph for All - Million Dollar Challenge
      • Events &Trade Shows
      • Webinars

      DEVELOPERS

      • Documentation
      • Ecosystem
      • Developers Hub
      • Community Forum

      SUPPORT

      • Contact Support
      • Production Guidelines

      EDUCATION

      • Training & Certifications
  • Company
    • Join the World’s Fastest and Most Scalable Graph Platform

      WE ARE HIRING

      COMPANY

      • Company Overview
      • Leadership
      • Legal Terms
      • Patents
      • Security and Compliance

      CAREERS

      • Join Us
      • Open Positions

      AWARDS

      • Awards and Recognition
      • Leader in Forrester Wave
      • Gartner Research

      PRESS RELEASE

      • Read All Press Releases
      TigerGraph Reports Exceptional Customer Growth and Product Leadership as More Market-Leading Companies Tap the Power of Graph
      March 1, 2023
      Read More »

      NEWS

      • Read All News
      The-New-Stack-Logo-square

      Multiple Vendors Make Data and Analytics Ubiquitous

      TigerGraph enhances fundamentals in latest platform update

  • START FREE
    • The World’s Fastest and Most Scalable Graph Platform

      GET STARTED

      • Request a Demo
      • CONTACT US
      • Try TigerGraph
      • START FREE
      • TRY AN ONLINE DEMO

Finding Needles in a Haystack with Graph Databases and Machine Learning

  • Todd Blaschka
  • May 7, 2018
  • blog, Fraud / Anti-Money Laundering, Machine Learning / AI
  • Blog >
  • Finding Needles in a Haystack with Graph Databases and Machine Learning

You know a technology has reached a tipping point when your kids ask about it. This happened recently when my eighth grade daughter asked, “What is Machine Learning and why is it so important?”.

Answering her question, I explained how Machine Learning is part of AI, where we teach machines to reason and learn like human beings. I used the example of fraud detection. In many ways catching fraud is like finding needles in a haystack – you must sort and make sense of massive amounts of data in order to find your “needles” or in this case, your fraudsters.

Consider a phone company which has billions of calls occuring in its network on a weekly basis. How can we identify signs of fraudulent activity from a mountain – or haystack – of calls? This is where Machine Learning comes in.

Of course, my daughter was ready with a solution to the problem: “Why not use a powerful magnet to draw out the needles from the haystack?”

She’s right. When it comes to training a machine to spot fraudsters, we need to provide it with a more powerful magnet for drawing them out. Our magnet in this case is the ability to identify behaviors and patterns of likely fraudsters. Using this, a machine is more adept at recognizing suspicious phone call patterns and is able to separate them from the billions of calls made by regular people which comprises our haystack of data.

Current Machine Training Approaches Are Missing the Mark

Let’s use this example to consider current approaches for identifying fraudsters based on Machine Learning. Supervised Machine Learning algorithms need training data – in this case phone calls identified as calls from confirmed fraudsters. There are two problems with the current approach, including both the quantity and quality of training data.

Confirmed fraudulent activity in phone networks currently constitutes less than 1% of total call volume. So, the volume or the quantity of training data with confirmed fraud activity is tiny. Having a small quantity of training data in turn results in poor accuracy for the Machine Learning algorithms.

Features or attributes for finding a fraudster are based on simple analysis. In this case they include calling history of a particular phones to other phones that may be in or out of the network, the age of a pre-paid SIM card, percentage of one-directional calls made (cases where the call recipient did not return a phone call) and the percentage of rejected calls. These simplistic features tend to result in a lot of false positives. It’s no wonder when you consider how in addition to a fraudster, these features may also fit the behavior of a sales person or a prankster!

Training the Machine for Fraud Detection, by Building a Better Magnet with Graph Features

A large mobile operator uses TigerGraph, the next generation graph database with Real-Time Deep Link Analytics, to address the deficiencies of current approaches for training machine learning algorithms. The solution analyzes over 10 billion calls for 460 million mobile phones, and generates 118 features for each mobile phone. These are based on deeper analysis of calling history, and go beyond immediate recipients for calls.

The diagram below illustrates how the graph database identifies a phone as a “good” or a “bad” phone. A bad phone requires further investigation to determine whether it belongs to a fraudster.

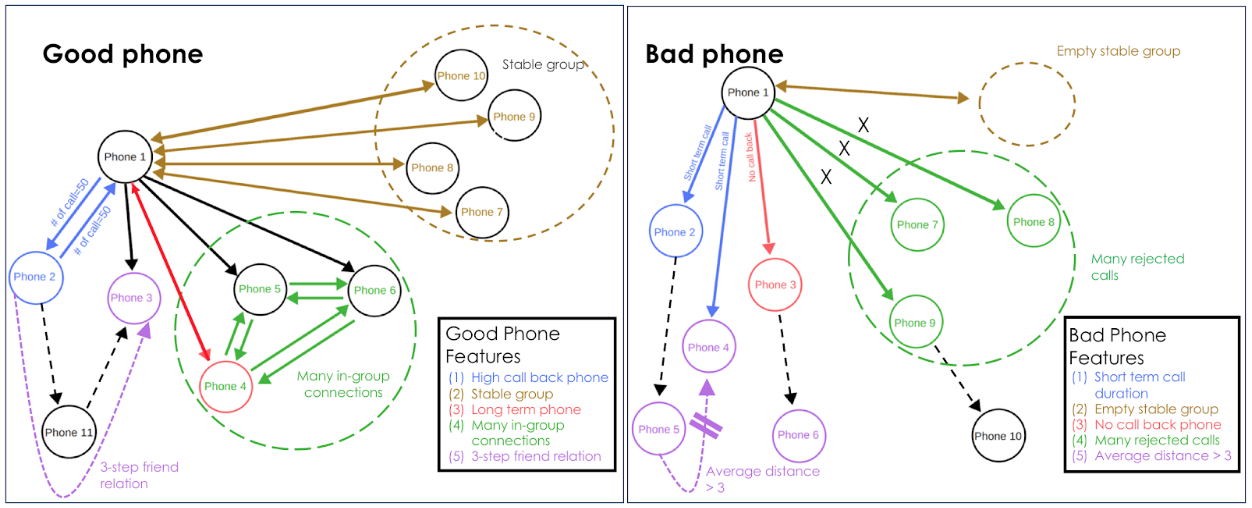
Figure 1 – Detecting phone-based fraud by analyzing network or graph relationship features

“Good” Phones vs. “Bad” Phones
A customer with a good phone calls other subscribers, and the majority of their calls are returned. This helps to indicate familiarity or trusted relationships between the users. A good phone also regularly calls a set of others phones – say, every week or month – and this group of phones is fairly stable over a period of time (“Stable Group”).

Another feature indicating good phone behavior is when a phone calls another that has been in the network for many months or years and receives calls back. We also see a high number of calls between the good phone, the long-term phone contact and other phones within a network calling both these numbers frequently. This indicates many in-group connections for our good phone.

Lastly, a good phone is often involved in a three step friend connection – meaning our good phone calls another phone, phone 2, which calls phone 3. The good phone is also in touch with direct calls with phone 3. This indicates a three step friend connection, indicating a circle of trust and interconnectedness.

By analyzing such call patterns between phones, TigerGraph can easily identify bad phones, which are phones likely involved with scam. These are phones have short calls with multiple good phones, but receive no calls back. They also do not have a stable group of phones called on a regular basis (representing an “empty stable group”). When a bad phone calls a long-term customer in the network, the call is not returned. The bad phone also receives many rejected calls and lacks three step friend relationships.

As a graph database platform, TigerGraph leverages more than 118 new features that highly correlate with good and bad phone behavior for each of 460 million mobile phones in our use case. In turn it generates 54 billion new training data features to feed Machine Learning algorithms.

This has led to dramatic improvement in accuracy of Machine Learning for fraud detection, resulting in fewer false positives (non-fraudulent phones marked as potential fraudster phones) as well as lower false negatives (phones involved in fraud that weren’t marked as such).

Improving Machine Learning Accuracy with Graph-Based Features

To see how graph-based features improve accuracy for Machine Learning, let’s consider an example (Figure 2) using profiles for four mobile users: Tim, Sarah, Fred and John.

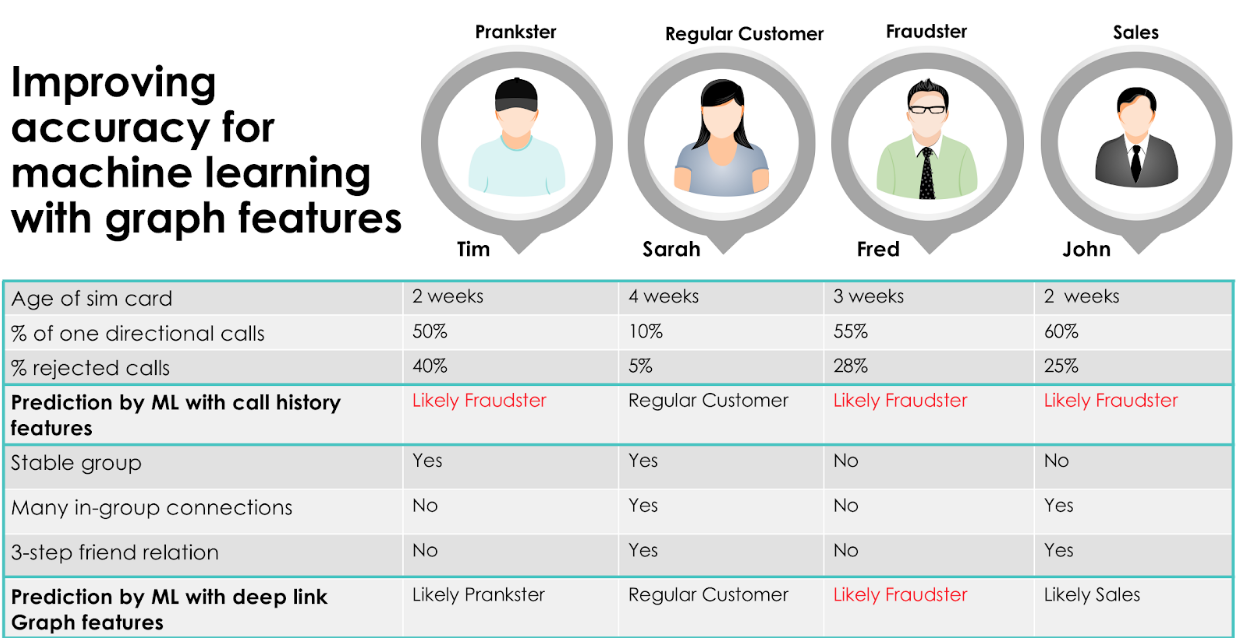
Figure 2 – Improving accuracy for machine learning with graph features

Traditional calling history features, such as age of the SIM card used, percentage of one directional calls and percentage of total calls rejected by their recipients, result in flagging three out of four of our customers, Tim, Fred and John as likely or potential fraudsters as they look very similar based on these features. Graph based features with analysis of deep link or multi-hop relationships across phones and subscribers helps Machine Learning classify Tim as a prankster, John as a sales person, while Fred is flagged as a likely fraudster. Let’s consider how.

In the case of Tim, he has a stable group, which means he is unlikely to be a sales guy, since sales people call different numbers each week. Tim doesn’t have many in-group connections, which means he is likely calling strangers. He also doesn’t have any 3-step friend connections to confirm that the strangers he is calling aren’t related. It is very likely that Tim is a prankster based on these features.

Let’s consider John who doesn’t have a stable group, which means he is calling new potential leads every day. He calls people with many in-group connections. As John presents his product or service, some of the call recipients are most likely introducing him to other contacts if they think the product or service would be interesting or relevant to them. John is also connected via 3-step friend relations, indicating that he is closing the loop as an effective sales guy, navigating the friends or colleagues of his first contact within a group, as he reaches the final buyer for his product or service. The combination of these features classifies John as a sales person.

In the case of Fred, he doesn’t have a stable group, nor does he interact with a group that has many in-group connections. Plus, he does not have 3-step friend relations among the people he calls. This makes him a very likely candidate for investigation as a phone scam artist or fraudster.

Going back to our original analogy, we are able to find our needle in the haystack, in our case it’s Fred the potential fraudster, by leveraging graph analysis for better Machine Learning for improved accuracy. This is achieved by using the graph database framework to model data in a way that allows for more features that can be identified and considered to further analyze our haystack of data. The machine in turn is trained with more and more accurate data, making it smarter and more successful in recognizing potential scam artists and fraudsters.

Training Machine Learning with Graph Features for Other Use Cases

Graph features generated in real-time by TigerGraph are being used for a host of use cases beyond identifying phone-based scam. These include training Machine Learning to detect various other types of anomalous behavior, including credit card-related fraud – which affects all merchants selling products or services via eCommerce, and money laundering violations – spanning the entire financial services ecosystem and including banks, payment providers and newer crypto currencies such as Bitcoin and Ripple.

eCommerce companies are also using graph-based features to create product recommendations based on a customer’s buying behavior, other customers in their extended network and also those who have similar buying preferences. These new features are fed as training data to the Machine Learning algorithms to improve accuracy for future recommendations.

Starting Your Own Journey to a Smarter Machine Learning System

TigerGraph is the world’s fastest graph database, providing Real-Time Deep Link Analytics to generate new features to feed your Machine Learning system. The result is improved accuracy with fewer false negatives and false positives. We invite you to try it now to see how it fits your business needs. And if you’re at the Chief Analytics Officer, Spring Event (May 14-16th in San Francisco), come see us at the TigerGraph booth.


You Might Also Like

Trillion edges benchmark: new world record beyond 100TB by TigerGraph featuring AMD based Amazon EC2 instances

Trillion edges benchmark: new world record...

March 13, 2023
Graph Databases 101: Your Top 5 Questions with Non-Technical Answers

Graph Databases 101: Your Top 5...

February 7, 2023
It’s Time to Harness the Power of Graph Technology [Infographic]

It’s Time to Harness the Power...

January 25, 2023

Introducing TigerGraph 3.0

July 1, 2020

Everything to Know to Pass your TigerGraph Certification Test

June 24, 2020

Neo4j 4.0 Fabric – A Look Behind the Curtain

February 7, 2020

TigerGraph Blog

  • Categories
    • blogs
      • About TigerGraph
      • Benchmark
      • Business
      • Community
      • Compliance
      • Customer
      • Customer 360
      • Cybersecurity
      • Developers
      • Digital Twin
      • eCommerce
      • Emerging Use Cases
      • Entity Resolution
      • Finance
      • Fraud / Anti-Money Laundering
      • GQL
      • Graph Database Market
      • Graph Databases
      • GSQL
      • Healthcare
      • Machine Learning / AI
      • Podcast
      • Supply Chain
      • TigerGraph
      • TigerGraph Cloud
    • Graph AI On Demand
      • Analysts and Research
      • Customer 360 and Entity Resolution
      • Customer Spotlight
      • Development
      • Finance, Banking, Insurance
      • Keynote
      • Session
    • Video
  • Recent Posts

    • Trillion edges benchmark: new world record beyond 100TB by TigerGraph featuring AMD based Amazon EC2 instances
    • Overview of Graph and Machine Learning with TigerGraph | Mar 8 @ 11am PST
    • Gartner Data & Analytics Summit 2023, London
    • Gartner Data and Analytics Summit, Orlando
    • Transaction Surveillance with Maximum Flow Algorithm
    TigerGraph

    Product

    SOLUTIONS

    customers

    RESOURCES

    start for free

    TIGERGRAPH DB
    • Overview
    • Features
    • GSQL Query Language
    GRAPH DATA SCIENCE
    • Graph Data Science Library
    • Machine Learning Workbench
    TIGERGRAPH CLOUD
    • Overview
    • Cloud Starter Kits
    • Login
    • FAQ
    • Pricing
    • Cloud Marketplaces
    USEr TOOLS
    • GraphStudio
    • TigerGraph Insights
    • Application Workbenches
    • Connectors and Drivers
    • Starter Kits
    • openCypher Support
    SOLUTIONS
    • Why Graph?
    industry
    • Advertising, Media & Entertainment
    • Financial Services
    • Healthcare & Life Sciences
    use cases
    • Benefits
    • Product & Service Marketing
    • Entity Resolution
    • Customer 360/MDM
    • Recommendation Engine
    • Anti-Money Laundering
    • Cybersecurity Threat Detection
    • Fraud Detection
    • Risk Assessment & Monitoring
    • Energy Management
    • Network & IT Management
    • Supply Chain Analysis
    • AI & Machine Learning
    • Geospatial Analysis
    • Time Series Analysis
    success stories
    • Customer Success Stories

    Partners

    Partner program
    • Partner Benefits
    • TigerGraph Partners
    • Sign Up
    LIBRARY
    • Resources
    • Benchmark
    • Webinars
    Events
    • Trade Shows
    • Graph + AI Summit
    • Million Dollar Challenge
    EDUCATION
    • Training & Certifications
    Blog
    • TigerGraph Blog
    DEVELOPERS
    • Developers Hub
    • Community Forum
    • Documentation
    • Ecosystem

    COMPANY

    Company
    • Overview
    • Careers
    • News
    • Press Release
    • Awards
    • Legal
    • Patents
    • Security and Compliance
    • Contact
    Get Started
    • Start Free
    • Compare Editions
    • Online Demo - Test Drive
    • Request a Demo

    Product

    • Overview
    • TigerGraph 3.0
    • TIGERGRAPH DB
    • TIGERGRAPH CLOUD
    • GRAPHSTUDIO
    • TRY NOW

    customers

    • success stories

    RESOURCES

    • LIBRARY
    • Events
    • EDUCATION
    • BLOG
    • DEVELOPERS

    SOLUTIONS

    • SOLUTIONS
    • use cases
    • industry

    Partners

    • partner program

    company

    • Overview
    • news
    • Press Release
    • Awards

    start for free

    • Request Demo
    • take a test drive
    • SUPPORT
    • COMMUNITY
    • CONTACT
    • Copyright © 2023 TigerGraph
    • Privacy Policy
    • Linkedin
    • Facebook
    • Twitter

    Copyright © 2020 TigerGraph | Privacy Policy

    Copyright © 2020 TigerGraph Privacy Policy

    • SUPPORT
    • COMMUNITY
    • COMPANY
    • CONTACT
    • Linkedin
    • Facebook
    • Twitter

    Copyright © 2020 TigerGraph

    Privacy Policy

    • Products
    • Solutions
    • Customers
    • Partners
    • Resources
    • Company
    • START FREE
    START FOR FREE
    START FOR FREE
    TigerGraph
    PRODUCT
    PRODUCT
    • Overview
    • GraphStudio UI
    • Graph Data Science Library
    TIGERGRAPH DB
    • Overview
    • Features
    • GSQL Query Language
    TIGERGRAPH CLOUD
    • Overview
    • Cloud Starter Kits
    TRY TIGERGRAPH
    • Get Started for Free
    • Compare Editions
    SOLUTIONS
    SOLUTIONS
    • Why Graph?
    use cases
    • Benefits
    • Product & Service Marketing
    • Entity Resolution
    • Customer Journey/360
    • Recommendation Engine
    • Anti-Money Laundering (AML)
    • Cybersecurity Threat Detection
    • Fraud Detection
    • Risk Assessment & Monitoring
    • Energy Management
    • Network Resources Optimization
    • Supply Chain Analysis
    • AI & Machine Learning
    • Geospatial Analysis
    • Time Series Analysis
    industry
    • Advertising, Media & Entertainment
    • Financial Services
    • Healthcare & Life Sciences
    CUSTOMERS
    read all success stories


    PARTNERS
    Partner program
    • Partner Benefits
    • TigerGraph Partners
    • Sign Up
    RESOURCES
    LIBRARY
    • Resource Library
    • Benchmark
    • Webinars
    Events
    • Trade Shows
    • Graph + AI Summit
    • Graph for All - Million Dollar Challenge
    EDUCATION
    • TigerGraph Academy
    • Certification
    Blog
    • TigerGraph Blog
    DEVELOPERS
    • Developers Hub
    • Community Forum
    • Documentation
    • Ecosystem
    COMPANY
    COMPANY
    • Overview
    • Leadership
    • Careers  
    NEWS
    PRESS RELEASE
    AWARDS
    START FREE
    Start Free
    • Request a Demo
    • SUPPORT
    • COMMUNITY
    • CONTACT
    Dr. Jay Yu

    Dr. Jay Yu | VP of Product and Innovation

    Dr. Jay Yu is the VP of Product and Innovation at TigerGraph, responsible for driving product strategy and roadmap, as well as fostering innovation in graph database engine and graph solutions. He is a proven hands-on full-stack innovator, strategic thinker, leader, and evangelist for new technology and product, with 25+ years of industry experience ranging from highly scalable distributed database engine company (Teradata), B2B e-commerce services startup, to consumer-facing financial applications company (Intuit). He received his PhD from the University of Wisconsin - Madison, where he specialized in large scale parallel database systems

    Todd Blaschka | COO

    Todd Blaschka is a veteran in the enterprise software industry. He is passionate about creating entirely new segments in data, analytics and AI, with the distinction of establishing graph analytics as a Gartner Top 10 Data & Analytics trend two years in a row. By fervently focusing on critical industry and customer challenges, the companies under Todd's leadership have delivered significant quantifiable results to the largest brands in the world through channel and solution sales approach. Prior to TigerGraph, Todd led go to market and customer experience functions at Clustrix (acquired by MariaDB), Dataguise and IBM.