Skip to content
START FOR FREE
START FOR FREE
  • SUPPORT
  • COMMUNITY
Menu
  • SUPPORT
  • COMMUNITY
MENUMENU
  • Products
    • The World’s Fastest and Most Scalable Graph Platform

      LEARN MORE

      Watch a TigerGraph Demo

      TIGERGRAPH CLOUD

      • Overview
      • TigerGraph Cloud Suite
      • FAQ
      • Pricing

      USER TOOLS

      • GraphStudio
      • Insights
      • Application Workbenches
      • Connectors and Drivers
      • Starter Kits
      • openCypher Support

      TIGERGRAPH DB

      • Overview
      • GSQL Query Language
      • Compare Editions

      GRAPH DATA SCIENCE

      • Graph Data Science Library
      • Machine Learning Workbench
  • Solutions
    • The World’s Fastest and Most Scalable Graph Platform

      LEARN MORE

      Watch a TigerGraph Demo

      Solutions

      • Solutions Overview

      INCREASE REVENUE

      • Customer Journey/360
      • Product Marketing
      • Entity Resolution
      • Recommendation Engine

      MANAGE RISK

      • Fraud Detection
      • Anti-Money Laundering
      • Threat Detection
      • Risk Monitoring

      IMPROVE OPERATIONS

      • Supply Chain Analysis
      • Energy Management
      • Network Optimization

      By Industry

      • Advertising, Media & Entertainment
      • Financial Services
      • Healthcare & Life Sciences

      FOUNDATIONAL

      • AI & Machine Learning
      • Time Series Analysis
      • Geospatial Analysis
  • Customers
    • The World’s Fastest and Most Scalable Graph Platform

      LEARN MORE

      CUSTOMER SUCCESS STORIES

      • Ford
      • Intuit
      • JPMorgan Chase
      • READ MORE SUCCESS STORIES
      • Jaguar Land Rover
      • United Health Group
      • Xbox
  • Partners
    • The World’s Fastest and Most Scalable Graph Platform

      LEARN MORE

      PARTNER PROGRAM

      • Partner Benefits
      • TigerGraph Partners
      • Sign Up
      TigerGraph partners with organizations that offer complementary technology solutions and services.​
  • Resources
    • The World’s Fastest and Most Scalable Graph Platform

      LEARN MORE

      BLOG

      • TigerGraph Blog

      RESOURCES

      • Resource Library
      • Benchmarks
      • Demos
      • O'Reilly Graph + ML Book

      EVENTS & WEBINARS

      • Graph+AI Summit
      • Graph for All - Million Dollar Challenge
      • Events &Trade Shows
      • Webinars

      DEVELOPERS

      • Documentation
      • Ecosystem
      • Developers Hub
      • Community Forum

      SUPPORT

      • Contact Support
      • Production Guidelines

      EDUCATION

      • Training & Certifications
  • Company
    • Join the World’s Fastest and Most Scalable Graph Platform

      WE ARE HIRING

      COMPANY

      • Company Overview
      • Leadership
      • Legal Terms
      • Patents
      • Security and Compliance

      CAREERS

      • Join Us
      • Open Positions

      AWARDS

      • Awards and Recognition
      • Leader in Forrester Wave
      • Gartner Research

      PRESS RELEASE

      • Read All Press Releases
      TigerGraph Reports Exceptional Customer Growth and Product Leadership as More Market-Leading Companies Tap the Power of Graph
      March 1, 2023
      Read More »

      NEWS

      • Read All News
      The-New-Stack-Logo-square

      Multiple Vendors Make Data and Analytics Ubiquitous

      TigerGraph enhances fundamentals in latest platform update

  • START FREE
    • The World’s Fastest and Most Scalable Graph Platform

      GET STARTED

      • Request a Demo
      • CONTACT US
      • Try TigerGraph
      • START FREE
      • TRY AN ONLINE DEMO

Hansel and Gretel & Big Data Analytics with Graphs

  • Todd Blaschka
  • April 8, 2019
  • blog, Developers, Graph Databases, GSQL
  • Blog >
  • Hansel and Gretel & Big Data Analytics with Graphs

My daughter, a high schooler heard me chatting with a client last week and asked me, “Why do you keep going on and on about GSQL and something called the accumulators?  What’s the big deal?” As I thought about the best way to explain accumulators, a key feature in TigerGraph’s graph query language – GSQL, I realized that it has something in common with a story from our childhood – the story of Hansel and Gretel.

In the story, Hansel and Gretel carry white pebbles in their pockets and keep dropping the pebbles as they walk deeper into the forest so that they can remember the path they took and can find their way back home. Accumulators in GSQL can serve as the “pebbles” in graph traversal algorithms. What’s more, accumulators also come with built-in computational functions and data structures, and most importantly, they are designed to work with parallel computation. That’s as if we had an army of Hansels and Gretels who were also data scientists. We’ll cover each of these three aspects – path traversal, computing, and parallelism, one at a time in the example below.

Let’s consider a common question answered with TigerGraph by our customers in multiple industries including financial services, pharmaceutical, healthcare, telecom, internet and government – given a set of business entities such as two merchants for financial services or two doctors for healthcare, how are they related? Do they have customers or patients in common and how is their relationship evolving over a period of time?

Understanding the relationship between two merchants with relational database

Let’s dig deeper into this topic with an example. Consider two merchants, Merchant 1 and Merchant 2. Customers 1, 2, 3 and 4 shop at Merchant 1, while Customers 1, 2, 3 and 5 shop at Merchant 2, with multiple payment transactions connecting the merchants and their customers. The traditional solution based on a relational database will have a separate table for each entity type –  merchant, customer account (such as credit or debit card) and payment. In order to find common customers, we need to join the three tables to build a new “answer” table. As the sizes of the tables grow, to millions of payments and hundreds of thousands to- millions of customers, answering a question as simple as “who are the common customers?” takes a long time. This becomes even more time-consuming and computationally expensive when we are looking to analyze and get insights from the data. For example, add up payments for common customers by week, by month and understand the changes over a period of time to the relationship – Is the relationship getting stronger or weaker over time? Are there specific customers who are shopping more often with these two merchants over time, while others are reducing their spend? Is there a particular pattern based on the payment time-stamps such as the customer is shopping with Merchant 1 first, followed by Merchant 2 within an hour or two?
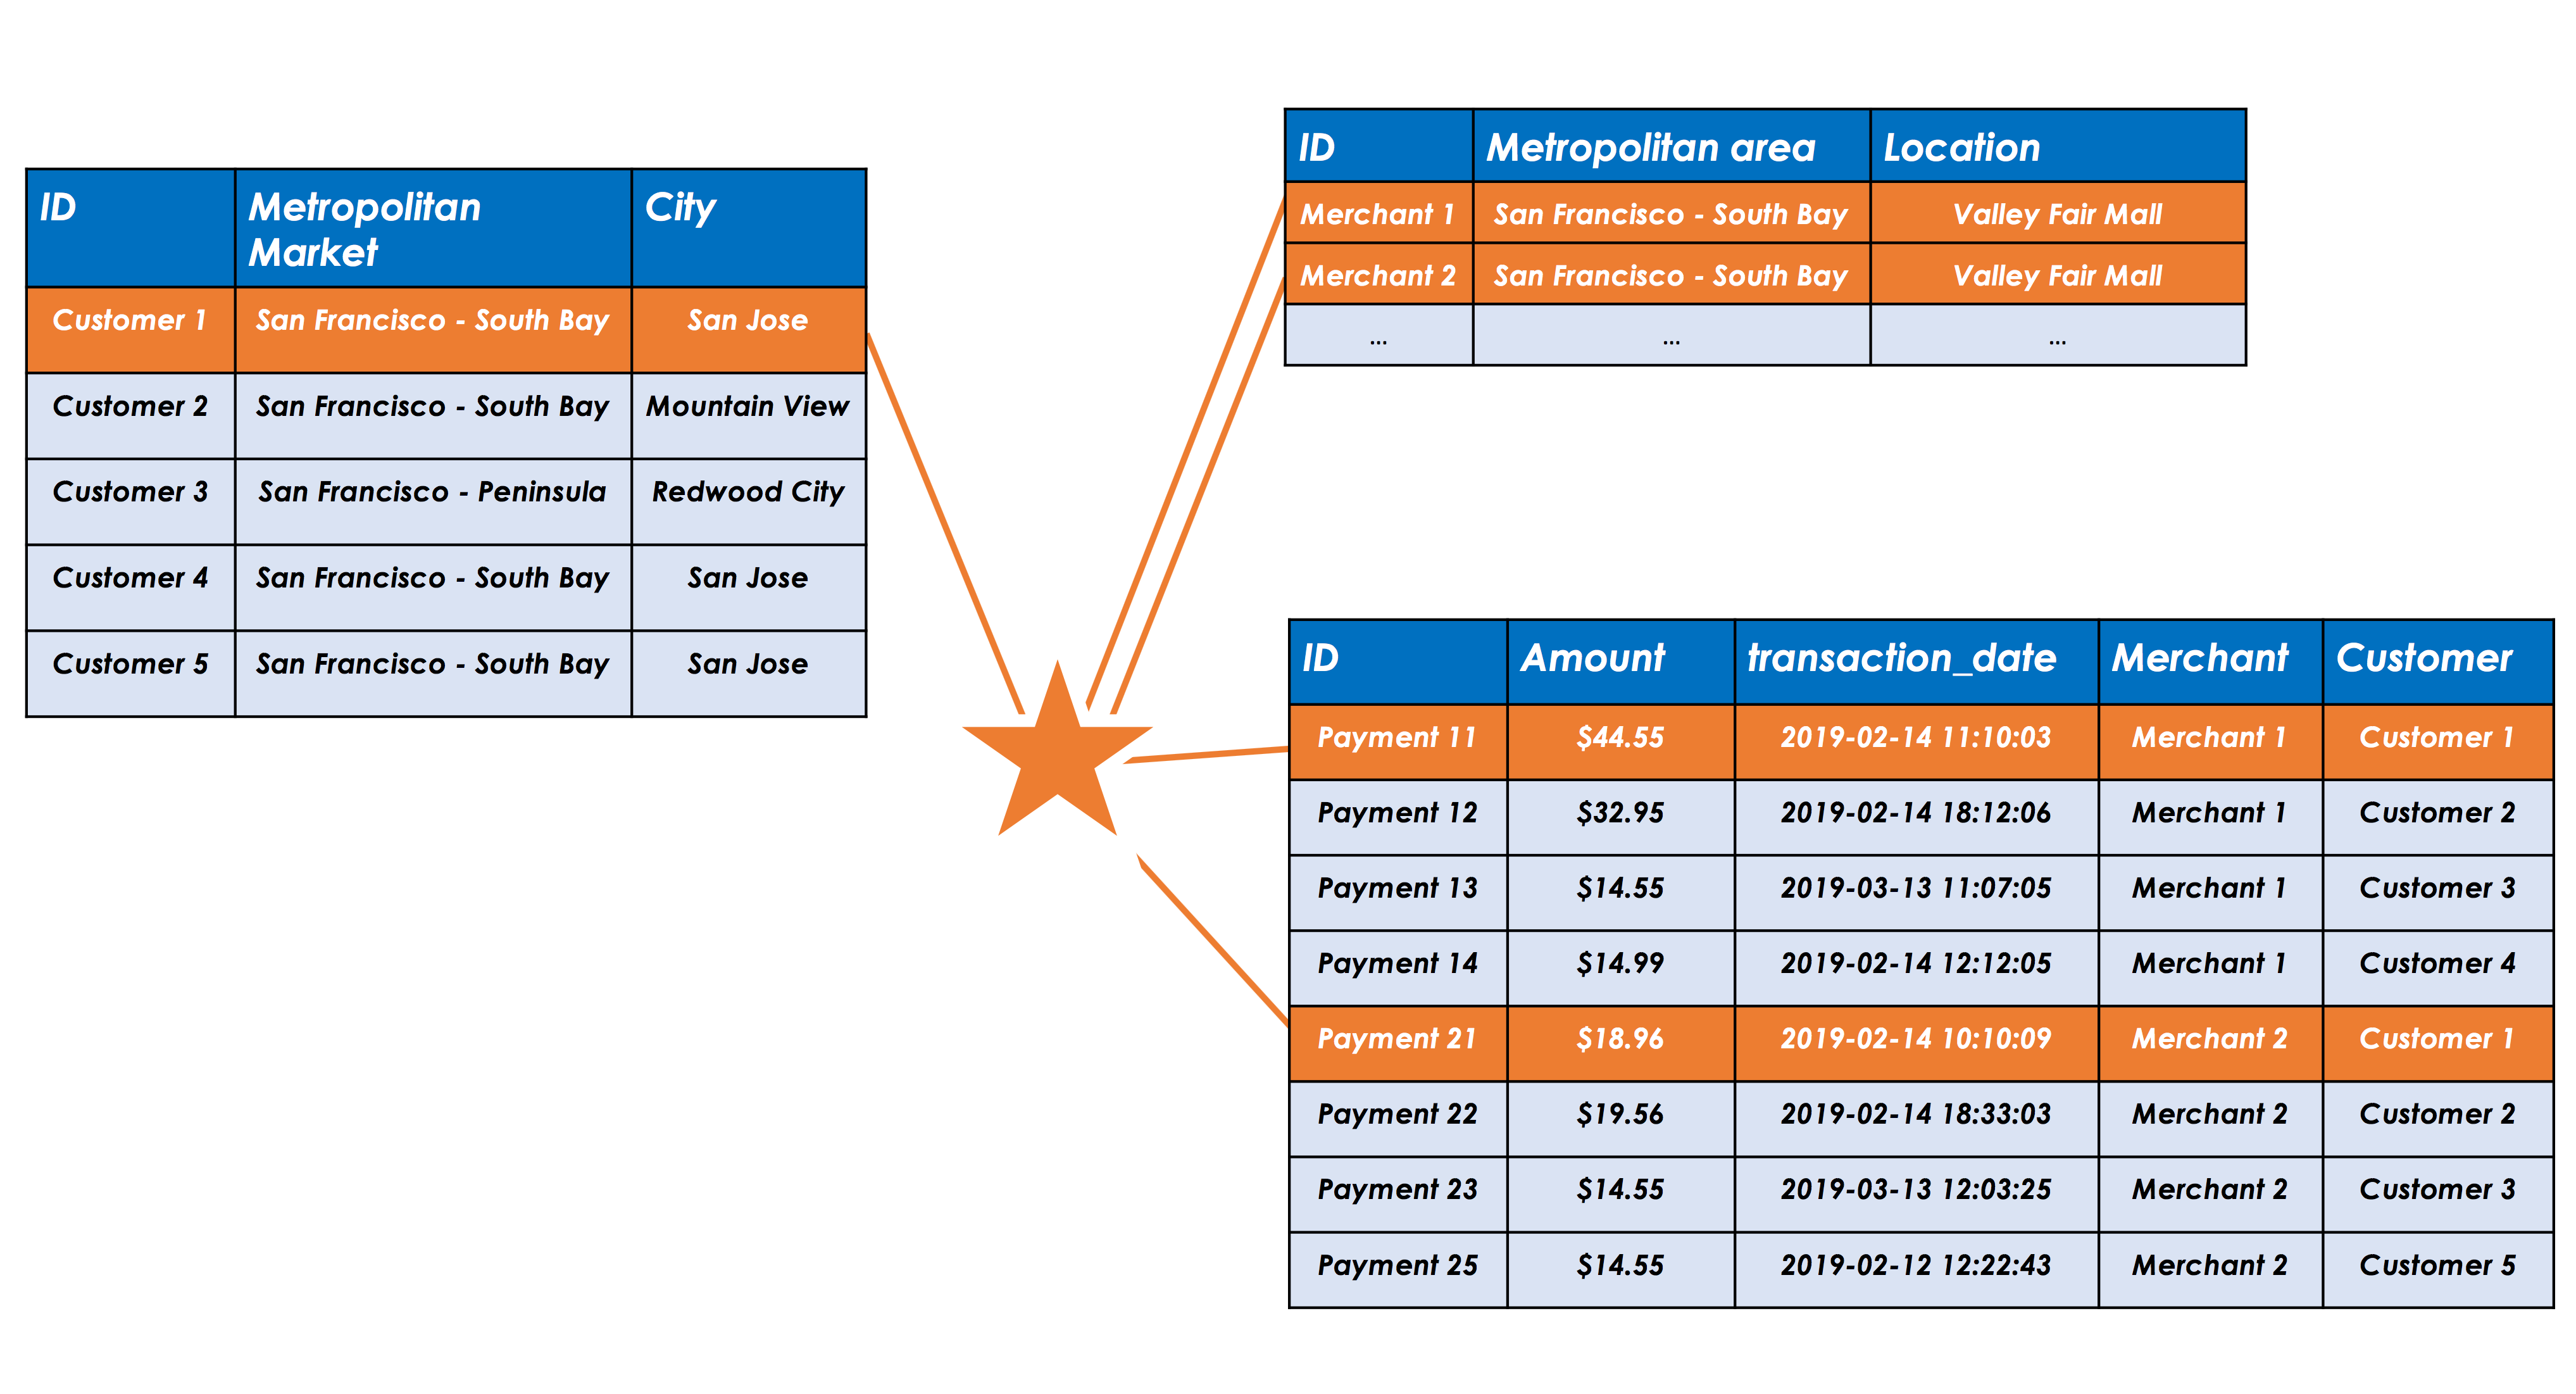
Mapping out the relationship between two merchants with TigerGraph

TigerGraph is a native graph platform, which means merchants, customer accounts, payments are represented as business entities with the relationships among them included in the data model. As you can see from the picture, it’s quite easy to visually find the common customers between the two merchants in TigerGraph’s Graphical User Interface (GUI), GraphStudio. But how do you find and export the common customers as a part of a real-time GSQL query? How do you add up the spend among common customers? This is where the accumulators come in.
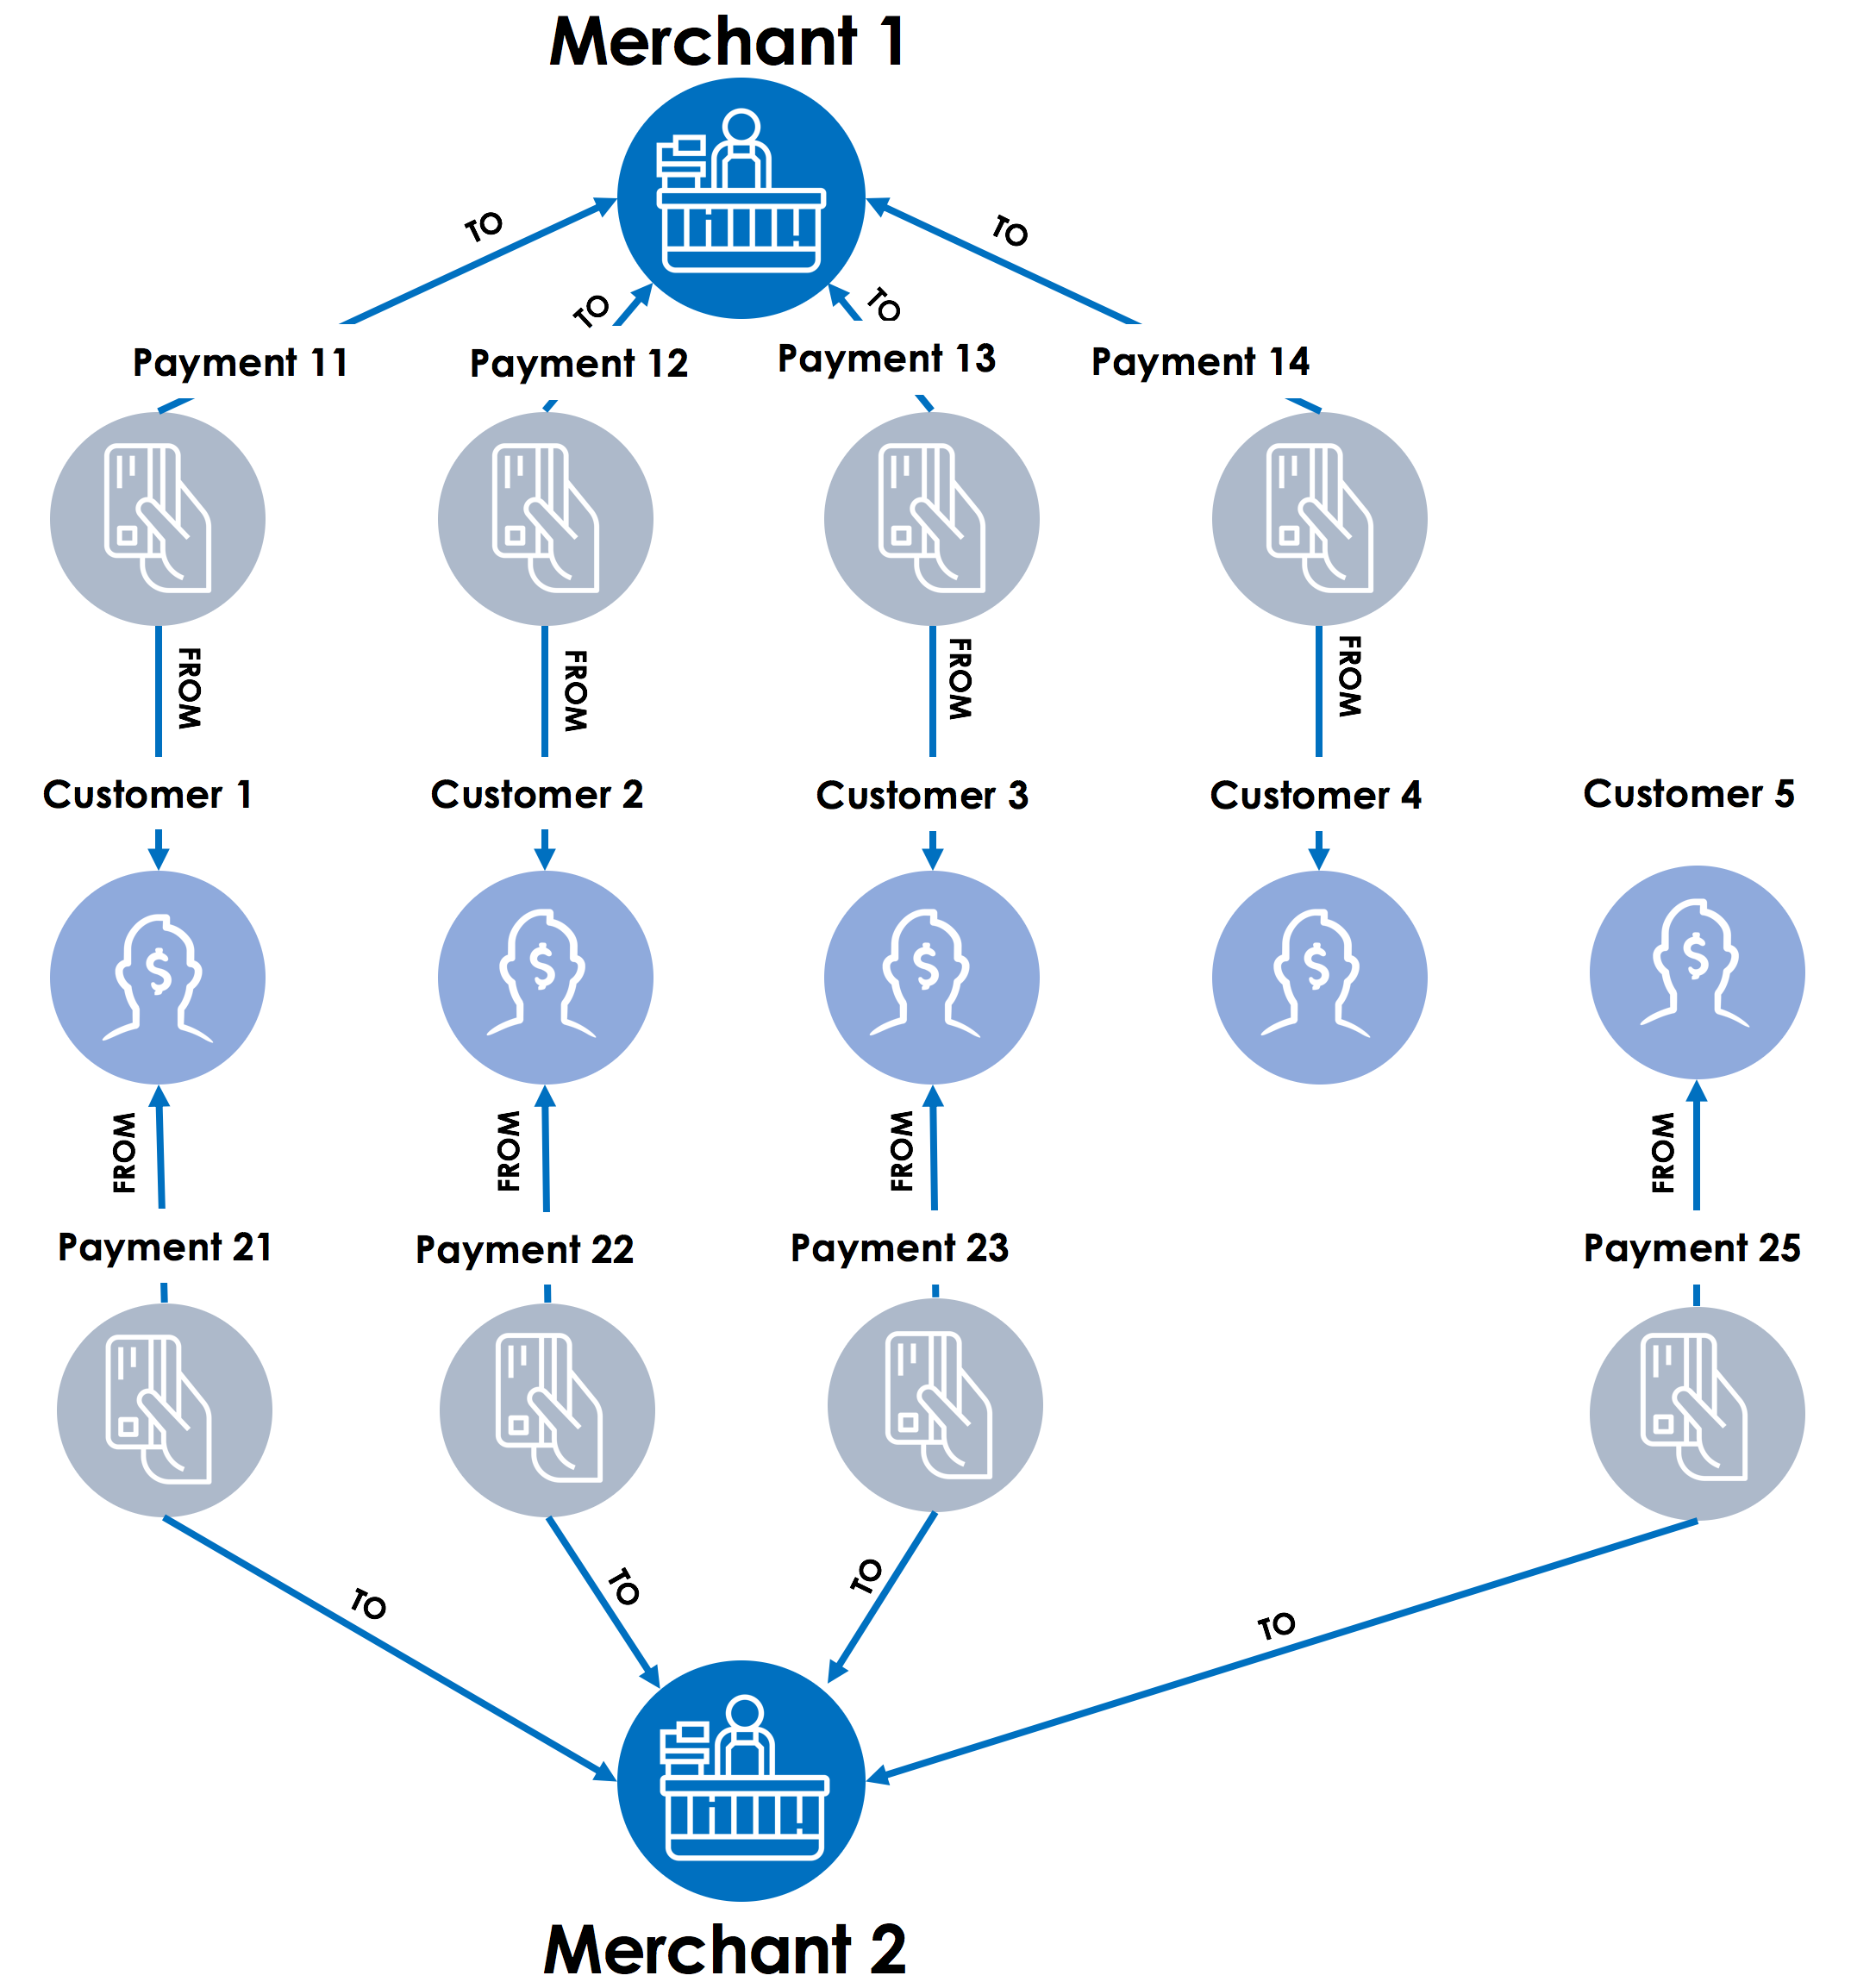
Walking or traversing the graph to find the common customers

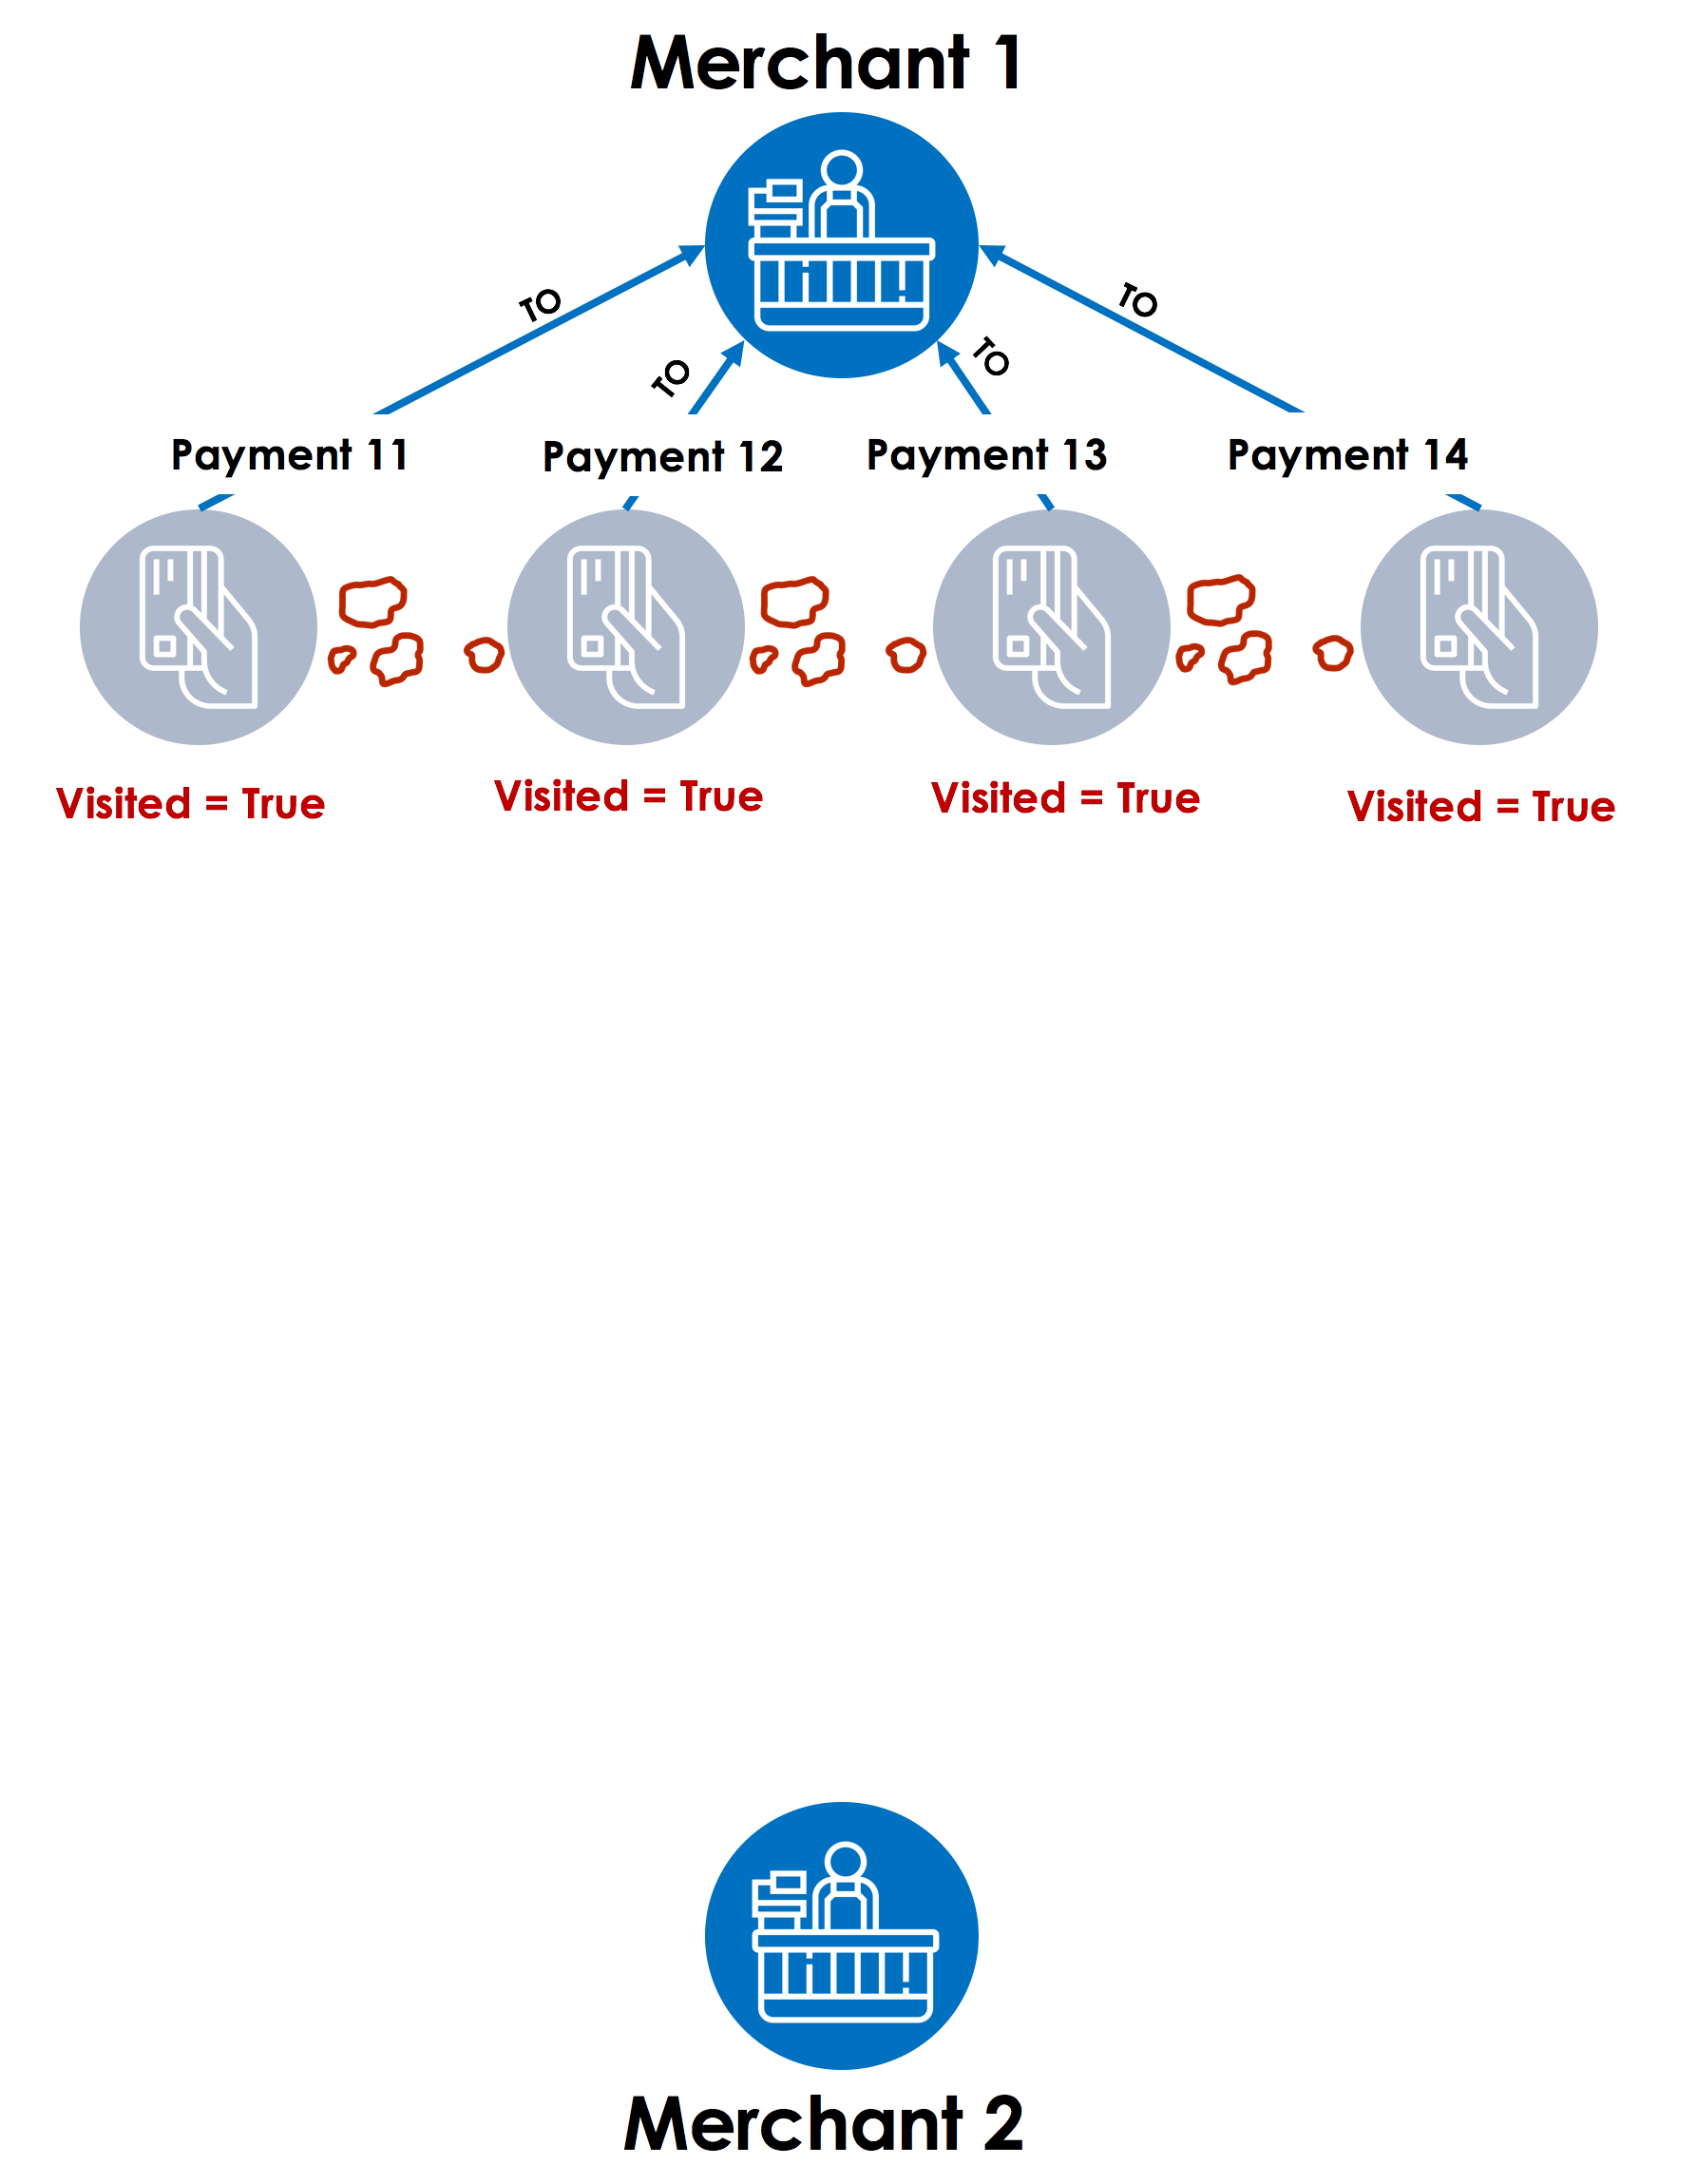
Step 1 – The graph traversal starts with Merchant 1, then travels back across the fund transfer links towards all the payments for the merchant. TigerGraph will use a flag such as “visited” on each payment to remember which payments were visited as a part of walking or traversing the graph. This flag or local variable is an accumulator in GSQL. Much like Hansel and Gretel using the white pebbles to remember the path in the forest, TigerGraph analytics engine uses the “visited” accumulator (“pebble”) to remember the payments that are already visited.
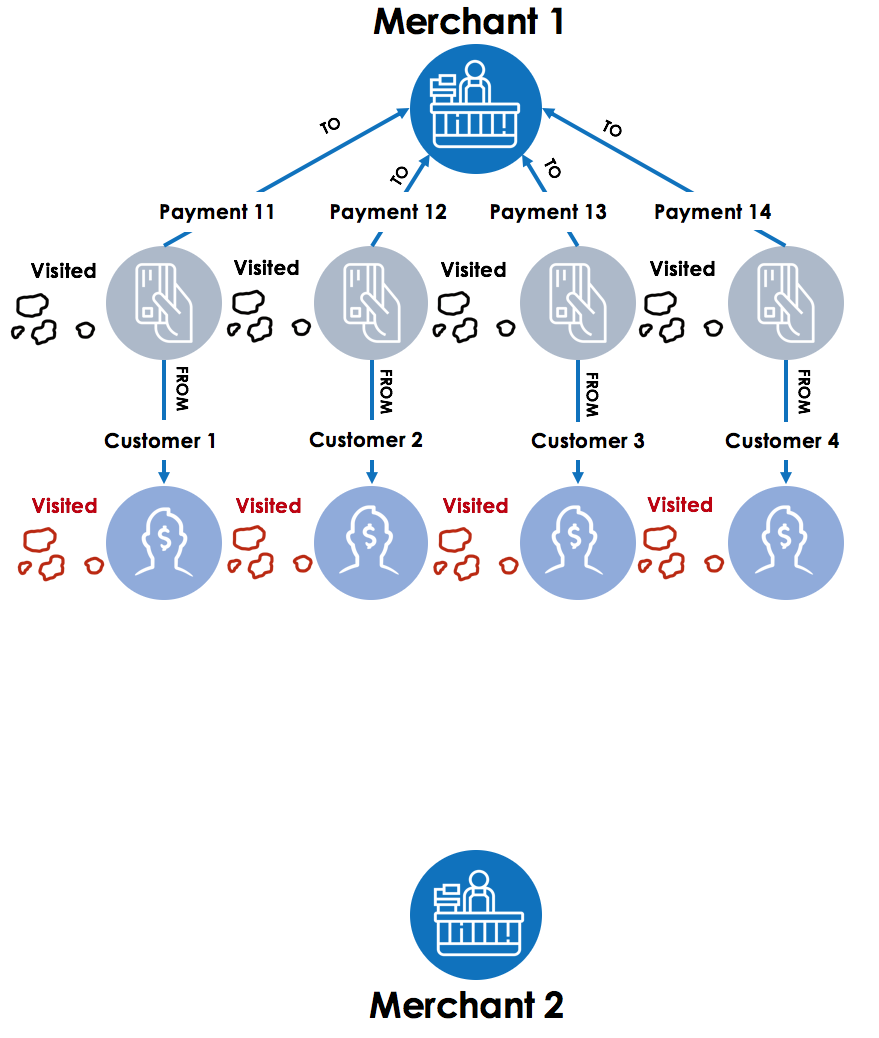
Step 2 – Next, the graph traversal engine moves to each payment in a parallel thread (with TigerGraph’s MPP – Massively Parallel Processing architecture) and looks at the customer accounts linked with those payments.  After finding the customer accounts (Customer 1, 2, 3 and 4), the “visited” accumulator value is marked as “True” for those accounts.
Step 3 –  Next step for the graph traversal starts from Merchant 2,  looking at all the payments for the merchant. After finding all the payments linked to Merchant 2 (Payment 21, 22, 23 and 25), the “visited” accumulator value is marked as “True” for those payments, effectively marking the tree (vertex) in the forest (graph) with the pebble (accumulator).
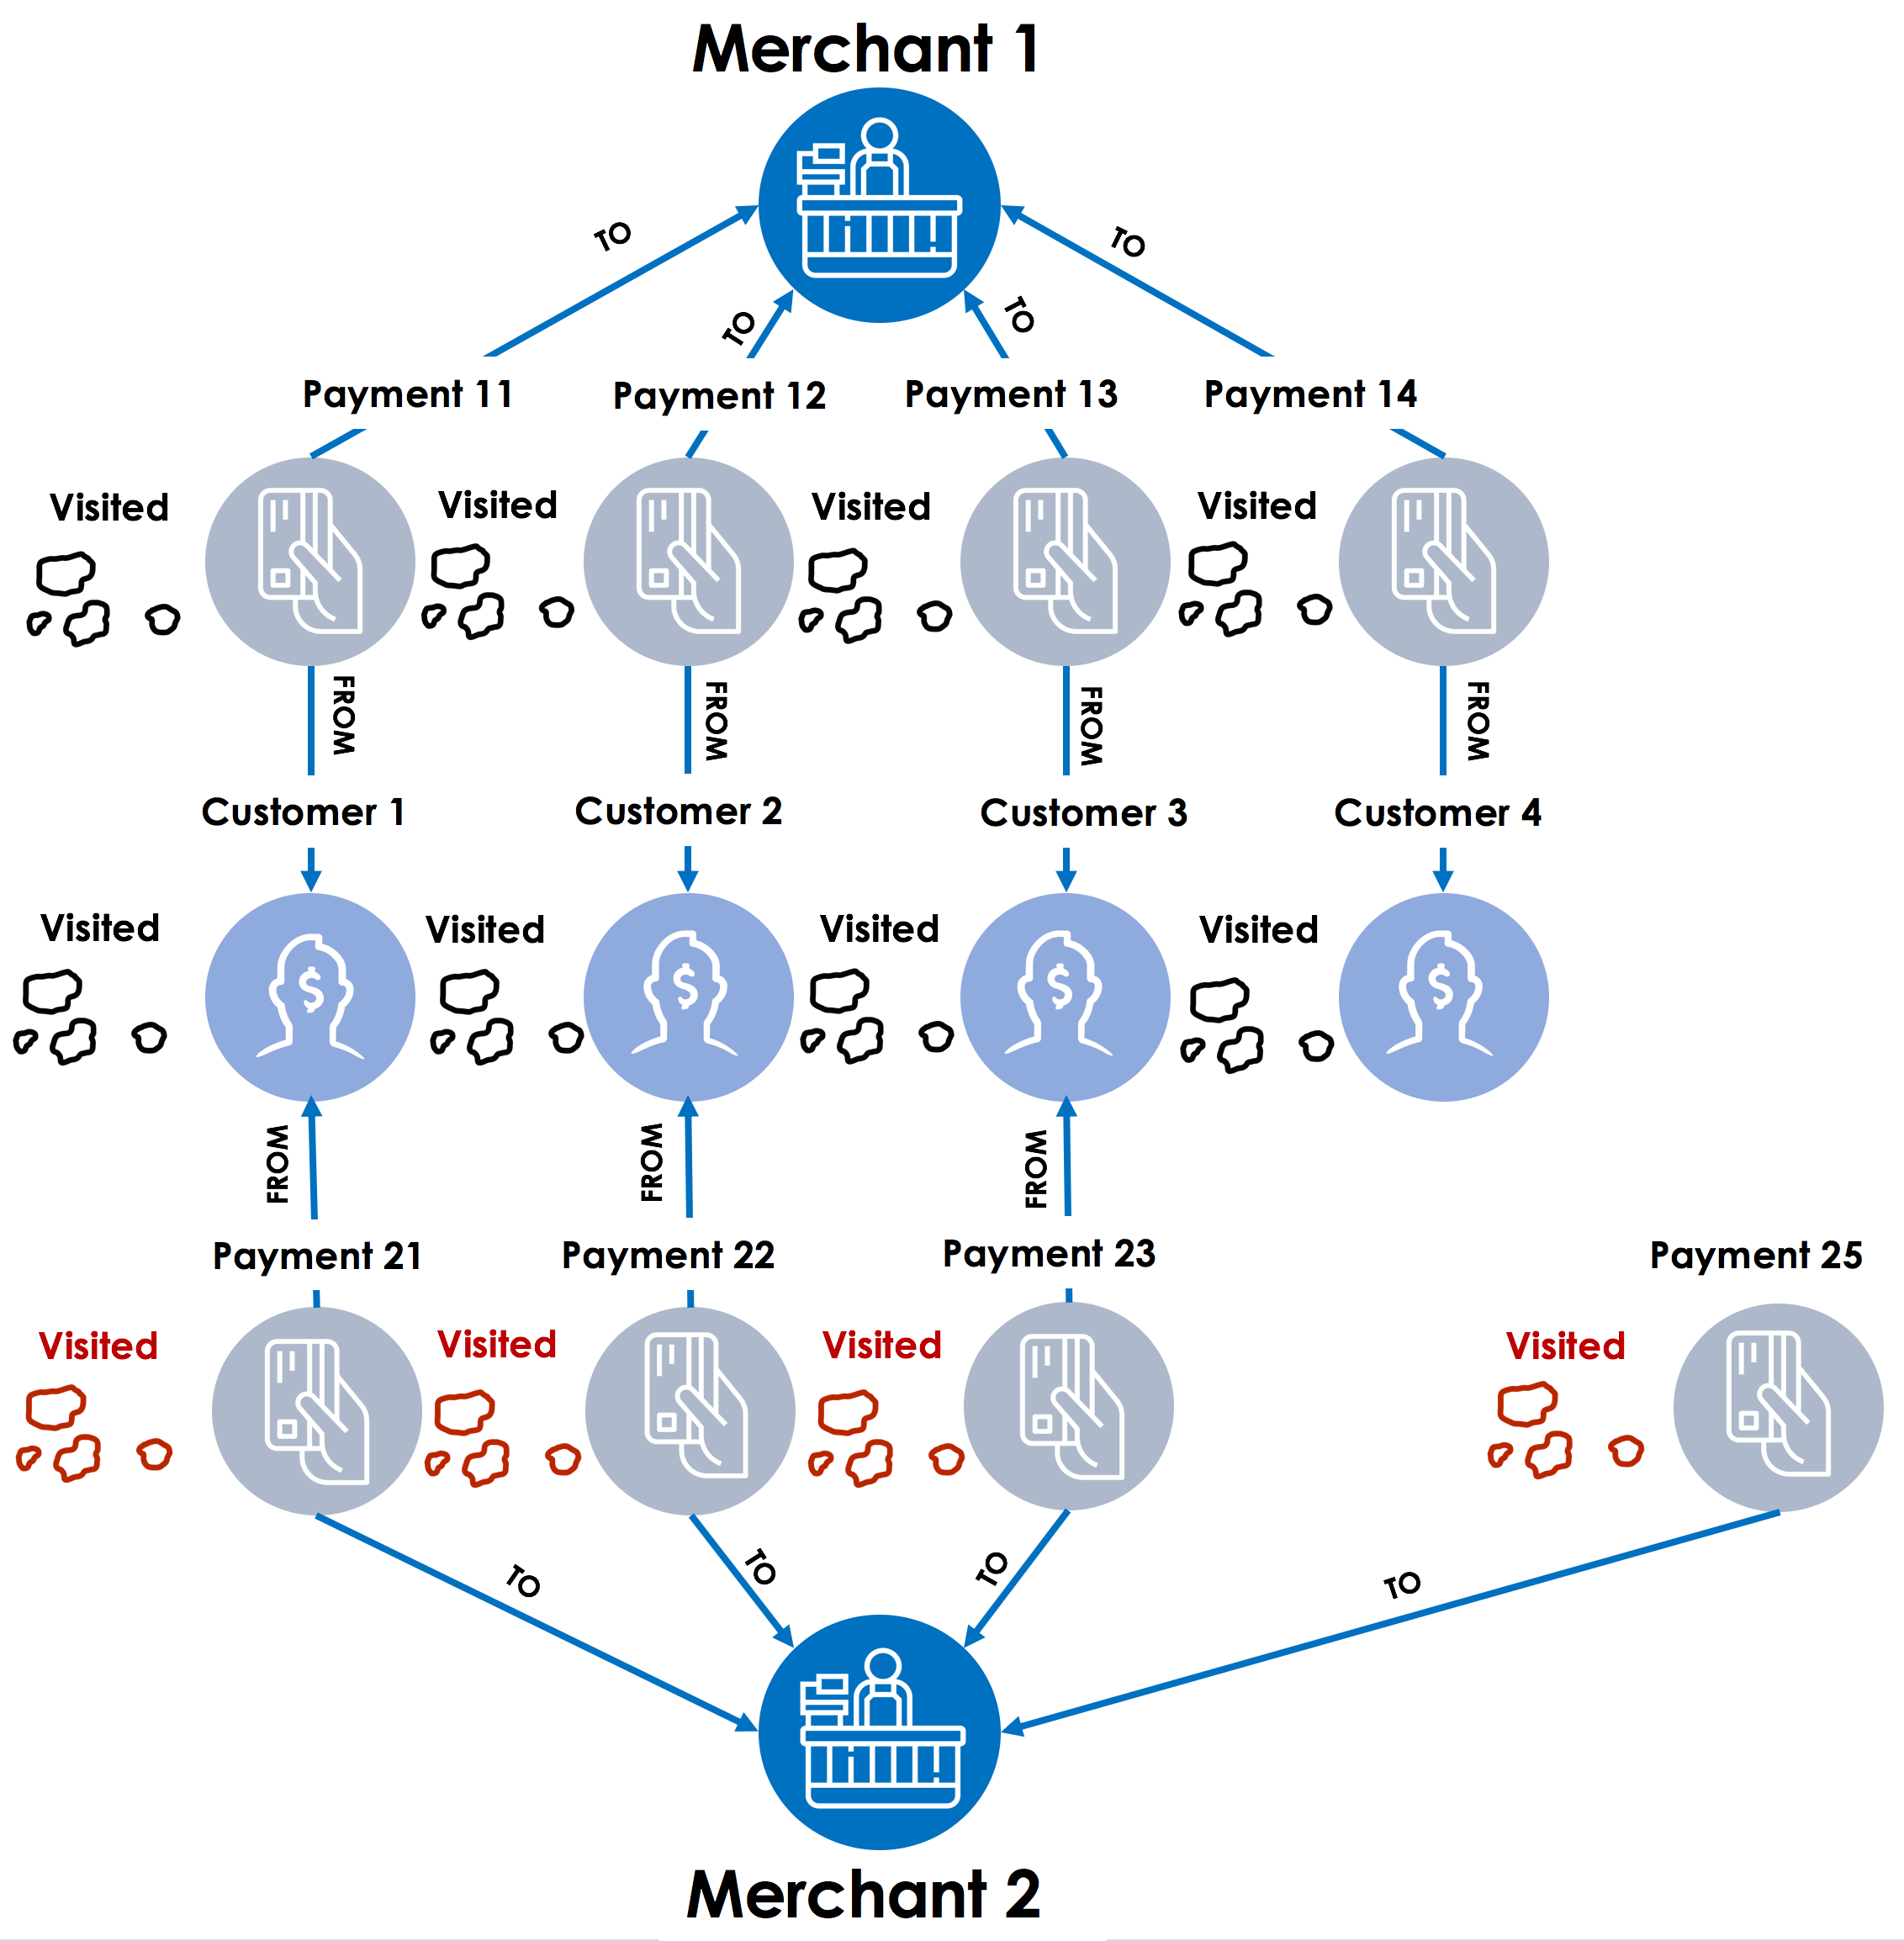
Step 4 – In the final step, graph traversal starts with all payments linked to merchant 2 and then look for customer vertices where the accumulator visited is set to true. These are the common customers between Merchant 1 and Merchant 2.
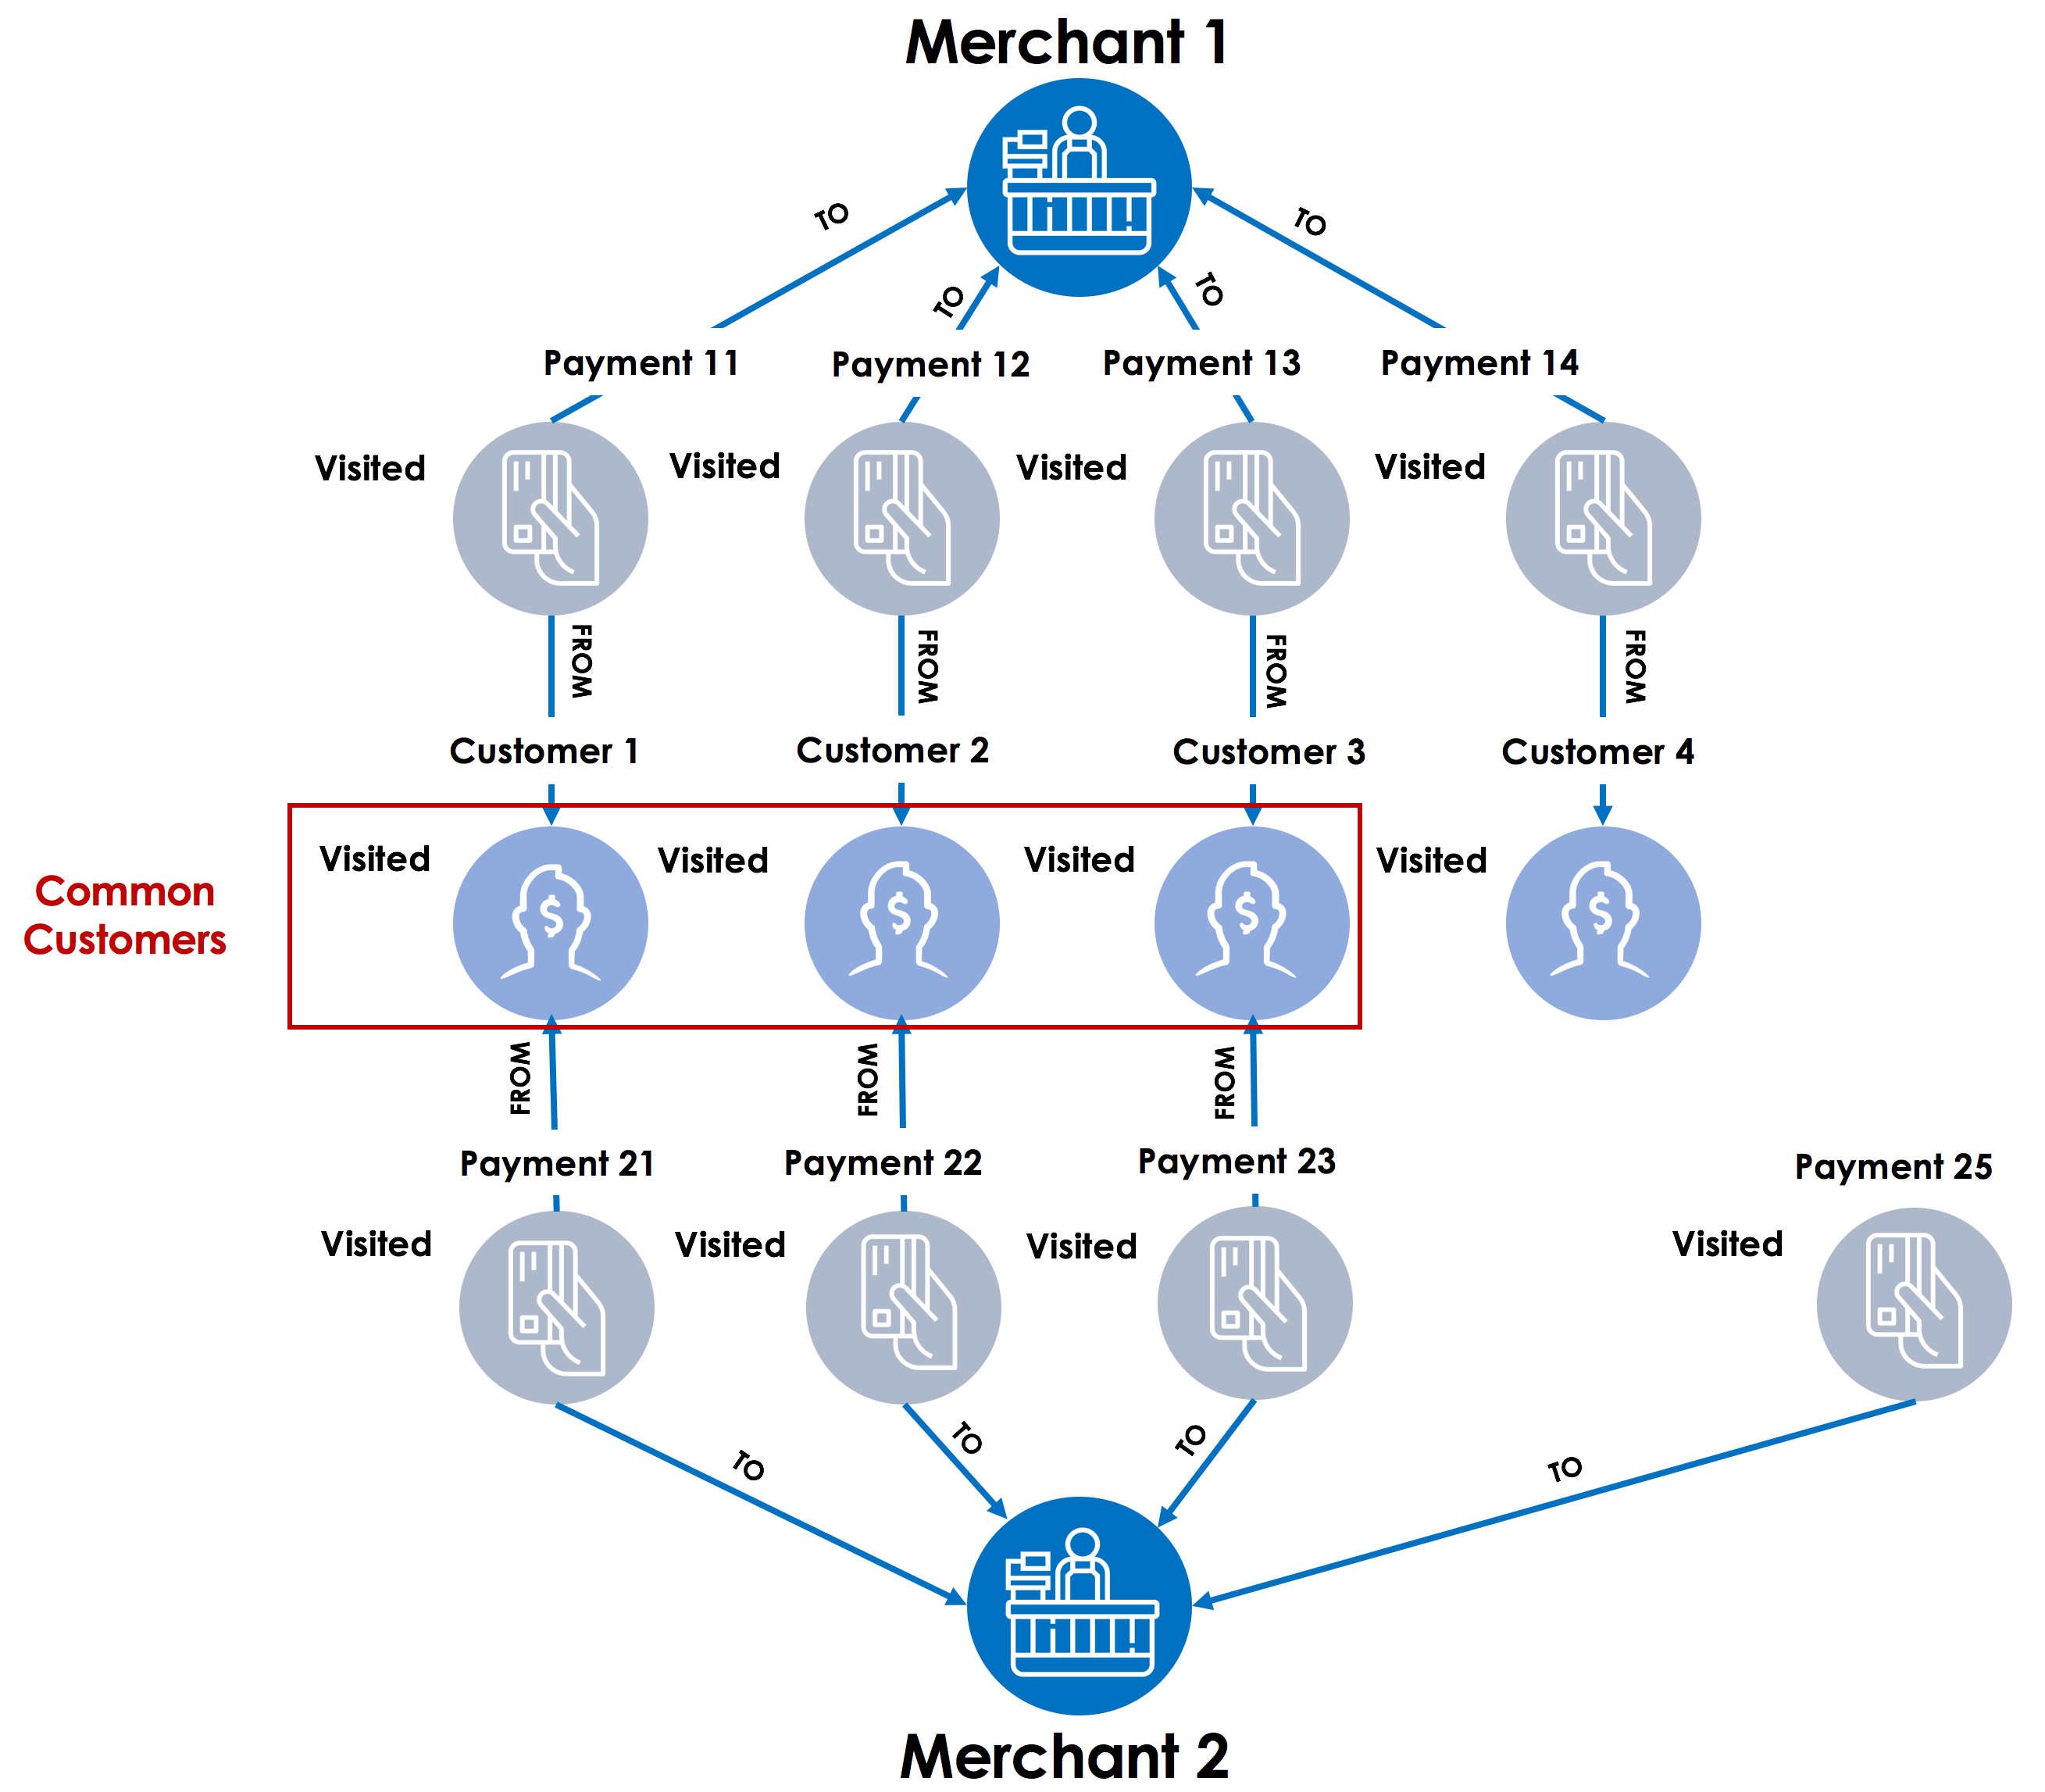
Magical pebbles aka accumulators in GSQL

Accumulators in GSQL do a lot more than just remember the path taken while traversing the graph or serve as markers while the graph algorithms traverse the topology. There are global accumulators that can be used to collect business entities (e.g. payments, customers, merchants) and edges or relationships among entities (e.g. payment from a customer or payment to a merchant) that meet certain criteria.

In this example, a global SetAccum accumulator can be used to collect business entities or vertices as well as relationships or edges and provide that collection to the TigerGraph GraphStudio or an external visualization engine so that the users can see the subgraph showing the relationship between Merchant 1 and Merchant 2. Starting with the three common customers, Customer 1, Customer 2 and Customer 3, one can traverse the graph to the two merchants in question, Merchant 1 and Merchant 2 in parallel, collect the payments linked to common customers, and store them in a SetAccum global accumulator called “CommonPayments”. In this case, CommonPayments will collect Payment 11, 12  and 13 for Merchant 1 and Payment 21, 22 and 23 for Merchant 2. Next, the amounts for these payments can be added up to determine the total spend by common customers between these two merchants, and even track those over a period of time to understand changes in the spending pattern over weeks, months or years.
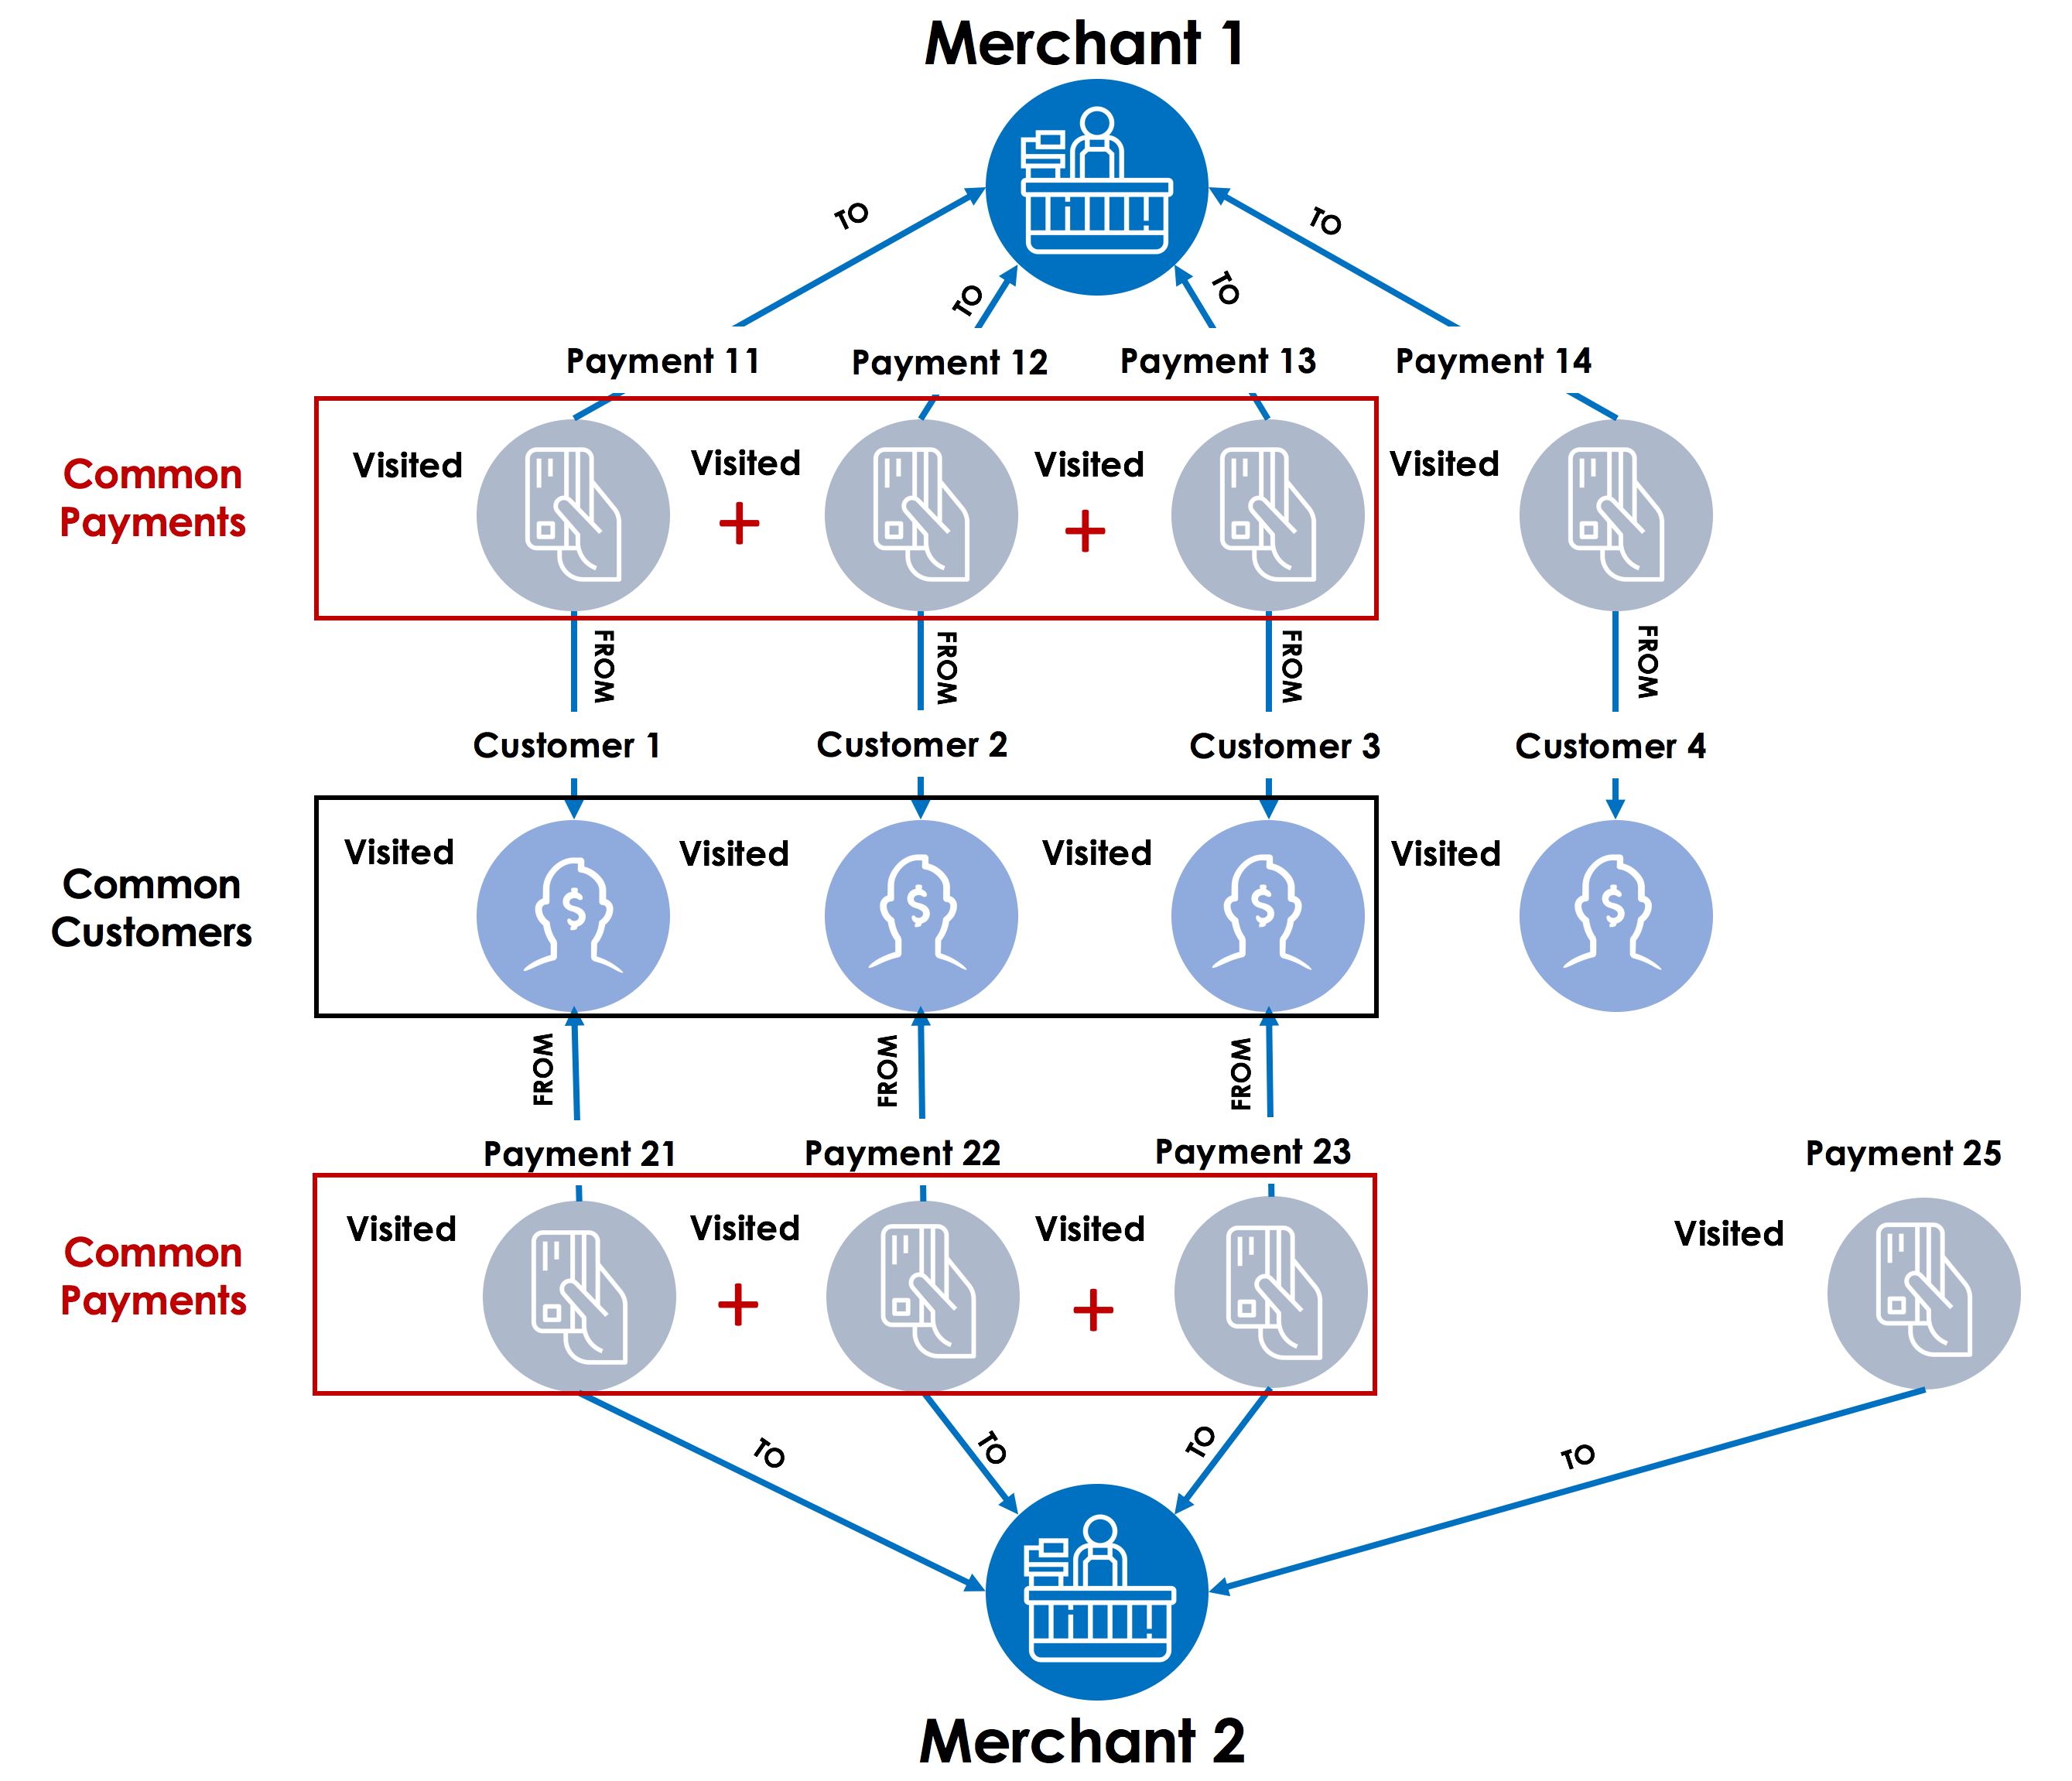
In addition to acting as local or global variables, accumulators also provide computational functions such as Min, Max, Average, and Sum and are capable of holding a single value or a collection of business entities and relationships.  You can explore the accumulators in TigerGraph Documentation.

Combining accumulators with the TigerGraph’s Massively Parallel Processing (MPP) engine

Accumulators are designed to leverage TigerGraph’s MPP engine and support parallel computation at each vertex and each edge to maximize the throughput possible with your hardware for each query.

Imagine if Hansel and Gretel (the MPP threads) replicated themselves and ran along multiple paths in the forest (graph) while using the pebbles (accumulators) to keep track of each vertex visited and also compute summary information for those vertices (such as the sum of total payments for a customer with a merchant) without tripping over each other – that’s what accumulators combined with TigerGraph MPP deliver for datasets of all sizes. The ability to traverse the graph in parallel while keeping track of each path and performing complex calculations is unique to the combination of accumulators and TigerGraph MPP.

In fact, while we showed four steps (Step 1, 2, 3 and 4) to determine common customers between two merchants, the parallel nature of the TigerGraph platform combined with accumulators allows us to execute this in just two steps with graph traversal from Merchant 1 and Merchant 2 progressing simultaneously to find the common customers. In effect, Step 1(starting from Merchant 1) and Step 3 (starting from Merchant 2) are executed simultaneously. Step 2 and Step 4 are also executed in parallel to find common customers as well as the payments for those customers faster.

The TigerGraph team is working with the Graph Query Language (GQL) initiative to add accumulators as a standard feature for the graph query language.   Experience the full performance, scalability, and elegance of TigerGraph GSQL including the accumulators and the graph analytics engine by downloading TigerGraph Developer Edition.

We also encourage you to view the Graph Gurus Episode 11 covering accumulators in-depth.

You Might Also Like

Trillion edges benchmark: new world record beyond 100TB by TigerGraph featuring AMD based Amazon EC2 instances

Trillion edges benchmark: new world record...

March 13, 2023
Graph Databases 101: Your Top 5 Questions with Non-Technical Answers

Graph Databases 101: Your Top 5...

February 7, 2023
It’s Time to Harness the Power of Graph Technology [Infographic]

It’s Time to Harness the Power...

January 25, 2023

Introducing TigerGraph 3.0

July 1, 2020

Everything to Know to Pass your TigerGraph Certification Test

June 24, 2020

Neo4j 4.0 Fabric – A Look Behind the Curtain

February 7, 2020

TigerGraph Blog

  • Categories
    • blogs
      • About TigerGraph
      • Benchmark
      • Business
      • Community
      • Compliance
      • Customer
      • Customer 360
      • Cybersecurity
      • Developers
      • Digital Twin
      • eCommerce
      • Emerging Use Cases
      • Entity Resolution
      • Finance
      • Fraud / Anti-Money Laundering
      • GQL
      • Graph Database Market
      • Graph Databases
      • GSQL
      • Healthcare
      • Machine Learning / AI
      • Podcast
      • Supply Chain
      • TigerGraph
      • TigerGraph Cloud
    • Graph AI On Demand
      • Analysts and Research
      • Customer 360 and Entity Resolution
      • Customer Spotlight
      • Development
      • Finance, Banking, Insurance
      • Keynote
      • Session
    • Video
  • Recent Posts

    • Trillion edges benchmark: new world record beyond 100TB by TigerGraph featuring AMD based Amazon EC2 instances
    • Overview of Graph and Machine Learning with TigerGraph | Mar 8 @ 11am PST
    • Gartner Data & Analytics Summit 2023, London
    • Gartner Data and Analytics Summit, Orlando
    • Transaction Surveillance with Maximum Flow Algorithm
    TigerGraph

    Product

    SOLUTIONS

    customers

    RESOURCES

    start for free

    TIGERGRAPH DB
    • Overview
    • Features
    • GSQL Query Language
    GRAPH DATA SCIENCE
    • Graph Data Science Library
    • Machine Learning Workbench
    TIGERGRAPH CLOUD
    • Overview
    • Cloud Starter Kits
    • Login
    • FAQ
    • Pricing
    • Cloud Marketplaces
    USEr TOOLS
    • GraphStudio
    • TigerGraph Insights
    • Application Workbenches
    • Connectors and Drivers
    • Starter Kits
    • openCypher Support
    SOLUTIONS
    • Why Graph?
    industry
    • Advertising, Media & Entertainment
    • Financial Services
    • Healthcare & Life Sciences
    use cases
    • Benefits
    • Product & Service Marketing
    • Entity Resolution
    • Customer 360/MDM
    • Recommendation Engine
    • Anti-Money Laundering
    • Cybersecurity Threat Detection
    • Fraud Detection
    • Risk Assessment & Monitoring
    • Energy Management
    • Network & IT Management
    • Supply Chain Analysis
    • AI & Machine Learning
    • Geospatial Analysis
    • Time Series Analysis
    success stories
    • Customer Success Stories

    Partners

    Partner program
    • Partner Benefits
    • TigerGraph Partners
    • Sign Up
    LIBRARY
    • Resources
    • Benchmark
    • Webinars
    Events
    • Trade Shows
    • Graph + AI Summit
    • Million Dollar Challenge
    EDUCATION
    • Training & Certifications
    Blog
    • TigerGraph Blog
    DEVELOPERS
    • Developers Hub
    • Community Forum
    • Documentation
    • Ecosystem

    COMPANY

    Company
    • Overview
    • Careers
    • News
    • Press Release
    • Awards
    • Legal
    • Patents
    • Security and Compliance
    • Contact
    Get Started
    • Start Free
    • Compare Editions
    • Online Demo - Test Drive
    • Request a Demo

    Product

    • Overview
    • TigerGraph 3.0
    • TIGERGRAPH DB
    • TIGERGRAPH CLOUD
    • GRAPHSTUDIO
    • TRY NOW

    customers

    • success stories

    RESOURCES

    • LIBRARY
    • Events
    • EDUCATION
    • BLOG
    • DEVELOPERS

    SOLUTIONS

    • SOLUTIONS
    • use cases
    • industry

    Partners

    • partner program

    company

    • Overview
    • news
    • Press Release
    • Awards

    start for free

    • Request Demo
    • take a test drive
    • SUPPORT
    • COMMUNITY
    • CONTACT
    • Copyright © 2023 TigerGraph
    • Privacy Policy
    • Linkedin
    • Facebook
    • Twitter

    Copyright © 2020 TigerGraph | Privacy Policy

    Copyright © 2020 TigerGraph Privacy Policy

    • SUPPORT
    • COMMUNITY
    • COMPANY
    • CONTACT
    • Linkedin
    • Facebook
    • Twitter

    Copyright © 2020 TigerGraph

    Privacy Policy

    • Products
    • Solutions
    • Customers
    • Partners
    • Resources
    • Company
    • START FREE
    START FOR FREE
    START FOR FREE
    TigerGraph
    PRODUCT
    PRODUCT
    • Overview
    • GraphStudio UI
    • Graph Data Science Library
    TIGERGRAPH DB
    • Overview
    • Features
    • GSQL Query Language
    TIGERGRAPH CLOUD
    • Overview
    • Cloud Starter Kits
    TRY TIGERGRAPH
    • Get Started for Free
    • Compare Editions
    SOLUTIONS
    SOLUTIONS
    • Why Graph?
    use cases
    • Benefits
    • Product & Service Marketing
    • Entity Resolution
    • Customer Journey/360
    • Recommendation Engine
    • Anti-Money Laundering (AML)
    • Cybersecurity Threat Detection
    • Fraud Detection
    • Risk Assessment & Monitoring
    • Energy Management
    • Network Resources Optimization
    • Supply Chain Analysis
    • AI & Machine Learning
    • Geospatial Analysis
    • Time Series Analysis
    industry
    • Advertising, Media & Entertainment
    • Financial Services
    • Healthcare & Life Sciences
    CUSTOMERS
    read all success stories


    PARTNERS
    Partner program
    • Partner Benefits
    • TigerGraph Partners
    • Sign Up
    RESOURCES
    LIBRARY
    • Resource Library
    • Benchmark
    • Webinars
    Events
    • Trade Shows
    • Graph + AI Summit
    • Graph for All - Million Dollar Challenge
    EDUCATION
    • TigerGraph Academy
    • Certification
    Blog
    • TigerGraph Blog
    DEVELOPERS
    • Developers Hub
    • Community Forum
    • Documentation
    • Ecosystem
    COMPANY
    COMPANY
    • Overview
    • Leadership
    • Careers  
    NEWS
    PRESS RELEASE
    AWARDS
    START FREE
    Start Free
    • Request a Demo
    • SUPPORT
    • COMMUNITY
    • CONTACT
    Dr. Jay Yu

    Dr. Jay Yu | VP of Product and Innovation

    Dr. Jay Yu is the VP of Product and Innovation at TigerGraph, responsible for driving product strategy and roadmap, as well as fostering innovation in graph database engine and graph solutions. He is a proven hands-on full-stack innovator, strategic thinker, leader, and evangelist for new technology and product, with 25+ years of industry experience ranging from highly scalable distributed database engine company (Teradata), B2B e-commerce services startup, to consumer-facing financial applications company (Intuit). He received his PhD from the University of Wisconsin - Madison, where he specialized in large scale parallel database systems

    Todd Blaschka | COO

    Todd Blaschka is a veteran in the enterprise software industry. He is passionate about creating entirely new segments in data, analytics and AI, with the distinction of establishing graph analytics as a Gartner Top 10 Data & Analytics trend two years in a row. By fervently focusing on critical industry and customer challenges, the companies under Todd's leadership have delivered significant quantifiable results to the largest brands in the world through channel and solution sales approach. Prior to TigerGraph, Todd led go to market and customer experience functions at Clustrix (acquired by MariaDB), Dataguise and IBM.