Skip to content
START FOR FREE
START FOR FREE
  • SUPPORT
  • COMMUNITY
Menu
  • SUPPORT
  • COMMUNITY
MENUMENU
  • Products
    • The World’s Fastest and Most Scalable Graph Platform

      LEARN MORE

      Watch a TigerGraph Demo

      TIGERGRAPH CLOUD

      • Overview
      • TigerGraph Cloud Suite
      • FAQ
      • Pricing

      USER TOOLS

      • GraphStudio
      • Insights
      • Application Workbenches
      • Connectors and Drivers
      • Starter Kits
      • openCypher Support

      TIGERGRAPH DB

      • Overview
      • GSQL Query Language
      • Compare Editions

      GRAPH DATA SCIENCE

      • Graph Data Science Library
      • Machine Learning Workbench
  • Solutions
    • The World’s Fastest and Most Scalable Graph Platform

      LEARN MORE

      Watch a TigerGraph Demo

      Solutions

      • Solutions Overview

      INCREASE REVENUE

      • Customer Journey/360
      • Product Marketing
      • Entity Resolution
      • Recommendation Engine

      MANAGE RISK

      • Fraud Detection
      • Anti-Money Laundering
      • Threat Detection
      • Risk Monitoring

      IMPROVE OPERATIONS

      • Supply Chain Analysis
      • Energy Management
      • Network Optimization

      By Industry

      • Advertising, Media & Entertainment
      • Financial Services
      • Healthcare & Life Sciences

      FOUNDATIONAL

      • AI & Machine Learning
      • Time Series Analysis
      • Geospatial Analysis
  • Customers
    • The World’s Fastest and Most Scalable Graph Platform

      LEARN MORE

      CUSTOMER SUCCESS STORIES

      • Ford
      • Intuit
      • JPMorgan Chase
      • READ MORE SUCCESS STORIES
      • Jaguar Land Rover
      • Xbox
  • Partners
    • The World’s Fastest and Most Scalable Graph Platform

      LEARN MORE

      PARTNER PROGRAM

      • Partner Benefits
      • TigerGraph Partners
      • Sign Up
      TigerGraph partners with organizations that offer complementary technology solutions and services.​
  • Resources
    • The World’s Fastest and Most Scalable Graph Platform

      LEARN MORE

      BLOG

      • TigerGraph Blog

      RESOURCES

      • Resource Library
      • Benchmarks
      • Demos
      • O'Reilly Graph + ML Book

      EVENTS & WEBINARS

      • Graph+AI Summit
      • Events &Trade Shows
      • Webinars

      DEVELOPERS

      • Documentation
      • Ecosystem
      • Developers Hub
      • Community Forum

      SUPPORT

      • Contact Support
      • Production Guidelines

      EDUCATION

      • Training & Certifications
  • Company
    • Join the World’s Fastest and Most Scalable Graph Platform

      WE ARE HIRING

      COMPANY

      • Company Overview
      • Leadership
      • Legal Terms
      • Patents
      • Security and Compliance

      CAREERS

      • Join Us
      • Open Positions

      AWARDS

      • Awards and Recognition
      • Leader in Forrester Wave
      • Gartner Research

      PRESS RELEASE

      • Read All Press Releases
      TigerGraph Reports Exceptional Customer Growth and Product Leadership as More Market-Leading Companies Tap the Power of Graph
      March 1, 2023
      Read More »

      NEWS

      • Read All News

      The Coolest Database System Companies Of The 2023 Big Data 100

      Data Breakthrough Awards 2023 Winner

  • START FREE
    • The World’s Fastest and Most Scalable Graph Platform

      GET STARTED

      • Request a Demo
      • CONTACT US
      • Try TigerGraph
      • START FREE
      • TRY AN ONLINE DEMO

Implementing a 24-Join SQL Query in a Graph Database

  • Emily McAuliffe
  • April 14, 2020
  • blog, Developers, Graph Databases
  • Blog >
  • Implementing a 24-Join SQL Query in a Graph Database

Many people are unaware that some difficult-to-write and inefficient-to-execute SQL queries can be easily expressed and efficiently executed in a graph database. This is true even for some people who already know that graph algorithms are the most efficient and sometimes the only solution for complex business use cases—such as user clustering (using the Louvain modularity algorithm), finding influential persons or entities (using the PageRank algorithm), or predicting user behaviors for personalized recommendation (using label propagation algorithms).   

In this article we describe a 24 SQL join query in the enterprise knowledge graph space and shows that it can be equivalently solved in a graph database in a way which is easy to understand, easy to maintain and more efficient in query execution. The example use case comes from a problem described in a community discussion forum: https://community.tigergraph.com/

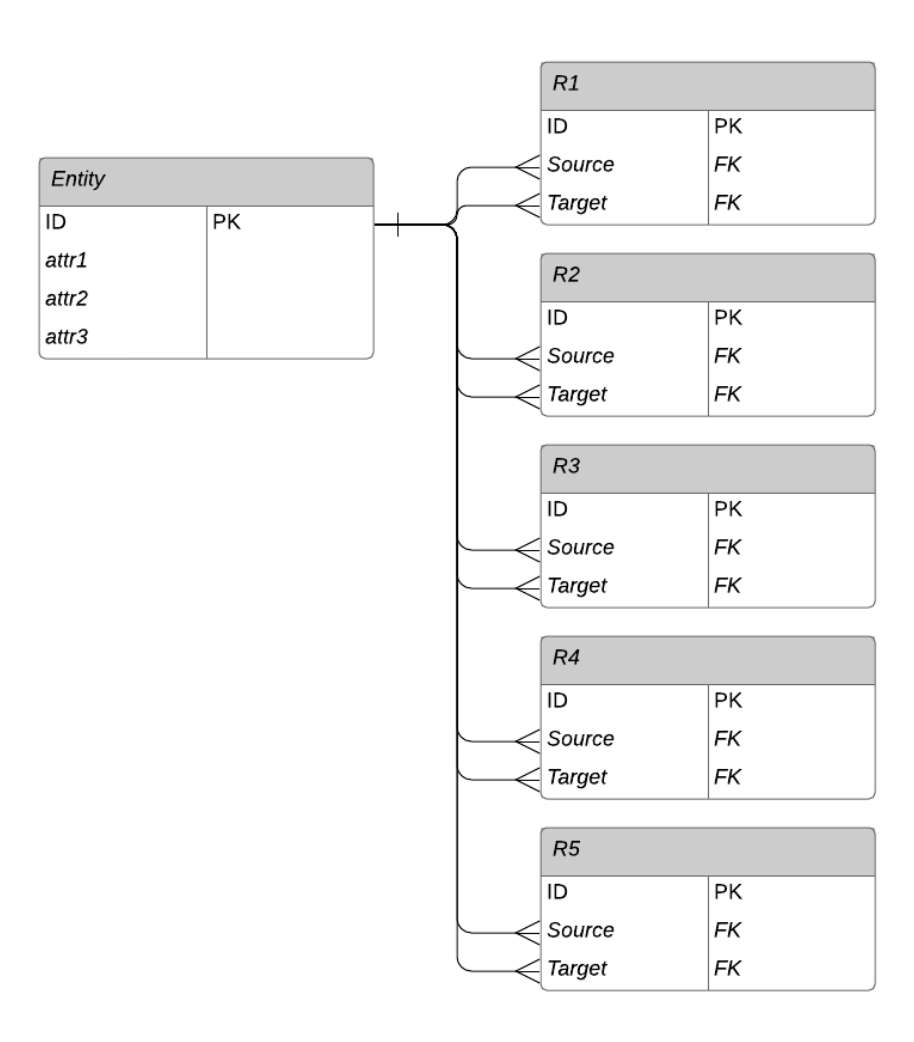
Figure 1. Relational database schema for our example

The high level description of the business question is to find entities which have at least three specified relationships to other entities, and the connected entities in turn also need to have at least 3 other specified relationships. More specifically, the problem is to find each and every distinct entity X such that: 

X has an R1 type relationship to an entity A which has

         – an R1 type relationship to any entity, AND

         – an R2 type relationship to any entity, AND

         – an R3 type relationship to any entity

AND X has an R2 type relationship to  an entity B which has

         – an R2 type relationship to any entity, AND

         – an R3 type relationship to any entity, AND

         – an R4 type relationship to any entity

AND X  has an R3 type relationship to an entity C which has

          – an R3 type relationship to any entity, AND

         – an R4 type relationship to any entity, AND

         – an R5 type relationship to any entity

Each of the 12 conditions links one entity to another. All of the entities are stored in one table, so we are repeatedly referring back to that table.  In addition, the full problem has conditions on the attribute values of the entities. If we lay out one particular solution to the query, showing individual entities rather than tables, it could look like Figure 2 below:

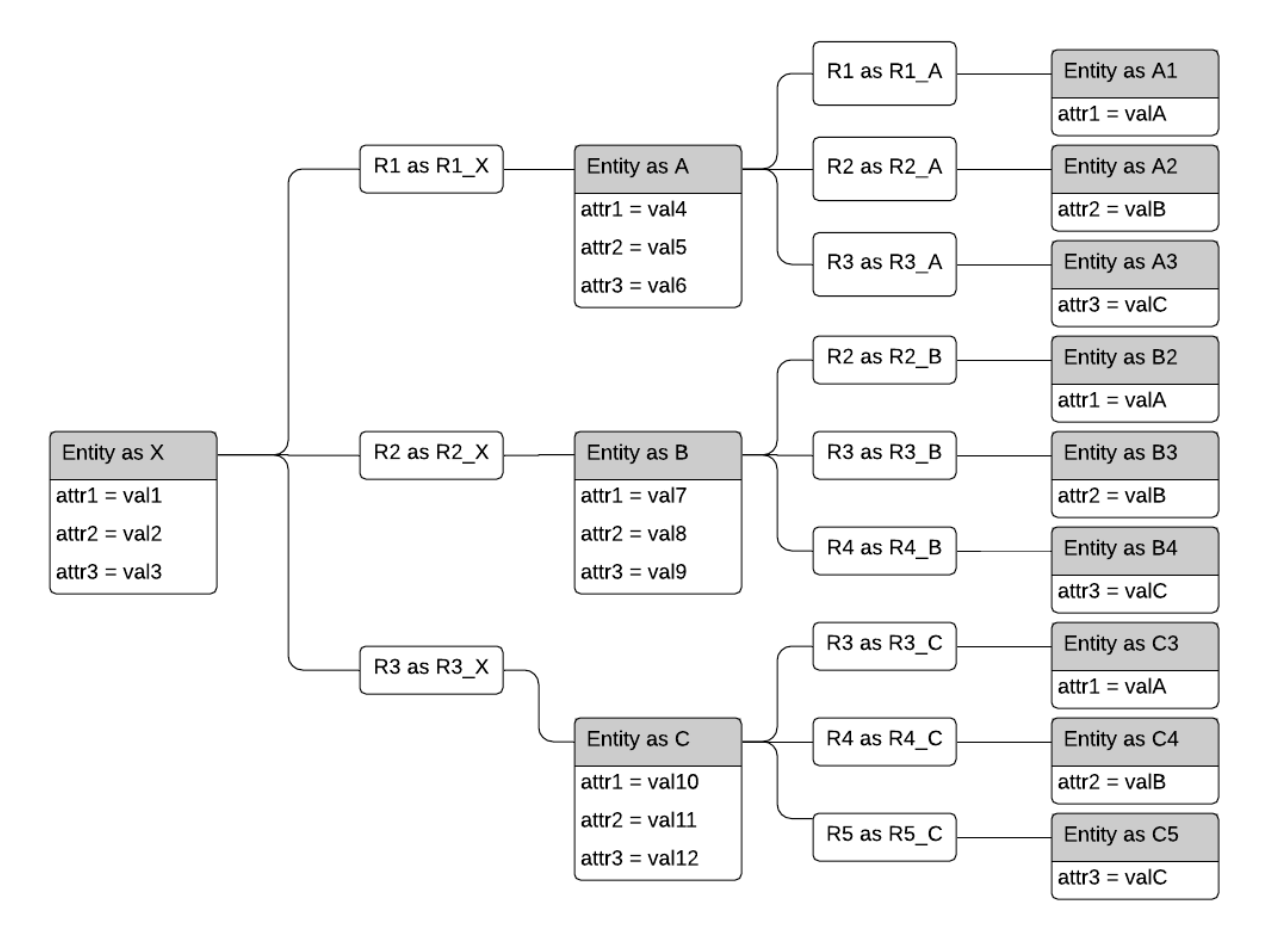
Figure 2. Symbolic representation of a solution to the query

This query is not as artificial as it may seem. Suppose the entities are bank accounts, and the relationships are fund transfers from one account to another. This sort of tree pattern could be an example of layering, a technique used by money launderers to disguise their activity. Or, it could be tracing the trickle-down effect from payments originating from entity X — an employer, a foundation, or a government agency.

This depiction is helpful for designing and understanding how to write this query in SQL, shown below:

SELECT DISTINCT Entity.id
FROM Entity AS X
JOIN R1     AS R1_X ON Entity.id = R1_X.source
JOIN Entity AS A    ON A.id      = R1_X.target
JOIN R1     AS R1_A ON A.id = R1_A.source
JOIN R2     AS R2_A ON A.id = R2_A.source
JOIN R3     AS R3_A ON A.id = R3_A.source
JOIN Entity AS A1 ON R1_A.target = A1.id
JOIN Entity AS A2 ON R2_A.target = A2.id
JOIN Entity AS A3 ON R3_A.target = A3.id

JOIN R2     AS R2_X ON Entity.id = R2_X.source
JOIN Entity AS B    ON B.id      = R2_X.target
JOIN R2     AS R2_B ON B.id = R2_B.source
JOIN R3     AS R3_B ON B.id = R3_B.source
JOIN R4     AS R4_B ON B.id = R4_B.source
JOIN Entity AS B2 ON R2_B.target = B2.id
JOIN Entity AS B3 ON R3_B.target = B3.id
JOIN Entity AS B4 ON R4_B.target = B4.id

JOIN R3     AS R3_X ON Entity.id = R3_X.source
JOIN Entity AS C    ON C.id      = R3_X.target
JOIN R3     AS R3_C ON C.id = R3_C.source
JOIN R4     AS R4_C ON C.id = R4_C.source
JOIN R5     AS R5_C ON C.id = R5_C.source
JOIN Entity AS C3 ON R3_C.target = C3.id
JOIN Entity AS C4 ON R4_C.target = C4.id
JOIN Entity AS C5 ON R5_C.target = C5.id

WHERE
      Entity.attr1 = val1 AND
      Entity.attr2 = val2 AND
      Entity.attr3 = val3 AND

      A.attr1 = val4 AND
      A.attr2 = val5 AND
      A.attr3 = val6 AND

      A1.attr1 = valA AND
      A2.attr2 = valB AND
      A3.attr3 = valC AND
   	 
      B.attr1 = val7 AND
      B.attr2 = val8 AND
      B.attr3 = val9 AND

      B2.attr1 = valA AND
      B3.attr2 = valB AND
      B4.attr3 = valC AND
 
      C.attr1 = val10 AND
      C.attr2 = val11 AND
      C.attr3 = val12 AND

      C3.attr1 = valA AND
      C4.attr2 = valB AND
      C5.attr3 = valC

Notice that, in the above SQL query, there are 12 joins on the relationship tables, 12 more joins back to (copies of) the Entity table, and then a lengthy set of conditions on the attributes of the various entities.

Problems of the SQL Solution

The 24 Join SQL solution is difficult to write, understand and maintain. In fact, we had considerable difficulty knowing which copy of a table was which, until we drew Figure 2 with the alias for each table shown. Moreover, it is well known that relational databases find it very challenging to perform more than a handful of joins in a single query. A query like this is simply not possible unless the tables are very small.

Graph Solution with Built-in Parallelism 

Now we describe how we can use a graph database with built-in parallelism in its graph query language, such as TigerGraph and its query language GSQL, to easily and efficiently solve this type of problem.

We first redraw the schema and the solution expansion as a graph. In a graph, each Entity record becomes a vertex, drawn as a circle, and each Relationship record becomes an edge, drawn simply as a line connecting two Entities. Edges can have properties too, such as time or location or strength, but this particular example doesn’t have edge properties. While the schema looks different, the solution expansion is simply a streamlined version of the relational solution expansion.

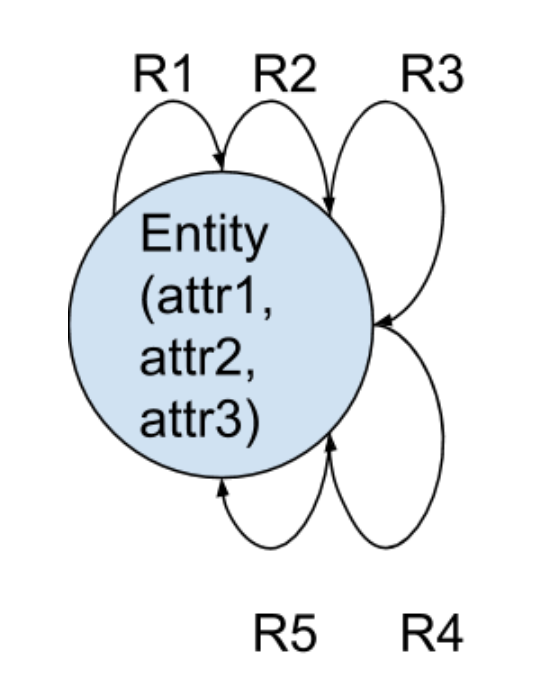
Figure 3. Graph schema for this example

The graph schema diagram may look unusual to you if you are not familiar with graphs. It is saying there is one type of Entity, which has 3 attributes (attr1, attr2, and attr3).  In addition, there are five types of relationships — R1 through R5 — each of which connects an Entity to another Entity, with an explicit sense of direction.

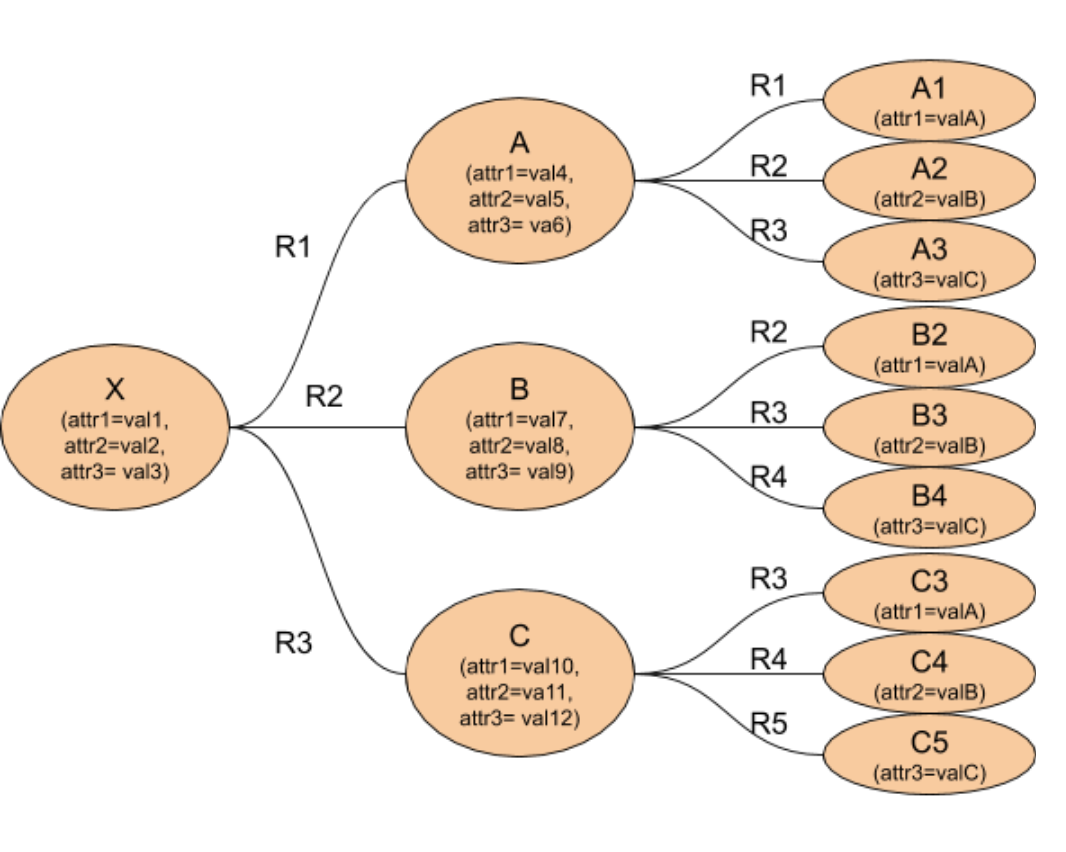
Figure 4. Graph depiction of the query.

There are different approaches to solve this problem due to the power and flexibility of GSQL.  The following shows one way of solving the program.

Entities = {Entity.*};

/* Compute qualified A entities based on attribute conditions and downstream relationships */
A =
select m from Entities:m-(R1)-:t 
where m.attr1 == val4 and m.attr2 == val5 and m.attr3 == val6
and t.attr1 == valA;

A=select m from A:m-(R2)-:t where t.attr2== valB ;
A=select m from A:m-(R3)-:t where t.attr3 == valC ;


/* Compute qualified B entities based on attribute conditions and downstream relationships*/
B =select m from Entities:m-(R2)-:t 
where m.attr1 == val7 and m.attr2 == val8 and m.attr3 == val9 and t.attr1 == valA;

B=select m from B:m-(R3)-:t where t.attr2 == valB
B=select m from B:m-(R4)-:t where t.attr3 == valC; 


/* Compute qualified C entities based on attribute conditions and downstream relationships*/
C = select m from Entities:m-(R3)-:t where m.attr1 == val10 and m.attr2 == val11 and m.attr3 == val12 and t.attr1 == valA;

C=select m from C:m-(R4)-:t where t.attr2 == valB;
C=select m from C:m-(R5)-:t where t.attr3 == valC; 

/* Compute qualified X entities based on attribute conditions and relationships to A, B, and C */
X1 = select t from A:s-(R1)-t 
     where t.attr1 == val1 and t.attr2 == val2 and t.attr3 == val3; 
  
X2 = select t from B:s-(R2)-t; 
X3 = select t from C:s-(R3)-t;

Result = X1 intersect X2 intersect X3;

print Result;
Graph Solution Advantages

Clearly the graph solution is much easier to write, read, understand and maintain than the huge single 24 join SQL query. The graph solution can also be easily extended to go beyond the current ‘two level’ checking on the join structure without losing performance and readability.

Learn More

One of the best ways to get started with graph analytics is with TigerGraph Cloud. It’s free and you can create an account in a few minutes. Sign up here. 

Download these buyer’s guides if you would like to compare the performance of different graph databases: TigerGraph vs Neo4j and TigerGraph vs Amazon Neptune.

You can also learn more about TigerGraph by joining our community: https://community.tigergraph.com/. We look forward to hearing from you.


You Might Also Like

How to Achieve a True 360-Degree Customer View with TigerGraph

How to Achieve a True 360-Degree...

April 10, 2023
Trillion edges benchmark: new world record beyond 100TB by TigerGraph featuring AMD based Amazon EC2 instances

Trillion edges benchmark: new world record...

March 13, 2023
Graph Databases 101: Your Top 5 Questions with Non-Technical Answers

Graph Databases 101: Your Top 5...

February 7, 2023

Introducing TigerGraph 3.0

July 1, 2020

Everything to Know to Pass your TigerGraph Certification Test

June 24, 2020

Neo4j 4.0 Fabric – A Look Behind the Curtain

February 7, 2020

TigerGraph Blog

  • Categories
    • blogs
      • About TigerGraph
      • Benchmark
      • Business
      • Community
      • Compliance
      • Customer
      • Customer 360
      • Cybersecurity
      • Developers
      • Digital Twin
      • eCommerce
      • Emerging Use Cases
      • Entity Resolution
      • Finance
      • Fraud / Anti-Money Laundering
      • GQL
      • Graph Database Market
      • Graph Databases
      • GSQL
      • Healthcare
      • Machine Learning / AI
      • Podcast
      • Supply Chain
      • TigerGraph
      • TigerGraph Cloud
    • Graph AI On Demand
      • Analysts and Research
      • Customer 360 and Entity Resolution
      • Customer Spotlight
      • Development
      • Finance, Banking, Insurance
      • Keynote
      • Session
    • Video
  • Recent Posts

    • Build Your First Fraud Solution Using Graph Analytics | 31 May 2023 @ 8 am PST
    • NICE Actimize Engage, London
    • The Knowledge Graph Conference
    • How to Achieve a True 360-Degree Customer View with TigerGraph
    • Trillion edges benchmark: new world record beyond 100TB by TigerGraph featuring AMD based Amazon EC2 instances
    TigerGraph

    Product

    SOLUTIONS

    customers

    RESOURCES

    start for free

    TIGERGRAPH DB
    • Overview
    • Features
    • GSQL Query Language
    GRAPH DATA SCIENCE
    • Graph Data Science Library
    • Machine Learning Workbench
    TIGERGRAPH CLOUD
    • Overview
    • Cloud Starter Kits
    • Login
    • FAQ
    • Pricing
    • Cloud Marketplaces
    USEr TOOLS
    • GraphStudio
    • TigerGraph Insights
    • Application Workbenches
    • Connectors and Drivers
    • Starter Kits
    • openCypher Support
    SOLUTIONS
    • Why Graph?
    industry
    • Advertising, Media & Entertainment
    • Financial Services
    • Healthcare & Life Sciences
    use cases
    • Benefits
    • Product & Service Marketing
    • Entity Resolution
    • Customer 360/MDM
    • Recommendation Engine
    • Anti-Money Laundering
    • Cybersecurity Threat Detection
    • Fraud Detection
    • Risk Assessment & Monitoring
    • Energy Management
    • Network & IT Management
    • Supply Chain Analysis
    • AI & Machine Learning
    • Geospatial Analysis
    • Time Series Analysis
    success stories
    • Customer Success Stories

    Partners

    Partner program
    • Partner Benefits
    • TigerGraph Partners
    • Sign Up
    LIBRARY
    • Resources
    • Benchmark
    • Webinars
    Events
    • Trade Shows
    • Graph + AI Summit
    • Million Dollar Challenge
    EDUCATION
    • Training & Certifications
    Blog
    • TigerGraph Blog
    DEVELOPERS
    • Developers Hub
    • Community Forum
    • Documentation
    • Ecosystem

    COMPANY

    Company
    • Overview
    • Careers
    • News
    • Press Release
    • Awards
    • Legal
    • Patents
    • Security and Compliance
    • Contact
    Get Started
    • Start Free
    • Compare Editions
    • Online Demo - Test Drive
    • Request a Demo

    Product

    • Overview
    • TigerGraph 3.0
    • TIGERGRAPH DB
    • TIGERGRAPH CLOUD
    • GRAPHSTUDIO
    • TRY NOW

    customers

    • success stories

    RESOURCES

    • LIBRARY
    • Events
    • EDUCATION
    • BLOG
    • DEVELOPERS

    SOLUTIONS

    • SOLUTIONS
    • use cases
    • industry

    Partners

    • partner program

    company

    • Overview
    • news
    • Press Release
    • Awards

    start for free

    • Request Demo
    • take a test drive
    • SUPPORT
    • COMMUNITY
    • CONTACT
    • Copyright © 2023 TigerGraph
    • Privacy Policy
    • Linkedin
    • Facebook
    • Twitter

    Copyright © 2020 TigerGraph | Privacy Policy

    Copyright © 2020 TigerGraph Privacy Policy

    • SUPPORT
    • COMMUNITY
    • COMPANY
    • CONTACT
    • Linkedin
    • Facebook
    • Twitter

    Copyright © 2020 TigerGraph

    Privacy Policy

    • Products
    • Solutions
    • Customers
    • Partners
    • Resources
    • Company
    • START FREE
    START FOR FREE
    START FOR FREE
    TigerGraph
    PRODUCT
    PRODUCT
    • Overview
    • GraphStudio UI
    • Graph Data Science Library
    TIGERGRAPH DB
    • Overview
    • Features
    • GSQL Query Language
    TIGERGRAPH CLOUD
    • Overview
    • Cloud Starter Kits
    TRY TIGERGRAPH
    • Get Started for Free
    • Compare Editions
    SOLUTIONS
    SOLUTIONS
    • Why Graph?
    use cases
    • Benefits
    • Product & Service Marketing
    • Entity Resolution
    • Customer Journey/360
    • Recommendation Engine
    • Anti-Money Laundering (AML)
    • Cybersecurity Threat Detection
    • Fraud Detection
    • Risk Assessment & Monitoring
    • Energy Management
    • Network Resources Optimization
    • Supply Chain Analysis
    • AI & Machine Learning
    • Geospatial Analysis
    • Time Series Analysis
    industry
    • Advertising, Media & Entertainment
    • Financial Services
    • Healthcare & Life Sciences
    CUSTOMERS
    read all success stories


    PARTNERS
    Partner program
    • Partner Benefits
    • TigerGraph Partners
    • Sign Up
    RESOURCES
    LIBRARY
    • Resource Library
    • Benchmark
    • Webinars
    Events
    • Trade Shows
    • Graph + AI Summit
    • Graph for All - Million Dollar Challenge
    EDUCATION
    • TigerGraph Academy
    • Certification
    Blog
    • TigerGraph Blog
    DEVELOPERS
    • Developers Hub
    • Community Forum
    • Documentation
    • Ecosystem
    COMPANY
    COMPANY
    • Overview
    • Leadership
    • Careers  
    NEWS
    PRESS RELEASE
    AWARDS
    START FREE
    Start Free
    • Request a Demo
    • SUPPORT
    • COMMUNITY
    • CONTACT
    Dr. Jay Yu

    Dr. Jay Yu | VP of Product and Innovation

    Dr. Jay Yu is the VP of Product and Innovation at TigerGraph, responsible for driving product strategy and roadmap, as well as fostering innovation in graph database engine and graph solutions. He is a proven hands-on full-stack innovator, strategic thinker, leader, and evangelist for new technology and product, with 25+ years of industry experience ranging from highly scalable distributed database engine company (Teradata), B2B e-commerce services startup, to consumer-facing financial applications company (Intuit). He received his PhD from the University of Wisconsin - Madison, where he specialized in large scale parallel database systems

    Todd Blaschka | COO

    Todd Blaschka is a veteran in the enterprise software industry. He is passionate about creating entirely new segments in data, analytics and AI, with the distinction of establishing graph analytics as a Gartner Top 10 Data & Analytics trend two years in a row. By fervently focusing on critical industry and customer challenges, the companies under Todd's leadership have delivered significant quantifiable results to the largest brands in the world through channel and solution sales approach. Prior to TigerGraph, Todd led go to market and customer experience functions at Clustrix (acquired by MariaDB), Dataguise and IBM.