Skip to content
START FOR FREE
START FOR FREE
  • SUPPORT
  • COMMUNITY
  • CONTACT
Menu
  • SUPPORT
  • COMMUNITY
  • CONTACT
MENUMENU
  • Products
    • The World’s Fastest and Most Scalable Graph Platform

      LEARN MORE

      Watch a TigerGraph Demo

      PRODUCTS

      • Why Graph?
      • Products Overview
      • What's New
      • GraphStudio User Interface
      • Visualization Toolkits
      • GSQL Query Language
      • Connectors

      TigerGRAPH ENTERPRISE

      • Enterprise Overview
      • Features

      TIGERGRAPH CLOUD

      • Cloud Overview
      • Cloud Starter Kits
      • Login/Sign Up
      • FAQ
      • Pricing
      • Marketplaces

      Graph Data Science

      • Graph Data Science Library
      • Machine Learning Workbench

      TRY TIGERGRAPH

      • Get Started for Free
      • Compare Editions
      • Test Drive - Online Demo
      • Watch Demos
      • Request a Demo
  • Solutions
    • The World’s Fastest and Most Scalable Graph Platform

      LEARN MORE

      Watch a TigerGraph Demo

      Solutions

      • Solutions Overview

      INCREASE REVENUE

      • Customer Journey/360
      • Product Marketing
      • Entity Resolution
      • Recommendation Engine

      MANAGE RISK

      • Fraud Detection
      • Anti-Money Laundering
      • Threat Detection
      • Risk Monitoring

      IMPROVE OPERATIONS

      • Supply Chain Analysis
      • Energy Management
      • Network Optimization

      By Industry

      • Advertising, Media & Entertainment
      • Financial Services
      • Healthcare & Life Sciences

      FOUNDATIONAL

      • AI & Machine Learning
      • Time Series Analysis
      • Geospatial Analysis
  • Customers
    • The World’s Fastest and Most Scalable Graph Platform

      LEARN MORE

      CUSTOMER SUCCESS STORIES

      • Citrix
      • Ford
      • Intuit
      • JPMorgan Chase
      • READ MORE SUCCESS STORIES
      • Jaguar Land Rover
      • United Health Group
      • Xbox
  • Partners
    • The World’s Fastest and Most Scalable Graph Platform

      LEARN MORE

      PARTNER PROGRAM

      • Partner Benefits
      • TigerGraph Partners
      • Sign Up
      TigerGraph partners with organizations that offer complementary technology solutions and services.​
  • Resources
    • The World’s Fastest and Most Scalable Graph Platform

      LEARN MORE

      BLOG

      • TigerGraph Blog

      RESOURCES

      • Resource Library
      • Benchmarks
      • Demos
      • O'Reilly Graph + ML Book

      EVENTS & WEBINARS

      • Graph+AI Summit
      • Trade Shows
      • Graph for All - Million Dollar Challenge
      • Webinars

      DEVELOPERS

      • Documentation
      • Ecosystem
      • Developers Hub
      • Community Forum

      SUPPORT

      • Contact Support
      • Production Guidelines

      EDUCATION

      • Certification
      • Training
  • Company
    • Join the World’s Fastest and Most Scalable Graph Platform

      WE ARE HIRING

      COMPANY

      • Company Overview
      • Leadership
      • Legal Terms

      CAREERS

      • Join Us
      • Open Positions

      AWARDS

      • Awards and Recognition
      • Leader in Forrester Wave
      • Gartner Research

      PRESS RELEASE

      • Read All Press Releases
      TigerGraph Delivers 600% ROI and $20.81M in Net Present Value in Total Economic Impact Study
      May 12, 2022
      Read More »

      NEWS

      • Read All News
      News

      TigerGraph expands its presence in France

      entrepreneur

      We Asked Entrepreneur Readers: How Do You Inspire Yourself, and Others?

  • START FOR FREE
    • The World’s Fastest and Most Scalable Graph Platform

      GET STARTED

      • Request a Demo
      • CONTACT US
      • Try TigerGraph
      • GET STARTED FOR FREE
      • TRY AN ONLINE DEMO

Improve Your Cybersecurity Posture with Graph Database Technology

  • David Braun
  • January 24, 2022
  • blog, Cybersecurity
  • Blog >
  • Improve Your Cybersecurity Posture with Graph Database Technology

With the continued proliferation of cybersecurity threats and attacks, one of the most important things you can invest in as a business is cybersecurity automation and reporting. With each of those tools, you create a new group of alerts and information to review. A graph database can be the answer to cutting through the noise these solutions can create.

Cybercrime rates are rapidly on the rise globally. With this realization, businesses need to know how important it is to protect sensitive data and keep customer details safely stored online. As businesses become cloud focused and as they work to improve customer access and data collection to serve their business, it’s becoming more difficult and more critical to identify threats.

Businesses must store at least some, if not all, of their data online to operate within the modern marketplace. Nowadays, many businesses have online shops or interfaces where they can store customer details to allow for online purchasing or engagement. This can often include sensitive information, such as names, addresses, financial details, proof of ID, and much more. The work from home expansion due to the COVID-19 pandemic, as well as increased needs of online or SaaS-based systems, has caused alerts and cybersecurity threats to increase to a level that SOC analysts can’t handle. They are simply unable to review all the screens within the extensive network of security tools their organization has deployed.

With the focused and effective steps outlined below, you can quickly improve your security posture. Keep in mind, graph database technology provides a level of data analysis that cannot be found elsewhere. The number one fear that people have complained about is the scalability of the alerts and data within their graph databases. TigerGraph’s  massively parallel processing architecture ensures scalability to the level of terabytes of data with near-real-time analysis and automation of the activity you need.

Implement Centralized Threat Analysis with Graph

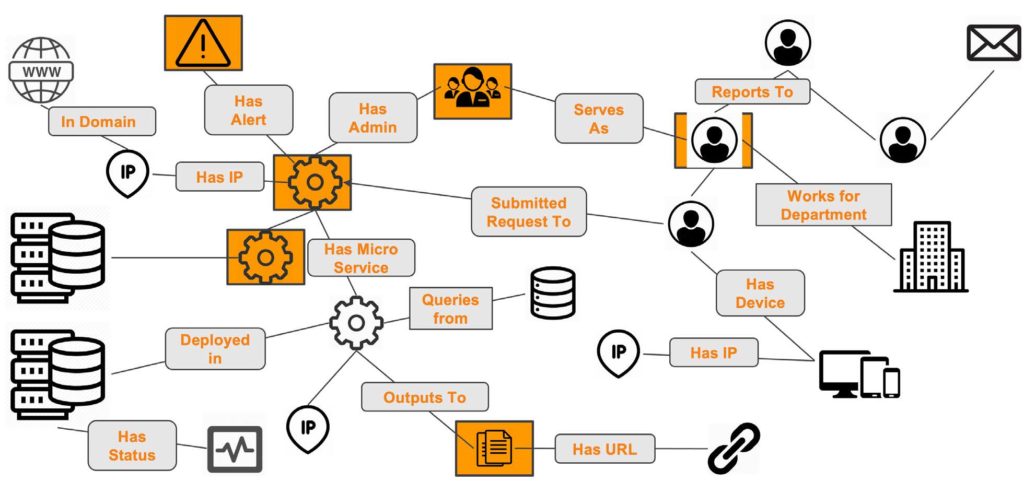
By deploying a graph database, like TigerGraph, you can feed all of your existing data feeds from the multiple disparate tools you use in your security stack to better review, correlate, and improve the level of visibility in user patterns, lateral movement, data mining, privileged user permissions escalation, malware attacks, ransomware data encryption, and much more.

TigerGraph’s deep link analytics uncover cybersecurity threats traditional systems may miss

Use Multi-Factor Authentication

Multi-Factor Authentication is an easy way to ensure that there are several stages required to reset a forgotten password or enter a database. These steps can include things like a CAPTCHA challenge, mobile notification, or security questions. Multi-factor authentication is considered one of the best cybersecurity tools for businesses to use.

It is not only effective but also relatively inexpensive to put into place.

Create Secure Networks and Centralize Visibility

Business intelligence and cybersecurity are the ultimate duo. Adding in centralized visibility with graph databases will enable fast, effective threat detection and analysis. In the modern world these technologies go hand in hand. It is important now, more than ever, to have a secure router as well as a secure Wi-Fi network and having a way to review the logs, data sources, alerts, anomalies, activity patterns, and overall threat review to guarantee you identify a security threat as early as possible in your MITRE ATT&CK kill chain.

Create Strong Passwords

While this one may seem fairly obvious, most people don’t actually realize the importance of having a strong password. A strong and secure password is an absolute must. Using multi-factor authentication along with strong passwords increases the best possible protection within your cybersecurity framework. Make sure that your employees use strong passwords that combine a secure combination of numbers, letters, and abstract characters. After guaranteeing this implementation, you will see the use of multi-factor authentication is an easily accepted improvement for your user community.

SOC Dashboard with Reporting, Analysis, and In-depth Algorithms

Cyberattacks are a constant and evolving threat to businesses. That is why it is absolutely vital to have the ability to constantly be on the watch for the imminent threats to your network and data. The improvements provided by TigerGraph’s centralized analysis makes early identification of active cyberthreats possible. Ensuring that you have constant reviews, automated identification, and correlation will ensure that your SOC or NOC analysts are not experiencing significant alert fatigue, you’ll reduce your overall false positives, and quickly weed through your false negatives as well.

The Bottom Line

While it can sound strange to focus on graph database technology for your improved cybersecurity posture, it is really a necessity in the growing threat landscape each business faces. Businesses that put securing their data on the back burner will face huge financial consequences, reputation losses and potential regulatory fines.

Losing the critical and highly sensitive data needed to run their business is definitely not a risk organizations can afford to take. Reach out to us to get a better idea of how graph database technology can help your security team, NOC team, or SOC team manage the threats they combat daily and improve your cybersecurity posture.

You Might Also Like

Graph + AI Summit - Getting the Most from Your Virtual Summit Experience

Graph + AI Summit - Getting...

May 18, 2022
3 Real-time Banking Scenarios for Operational Excellence with TigerGraph

3 Real-time Banking Scenarios for Operational...

May 17, 2022
Speeding the Process for Pharmaceutical Drug Approvals

Speeding the Process for Pharmaceutical Drug...

May 12, 2022

Introducing TigerGraph 3.0

July 1, 2020

Everything to Know to Pass your TigerGraph Certification Test

June 24, 2020

Neo4j 4.0 Fabric – A Look Behind the Curtain

February 7, 2020

TigerGraph Blog

  • Categories
    • Analyst Research
    • blog
    • blogs
      • About TigerGraph
      • Benchmark
      • Business
      • Community
      • Customer
      • Customer 360
      • Cybersecurity
      • Developers
      • eCommerce
      • Entity Resolution
      • Executive Brief
      • Finance
      • Fraud / Anti-Money Laundering
      • GQL
      • Graph Database Market
      • Graph Databases
      • Graph Gurus
      • GSQL
      • Healthcare
      • Machine Learning
      • Machine Learning / AI
      • Meetup
      • Mini Guide
      • Podcast
      • Press
      • Press Releases
      • Product
      • Supply Chain
      • TigerGraph
      • TigerGraph Cloud
      • TigerGraph Press Release
    • Cloud
    • Data Science
    • EMEA EVENTS
    • Emerging Use Cases
    • Fraud / Anti-Money Laundering
    • Healthcare
    • Machine Learning / AI
    • On-Demand Event
    • Partners
    • Recommendation Engine
    • Success Stories
    • Uncategorized
    • US EVENTS
  • Recent Posts

    • Le Big Boss /Supply Chain Dinner – Paris
    • EBA Day Vienna
    • Graph + AI Summit – Getting the Most from Your Virtual Summit Experience
    • HPE Discover
    • CDAO Exchange
    TigerGraph

    Product

    SOLUTIONS

    customers

    RESOURCES

    start for free

    PRODUCT
    • Overview
    • What's New
    • Toolkits
    • Connectors
    • Data Science Library
    TIGERGRAPH DB
    • Overview
    • No-Code Graph Analytics
    • Features
    • GSQL Query Language
    TIGERGRAPH CLOUD
    • Overview
    • Cloud Starter Kits
    • Login
    • FAQ
    • Pricing
    • Cloud Marketplaces
    GRAPHSTUDIO
    • Overview
    • Take a Test Drive
    TRY NOW
    • Get Started for Free
    • Compare Editions
    • License FAQ
    SOLUTIONS
    • Why Graph?
    industry
    • Advertising, Media & Entertainment
    • Financial Services
    • Healthcare & Life Sciences
    use cases
    • Benefits
    • Product & Service Marketing
    • Entity Resolution
    • Customer 360/MDM
    • Recommendation Engine
    • Anti-Money Laundering
    • Cybersecurity Threat Detection
    • Fraud Detection
    • Risk Assessment & Monitoring
    • Energy Management
    • Network & IT Management
    • Supply Chain Analysis
    • AI & Machine Learning
    • Geospatial Analysis
    • Time Series Analysis
    success stories
    • Customer Success Stories

    Partners

    Partner program
    • Partner Benefits
    • TigerGraph Partners
    • Sign Up
    LIBRARY
    • Resources
    • Benchmark
    • Webinars
    Events
    • Trade Shows
    • Graph + AI Summit
    • Million Dollar Challenge
    EDUCATION
    • TigerGraph Academy
    • Certification
    Blog
    • TigerGraph Blog
    DEVELOPERS
    • Developers Hub
    • Community Forum
    • Documentation
    • Ecosystem

    COMPANY

    Company
    • Overview
    • Careers
    • News
    • Press Release
    • Awards
    • Legal
    Get Started
    • Get TigerGraph
    • Compare Editions
    • Online Demo - Test Drive
    • Request a Demo

    Product

    • Overview
    • TigerGraph 3.0
    • TIGERGRAPH DB
    • TIGERGRAPH CLOUD
    • GRAPHSTUDIO
    • TRY NOW

    customers

    • success stories

    RESOURCES

    • LIBRARY
    • Events
    • EDUCATION
    • BLOG
    • DEVELOPERS

    SOLUTIONS

    • SOLUTIONS
    • use cases
    • industry

    Partners

    • partner program

    company

    • Overview
    • news
    • Press Release
    • Awards

    start for free

    • Request Demo
    • take a test drive
    • SUPPORT
    • COMMUNITY
    • CONTACT
    • Copyright © 2022 TigerGraph
    • Privacy Policy
    • Linkedin
    • Facebook
    • Twitter

    Copyright © 2020 TigerGraph | Privacy Policy

    Copyright © 2020 TigerGraph Privacy Policy

    • SUPPORT
    • COMMUNITY
    • COMPANY
    • CONTACT
    • Linkedin
    • Facebook
    • Twitter

    Copyright © 2020 TigerGraph

    Privacy Policy

    • Products
    • Solutions
    • Customers
    • Partners
    • Resources
    • Company
    • START FOR FREE
    START FOR FREE
    START FOR FREE
    TigerGraph
    PRODUCT
    PRODUCT
    • Overview
    • GraphStudio UI
    • Graph Data Science Library
    TIGERGRAPH DB
    • Overview
    • Features
    • GSQL Query Language
    TIGERGRAPH CLOUD
    • Overview
    • Cloud Starter Kits
    TRY TIGERGRAPH
    • Get Started for Free
    • Compare Editions
    SOLUTIONS
    SOLUTIONS
    • Why Graph?
    use cases
    • Benefits
    • Product & Service Marketing
    • Entity Resolution
    • Customer Journey/360
    • Recommendation Engine
    • Anti-Money Laundering (AML)
    • Cybersecurity Threat Detection
    • Fraud Detection
    • Risk Assessment & Monitoring
    • Energy Management
    • Network Resources Optimization
    • Supply Chain Analysis
    • AI & Machine Learning
    • Geospatial Analysis
    • Time Series Analysis
    industry
    • Advertising, Media & Entertainment
    • Financial Services
    • Healthcare & Life Sciences
    CUSTOMERS
    read all success stories


    PARTNERS
    Partner program
    • Partner Benefits
    • TigerGraph Partners
    • Sign Up
    RESOURCES
    LIBRARY
    • Resource Library
    • Benchmark
    • Webinars
    Events
    • Trade Shows
    • Graph + AI Summit
    • Graph for All - Million Dollar Challenge
    EDUCATION
    • TigerGraph Academy
    • Certification
    Blog
    • TigerGraph Blog
    DEVELOPERS
    • Developers Hub
    • Community Forum
    • Documentation
    • Ecosystem
    COMPANY
    COMPANY
    • Overview
    • Leadership
    • Careers  
    NEWS
    PRESS RELEASE
    AWARDS
    START FOR FREE
    Start For Free
    • Try TigerGraph Now
    • Request a Demo
    • SUPPORT
    • COMMUNITY
    • CONTACT
    Dr. Jay Yu

    Dr. Jay Yu | VP of Product and Innovation

    Dr. Jay Yu is the VP of Product and Innovation at TigerGraph, responsible for driving product strategy and roadmap, as well as fostering innovation in graph database engine and graph solutions. He is a proven hands-on full-stack innovator, strategic thinker, leader, and evangelist for new technology and product, with 25+ years of industry experience ranging from highly scalable distributed database engine company (Teradata), B2B e-commerce services startup, to consumer-facing financial applications company (Intuit). He received his PhD from the University of Wisconsin - Madison, where he specialized in large scale parallel database systems

    Todd Blaschka | COO

    Todd Blaschka is a veteran in the enterprise software industry. He is passionate about creating entirely new segments in data, analytics and AI, with the distinction of establishing graph analytics as a Gartner Top 10 Data & Analytics trend two years in a row. By fervently focusing on critical industry and customer challenges, the companies under Todd's leadership have delivered significant quantifiable results to the largest brands in the world through channel and solution sales approach. Prior to TigerGraph, Todd led go to market and customer experience functions at Clustrix (acquired by MariaDB), Dataguise and IBM.