Skip to content
START FOR FREE
START FOR FREE
  • SUPPORT
  • COMMUNITY
Menu
  • SUPPORT
  • COMMUNITY
MENUMENU
  • Products
    • The World’s Fastest and Most Scalable Graph Platform

      LEARN MORE

      Watch a TigerGraph Demo

      TIGERGRAPH CLOUD

      • Overview
      • TigerGraph Cloud Suite
      • FAQ
      • Pricing

      USER TOOLS

      • GraphStudio
      • Insights
      • Application Workbenches
      • Connectors and Drivers
      • Starter Kits
      • openCypher Support

      TIGERGRAPH DB

      • Overview
      • GSQL Query Language
      • Compare Editions

      GRAPH DATA SCIENCE

      • Graph Data Science Library
      • Machine Learning Workbench
  • Solutions
    • The World’s Fastest and Most Scalable Graph Platform

      LEARN MORE

      Watch a TigerGraph Demo

      Solutions

      • Solutions Overview

      INCREASE REVENUE

      • Customer Journey/360
      • Product Marketing
      • Entity Resolution
      • Recommendation Engine

      MANAGE RISK

      • Fraud Detection
      • Anti-Money Laundering
      • Threat Detection
      • Risk Monitoring

      IMPROVE OPERATIONS

      • Supply Chain Analysis
      • Energy Management
      • Network Optimization

      By Industry

      • Advertising, Media & Entertainment
      • Financial Services
      • Healthcare & Life Sciences

      FOUNDATIONAL

      • AI & Machine Learning
      • Time Series Analysis
      • Geospatial Analysis
  • Customers
    • The World’s Fastest and Most Scalable Graph Platform

      LEARN MORE

      CUSTOMER SUCCESS STORIES

      • Ford
      • Intuit
      • JPMorgan Chase
      • READ MORE SUCCESS STORIES
      • Jaguar Land Rover
      • Xbox
  • Partners
    • The World’s Fastest and Most Scalable Graph Platform

      LEARN MORE

      PARTNER PROGRAM

      • Partner Benefits
      • TigerGraph Partners
      • Sign Up
      TigerGraph partners with organizations that offer complementary technology solutions and services.​
  • Resources
    • The World’s Fastest and Most Scalable Graph Platform

      LEARN MORE

      BLOG

      • TigerGraph Blog

      RESOURCES

      • Resource Library
      • Benchmarks
      • Demos
      • O'Reilly Graph + ML Book

      EVENTS & WEBINARS

      • Graph+AI Summit
      • Events &Trade Shows
      • Webinars

      DEVELOPERS

      • Documentation
      • Ecosystem
      • Developers Hub
      • Community Forum

      SUPPORT

      • Contact Support
      • Production Guidelines

      EDUCATION

      • Training & Certifications
  • Company
    • Join the World’s Fastest and Most Scalable Graph Platform

      WE ARE HIRING

      COMPANY

      • Company Overview
      • Leadership
      • Legal Terms
      • Patents
      • Security and Compliance

      CAREERS

      • Join Us
      • Open Positions

      AWARDS

      • Awards and Recognition
      • Leader in Forrester Wave
      • Gartner Research

      PRESS RELEASE

      • Read All Press Releases
      TigerGraph Reports Exceptional Customer Growth and Product Leadership as More Market-Leading Companies Tap the Power of Graph
      March 1, 2023
      Read More »

      NEWS

      • Read All News

      The Coolest Database System Companies Of The 2023 Big Data 100

      Data Breakthrough Awards 2023 Winner

  • START FREE
    • The World’s Fastest and Most Scalable Graph Platform

      GET STARTED

      • Request a Demo
      • CONTACT US
      • Try TigerGraph
      • START FREE
      • TRY AN ONLINE DEMO

Improving The Treatment Of Acute Lymphoblastic Leukemia Using Graph Analytics With AI And Machine Learning

  • Emily McAuliffe
  • August 4, 2021
  • blog, Healthcare, Machine Learning / AI
  • Blog >
  • Improving The Treatment Of Acute Lymphoblastic Leukemia Using Graph Analytics With AI And Machine Learning

This is an abbreviated version of a presentation by Jesper Vang, Technical University of Denmark, during the Graph + AI Summit 2021 conference

Our group at the Technical University of Denmark is centered on translational bioinformatics. Our main objective is to improve the diagnostics, treatment, and cure rates for children with cancer. We focus mainly on developing storage interpretative models and methods, and also optimizing the transformation of increasingly large biomedical and genomic data that’s been generated. 

Currently, we are building a biobank and database for childhood cancer research that includes samples, both retrospective, and prospective. While we’re generating the data, we also carry out extensive analysis on germline and tumor DNA, as well as transcriptomics, to gain insight into cancer, somatic mutations, tumor biology, and predisposition syndromes.

By linking together various other data points about the patient’s life, illness, and treatment, clinical personnel can understand to a much greater extent why children get cancer and provide earlier diagnosis and far more effective treatment.

Our long-term goal is to create one of the most respected, multidisciplinary research groups within childhood cancer. To achieve that we of course need great partners, researchers and also a great data infrastructure.

How are we using graph analytics to help? Well, as you can imagine, we have a lot of data. We feel limited by our relational database. Why? Although a relational database handles close relationships between data easily, they are more challenging when investigating distant relationships. 

When we started building our relational database, we built it with questions in mind, but the problem with research is that you never really know what the perfect question is in the beginning. With a graph database, it’s possible to answer random questions, which is typical for us as a hospital or doctor comes up with a new question and expects the answer to be somewhere in the data.

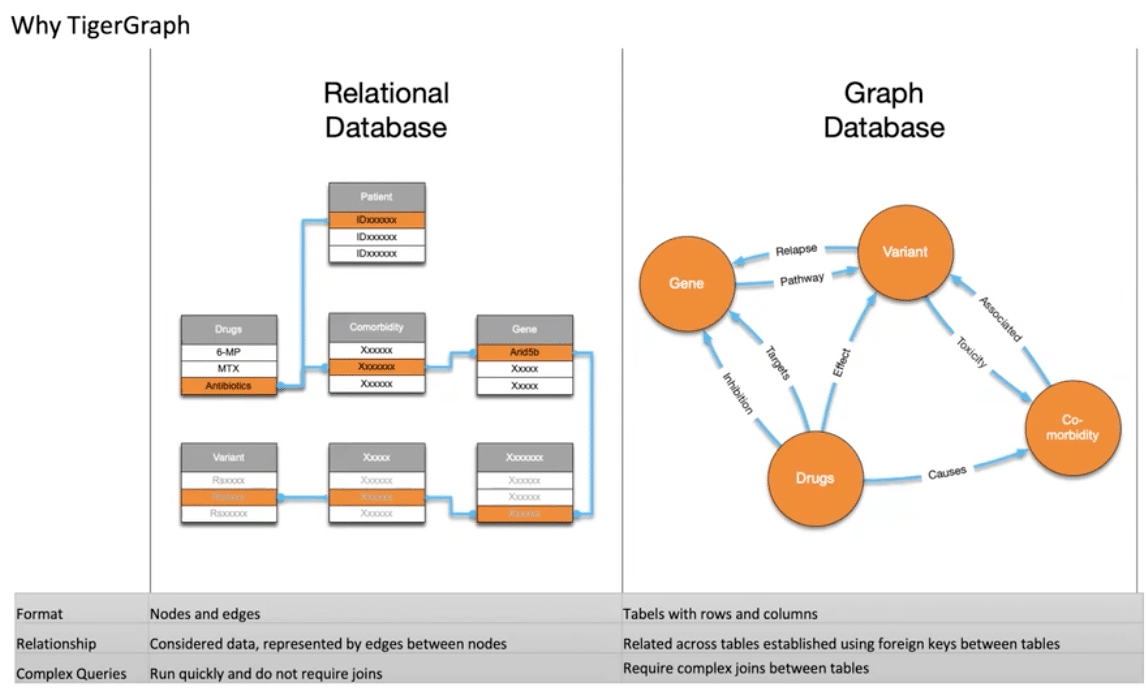
For example, let’s say you want to determine how many patients, with a specific variant, were treated with a specific drug, but experienced some type of complication. In a relational database, the database administrator would have to sort of predict that these questions would be asked at some point. Otherwise, it would be really difficult to retrieve that information. 

With a graph database, however, it’s possible to answer random questions—and that’s necessary for a medical environment where a doctor could come up with a question and needs an answer from the data. By using a graph we can answer all the questions, as long as there is a relationship between the data, and we can add more data and relationships as the information emerges whilst maintaining the same performance.

Analyzing relationships between nodes representing patients, and nodes representing genetic variations, is as simple as finding the connecting nodes. And we do not have to redefine the database every time we add new annotations. Why? This is because the graph database is dynamically extensible to accommodate new sources of information so we do not have to redefine the database every time we add data sources. 

I hope that this was informative, and am looking forward to showcasing the results of our research at the next Graph + AI summit. I would like to thank TigerGraph for being very supportive, something that we really appreciate. And, finally, I would like to thank the team at the university, who is doing some truly excellent work in cancer research.

You can listen to the full presentation here.

You Might Also Like

How to Achieve a True 360-Degree Customer View with TigerGraph

How to Achieve a True 360-Degree...

April 10, 2023
Trillion edges benchmark: new world record beyond 100TB by TigerGraph featuring AMD based Amazon EC2 instances

Trillion edges benchmark: new world record...

March 13, 2023
Graph Databases 101: Your Top 5 Questions with Non-Technical Answers

Graph Databases 101: Your Top 5...

February 7, 2023

Introducing TigerGraph 3.0

July 1, 2020

Everything to Know to Pass your TigerGraph Certification Test

June 24, 2020

Neo4j 4.0 Fabric – A Look Behind the Curtain

February 7, 2020

TigerGraph Blog

  • Categories
    • blogs
      • About TigerGraph
      • Benchmark
      • Business
      • Community
      • Compliance
      • Customer
      • Customer 360
      • Cybersecurity
      • Developers
      • Digital Twin
      • eCommerce
      • Emerging Use Cases
      • Entity Resolution
      • Finance
      • Fraud / Anti-Money Laundering
      • GQL
      • Graph Database Market
      • Graph Databases
      • GSQL
      • Healthcare
      • Machine Learning / AI
      • Podcast
      • Supply Chain
      • TigerGraph
      • TigerGraph Cloud
    • Graph AI On Demand
      • Analysts and Research
      • Customer 360 and Entity Resolution
      • Customer Spotlight
      • Development
      • Finance, Banking, Insurance
      • Keynote
      • Session
    • Video
  • Recent Posts

    • Build Your First Fraud Solution Using Graph Analytics | 31 May 2023 @ 8 am PST
    • NICE Actimize Engage, London
    • The Knowledge Graph Conference
    • How to Achieve a True 360-Degree Customer View with TigerGraph
    • Trillion edges benchmark: new world record beyond 100TB by TigerGraph featuring AMD based Amazon EC2 instances
    TigerGraph

    Product

    SOLUTIONS

    customers

    RESOURCES

    start for free

    TIGERGRAPH DB
    • Overview
    • Features
    • GSQL Query Language
    GRAPH DATA SCIENCE
    • Graph Data Science Library
    • Machine Learning Workbench
    TIGERGRAPH CLOUD
    • Overview
    • Cloud Starter Kits
    • Login
    • FAQ
    • Pricing
    • Cloud Marketplaces
    USEr TOOLS
    • GraphStudio
    • TigerGraph Insights
    • Application Workbenches
    • Connectors and Drivers
    • Starter Kits
    • openCypher Support
    SOLUTIONS
    • Why Graph?
    industry
    • Advertising, Media & Entertainment
    • Financial Services
    • Healthcare & Life Sciences
    use cases
    • Benefits
    • Product & Service Marketing
    • Entity Resolution
    • Customer 360/MDM
    • Recommendation Engine
    • Anti-Money Laundering
    • Cybersecurity Threat Detection
    • Fraud Detection
    • Risk Assessment & Monitoring
    • Energy Management
    • Network & IT Management
    • Supply Chain Analysis
    • AI & Machine Learning
    • Geospatial Analysis
    • Time Series Analysis
    success stories
    • Customer Success Stories

    Partners

    Partner program
    • Partner Benefits
    • TigerGraph Partners
    • Sign Up
    LIBRARY
    • Resources
    • Benchmark
    • Webinars
    Events
    • Trade Shows
    • Graph + AI Summit
    • Million Dollar Challenge
    EDUCATION
    • Training & Certifications
    Blog
    • TigerGraph Blog
    DEVELOPERS
    • Developers Hub
    • Community Forum
    • Documentation
    • Ecosystem

    COMPANY

    Company
    • Overview
    • Careers
    • News
    • Press Release
    • Awards
    • Legal
    • Patents
    • Security and Compliance
    • Contact
    Get Started
    • Start Free
    • Compare Editions
    • Online Demo - Test Drive
    • Request a Demo

    Product

    • Overview
    • TigerGraph 3.0
    • TIGERGRAPH DB
    • TIGERGRAPH CLOUD
    • GRAPHSTUDIO
    • TRY NOW

    customers

    • success stories

    RESOURCES

    • LIBRARY
    • Events
    • EDUCATION
    • BLOG
    • DEVELOPERS

    SOLUTIONS

    • SOLUTIONS
    • use cases
    • industry

    Partners

    • partner program

    company

    • Overview
    • news
    • Press Release
    • Awards

    start for free

    • Request Demo
    • take a test drive
    • SUPPORT
    • COMMUNITY
    • CONTACT
    • Copyright © 2023 TigerGraph
    • Privacy Policy
    • Linkedin
    • Facebook
    • Twitter

    Copyright © 2020 TigerGraph | Privacy Policy

    Copyright © 2020 TigerGraph Privacy Policy

    • SUPPORT
    • COMMUNITY
    • COMPANY
    • CONTACT
    • Linkedin
    • Facebook
    • Twitter

    Copyright © 2020 TigerGraph

    Privacy Policy

    • Products
    • Solutions
    • Customers
    • Partners
    • Resources
    • Company
    • START FREE
    START FOR FREE
    START FOR FREE
    TigerGraph
    PRODUCT
    PRODUCT
    • Overview
    • GraphStudio UI
    • Graph Data Science Library
    TIGERGRAPH DB
    • Overview
    • Features
    • GSQL Query Language
    TIGERGRAPH CLOUD
    • Overview
    • Cloud Starter Kits
    TRY TIGERGRAPH
    • Get Started for Free
    • Compare Editions
    SOLUTIONS
    SOLUTIONS
    • Why Graph?
    use cases
    • Benefits
    • Product & Service Marketing
    • Entity Resolution
    • Customer Journey/360
    • Recommendation Engine
    • Anti-Money Laundering (AML)
    • Cybersecurity Threat Detection
    • Fraud Detection
    • Risk Assessment & Monitoring
    • Energy Management
    • Network Resources Optimization
    • Supply Chain Analysis
    • AI & Machine Learning
    • Geospatial Analysis
    • Time Series Analysis
    industry
    • Advertising, Media & Entertainment
    • Financial Services
    • Healthcare & Life Sciences
    CUSTOMERS
    read all success stories


    PARTNERS
    Partner program
    • Partner Benefits
    • TigerGraph Partners
    • Sign Up
    RESOURCES
    LIBRARY
    • Resource Library
    • Benchmark
    • Webinars
    Events
    • Trade Shows
    • Graph + AI Summit
    • Graph for All - Million Dollar Challenge
    EDUCATION
    • TigerGraph Academy
    • Certification
    Blog
    • TigerGraph Blog
    DEVELOPERS
    • Developers Hub
    • Community Forum
    • Documentation
    • Ecosystem
    COMPANY
    COMPANY
    • Overview
    • Leadership
    • Careers  
    NEWS
    PRESS RELEASE
    AWARDS
    START FREE
    Start Free
    • Request a Demo
    • SUPPORT
    • COMMUNITY
    • CONTACT
    Dr. Jay Yu

    Dr. Jay Yu | VP of Product and Innovation

    Dr. Jay Yu is the VP of Product and Innovation at TigerGraph, responsible for driving product strategy and roadmap, as well as fostering innovation in graph database engine and graph solutions. He is a proven hands-on full-stack innovator, strategic thinker, leader, and evangelist for new technology and product, with 25+ years of industry experience ranging from highly scalable distributed database engine company (Teradata), B2B e-commerce services startup, to consumer-facing financial applications company (Intuit). He received his PhD from the University of Wisconsin - Madison, where he specialized in large scale parallel database systems

    Todd Blaschka | COO

    Todd Blaschka is a veteran in the enterprise software industry. He is passionate about creating entirely new segments in data, analytics and AI, with the distinction of establishing graph analytics as a Gartner Top 10 Data & Analytics trend two years in a row. By fervently focusing on critical industry and customer challenges, the companies under Todd's leadership have delivered significant quantifiable results to the largest brands in the world through channel and solution sales approach. Prior to TigerGraph, Todd led go to market and customer experience functions at Clustrix (acquired by MariaDB), Dataguise and IBM.