Skip to content
START FOR FREE
START FOR FREE
  • SUPPORT
  • COMMUNITY
Menu
  • SUPPORT
  • COMMUNITY
MENUMENU
  • Products
    • The World’s Fastest and Most Scalable Graph Platform

      LEARN MORE

      Watch a TigerGraph Demo

      TIGERGRAPH CLOUD

      • Overview
      • TigerGraph Cloud Suite
      • FAQ
      • Pricing

      USER TOOLS

      • GraphStudio
      • Insights
      • Application Workbenches
      • Connectors and Drivers
      • Starter Kits
      • openCypher Support

      TIGERGRAPH DB

      • Overview
      • GSQL Query Language
      • Compare Editions

      GRAPH DATA SCIENCE

      • Graph Data Science Library
      • Machine Learning Workbench
  • Solutions
    • The World’s Fastest and Most Scalable Graph Platform

      LEARN MORE

      Watch a TigerGraph Demo

      Solutions

      • Solutions Overview

      INCREASE REVENUE

      • Customer Journey/360
      • Product Marketing
      • Entity Resolution
      • Recommendation Engine

      MANAGE RISK

      • Fraud Detection
      • Anti-Money Laundering
      • Threat Detection
      • Risk Monitoring

      IMPROVE OPERATIONS

      • Supply Chain Analysis
      • Energy Management
      • Network Optimization

      By Industry

      • Advertising, Media & Entertainment
      • Financial Services
      • Healthcare & Life Sciences

      FOUNDATIONAL

      • AI & Machine Learning
      • Time Series Analysis
      • Geospatial Analysis
  • Customers
    • The World’s Fastest and Most Scalable Graph Platform

      LEARN MORE

      CUSTOMER SUCCESS STORIES

      • Ford
      • Intuit
      • JPMorgan Chase
      • READ MORE SUCCESS STORIES
      • Jaguar Land Rover
      • United Health Group
      • Xbox
  • Partners
    • The World’s Fastest and Most Scalable Graph Platform

      LEARN MORE

      PARTNER PROGRAM

      • Partner Benefits
      • TigerGraph Partners
      • Sign Up
      TigerGraph partners with organizations that offer complementary technology solutions and services.​
  • Resources
    • The World’s Fastest and Most Scalable Graph Platform

      LEARN MORE

      BLOG

      • TigerGraph Blog

      RESOURCES

      • Resource Library
      • Benchmarks
      • Demos
      • O'Reilly Graph + ML Book

      EVENTS & WEBINARS

      • Graph+AI Summit
      • Graph for All - Million Dollar Challenge
      • Events &Trade Shows
      • Webinars

      DEVELOPERS

      • Documentation
      • Ecosystem
      • Developers Hub
      • Community Forum

      SUPPORT

      • Contact Support
      • Production Guidelines

      EDUCATION

      • Training & Certifications
  • Company
    • Join the World’s Fastest and Most Scalable Graph Platform

      WE ARE HIRING

      COMPANY

      • Company Overview
      • Leadership
      • Legal Terms
      • Patents
      • Security and Compliance

      CAREERS

      • Join Us
      • Open Positions

      AWARDS

      • Awards and Recognition
      • Leader in Forrester Wave
      • Gartner Research

      PRESS RELEASE

      • Read All Press Releases
      TigerGraph Reports Exceptional Customer Growth and Product Leadership as More Market-Leading Companies Tap the Power of Graph
      March 1, 2023
      Read More »

      NEWS

      • Read All News
      The-New-Stack-Logo-square

      Multiple Vendors Make Data and Analytics Ubiquitous

      TigerGraph enhances fundamentals in latest platform update

  • START FREE
    • The World’s Fastest and Most Scalable Graph Platform

      GET STARTED

      • Request a Demo
      • CONTACT US
      • Try TigerGraph
      • START FREE
      • TRY AN ONLINE DEMO

Insurance Graph + AI Enablement

  • TigerGraph
  • April 19, 2022
  • blog, Community, Finance
  • Blog >
  • Insurance Graph + AI Enablement

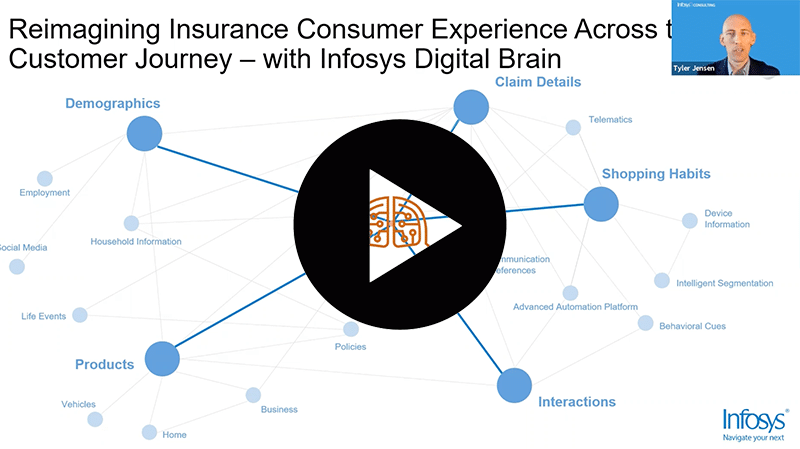
This is an abbreviated version of a presentation by Tyler Jensen, Senior Consultant at Infosys Consulting, during the Fall 2021 Graph + AI Fall Summit conference.

I’ll begin my presentation by admitting that knowledge graphs don’t get the publicity or glamour of the popular insurance industry trends like self-driving vehicles and technology there. So, you’ll have to hear from me instead of Elon Musk — my name is Tyler Jensen and I’m with Infosys consulting.

My presentation is about graph technology, and how the insurance industry is utilizing AI and ML capabilities in connection with those graphs. It’s an exciting time because these technologies are only just beginning to be adopted by the insurance industry. 

Insurance organizations are struggling to distinguish themselves among the industry that’s highly competitive and is often seen as a commodity by customers, particularly when it comes to claims that can be the differentiator to establish the product to real value for the consumer. 

It’s no secret that insurers have a huge amount of data available to them. If you think about it, they’ve been operating for sometimes hundreds of years in an industry that has an entire discipline devoted to the study and application of data and numbers, which is actuarial science. But when you look at the percent of data that’s actually used, it’s barely scratching the surface. A recent Forbes article stated most insurance companies don’t use a lot of data to create their products. Instead, they rely on demographic information that is 40 years old and older. 

Organizations can rethink their offerings and customer experiences using artificial intelligence and machine learning, and graph technology at all levels of the journey.

Graph technology can help in many areas. One of these is utilizing graph technology to improve internal claim handling. This new technology would enable faster, broader searches for data to identify potential fraudulent activity on a claim. Graph enables data-driven decisions and consistency and claim handling. One primary outcome of this effort is a projected reduction in claim cycle time and improved claim payment accuracy.

Figure 1: AI/ML use cases for insurers

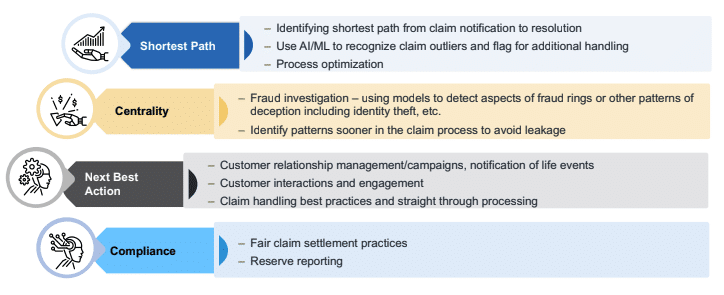
One of the common algorithms used in graphs is a shortest path search. How does this help with insurance claims? Each claim has a life cycle that starts when the accident happens with a first notice of loss to the insurance company and ends with the final claim settlement. Now, if you talk with the claim handler who’s done this for more than just a couple days, you’ll find out that the claim often follows predictable paths. Not always but mostly. And you’ll find that sometimes the path may lead to a negative experience for the customer; as they say, a large gaze swings on a small hinge. If these hinge points can be identified earlier and resolved, they can lead to a better customer outcome.

Sometimes those claims are the ones that require the most attention as quickly as possible to redirect or handle in another way. Machine learning can identify those paths that are otherwise not really noticed by individuals and bring them to the forefront to address as a claim handler; how would you like to see a notification that a particular claim requires immediate attention to avoid lengthy resolution steps down the road? 

Another example of where machine learning can help is with identifying fake damage photos. ML can identify the content of those photos and search previous claims, as well as the internet, to find similar pictures. One fraudster recently tried to crop a photo from the internet of a fire-damaged kitchen and use that for evidence of loss. Luckily, it was identified and stopped before payment was made. 

A combination of graph and AI and ML has the potential to save vast sums of money. And, even if the amount of money saved per claim is small, it’s a significant amount when multiplied by 1000s of claims. This is an eye-opening prospect for many of us in the insurance industry.

This is an example of some of the data points that can be utilized with AI and ML within a graph. There are so many data points that can be brought in. It requires data scientists to rely on these additional computer resources to determine even where to focus their efforts. But certainly, there are aspects of a customer journey from their demographics and purchasing preferences to their interactions with an organization that is primed for integration with AI and ML. Each of these areas can be leveraged to build a 360-degree customer view. And then reimagine the customer experience based on that knowledge, graphs are easy to expand and connect.

Figure 2: Additional AI/ML use cases for insurers

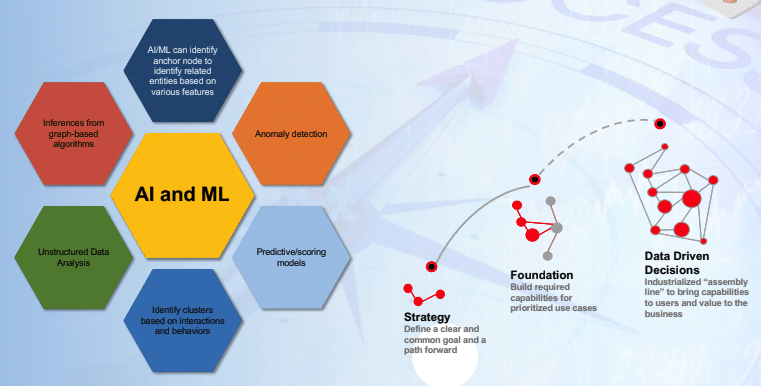
Some of the additional use cases we have seen in the industry are listed here. From inferencing and predictive models to analyzing unstructured data, like photos, videos, and verbal communication, AI and ML can be utilized with underlying graph technology to enhance operations. Insurers can apply this technology in various aspects of their business to improve customer service and reduce costs. In order to achieve this success, organizations need to define a clear and common goal or path forward. They will then build the required capabilities using graph technology based on prioritized use cases. 

The value of knowledge graphs is in making data-driven decisions to support operations. Again, it’s a step-by-step step process. We’ve come a long way in the industry from simply identifying which houses have trees in front of them, and which risks to accept. Now, insurers have so much data, it’s almost humanly impossible to determine how to utilize that. Fortunately, there is AI / ML that can take on that burden, formulate insights, and enable companies to utilize graph technology to differentiate themselves from the competition. 

This is an exciting time to be involved with graph technology. The question is, how are you going to adopt graph plus AI and ML to make your insurance business more productive, effective, and customer-focused? 

I wish you the best in your efforts and would love to assist where needed.

Graph + AI Summit Spring 2022

Registration is open for Graph + AI Summit Spring 2022, being held virtually May 24-25, 2022. Join us once again as we present the industry’s only open conference dedicated to accelerating analytics, AI, and machine learning projects with graph algorithms.

You Might Also Like

Trillion edges benchmark: new world record beyond 100TB by TigerGraph featuring AMD based Amazon EC2 instances

Trillion edges benchmark: new world record...

March 13, 2023
Graph Databases 101: Your Top 5 Questions with Non-Technical Answers

Graph Databases 101: Your Top 5...

February 7, 2023
It’s Time to Harness the Power of Graph Technology [Infographic]

It’s Time to Harness the Power...

January 25, 2023

Introducing TigerGraph 3.0

July 1, 2020

Everything to Know to Pass your TigerGraph Certification Test

June 24, 2020

Neo4j 4.0 Fabric – A Look Behind the Curtain

February 7, 2020

TigerGraph Blog

  • Categories
    • blogs
      • About TigerGraph
      • Benchmark
      • Business
      • Community
      • Compliance
      • Customer
      • Customer 360
      • Cybersecurity
      • Developers
      • Digital Twin
      • eCommerce
      • Emerging Use Cases
      • Entity Resolution
      • Finance
      • Fraud / Anti-Money Laundering
      • GQL
      • Graph Database Market
      • Graph Databases
      • GSQL
      • Healthcare
      • Machine Learning / AI
      • Podcast
      • Supply Chain
      • TigerGraph
      • TigerGraph Cloud
    • Graph AI On Demand
      • Analysts and Research
      • Customer 360 and Entity Resolution
      • Customer Spotlight
      • Development
      • Finance, Banking, Insurance
      • Keynote
      • Session
    • Video
  • Recent Posts

    • Trillion edges benchmark: new world record beyond 100TB by TigerGraph featuring AMD based Amazon EC2 instances
    • Overview of Graph and Machine Learning with TigerGraph | Mar 8 @ 11am PST
    • Gartner Data & Analytics Summit 2023, London
    • Gartner Data and Analytics Summit, Orlando
    • Transaction Surveillance with Maximum Flow Algorithm
    TigerGraph

    Product

    SOLUTIONS

    customers

    RESOURCES

    start for free

    TIGERGRAPH DB
    • Overview
    • Features
    • GSQL Query Language
    GRAPH DATA SCIENCE
    • Graph Data Science Library
    • Machine Learning Workbench
    TIGERGRAPH CLOUD
    • Overview
    • Cloud Starter Kits
    • Login
    • FAQ
    • Pricing
    • Cloud Marketplaces
    USEr TOOLS
    • GraphStudio
    • TigerGraph Insights
    • Application Workbenches
    • Connectors and Drivers
    • Starter Kits
    • openCypher Support
    SOLUTIONS
    • Why Graph?
    industry
    • Advertising, Media & Entertainment
    • Financial Services
    • Healthcare & Life Sciences
    use cases
    • Benefits
    • Product & Service Marketing
    • Entity Resolution
    • Customer 360/MDM
    • Recommendation Engine
    • Anti-Money Laundering
    • Cybersecurity Threat Detection
    • Fraud Detection
    • Risk Assessment & Monitoring
    • Energy Management
    • Network & IT Management
    • Supply Chain Analysis
    • AI & Machine Learning
    • Geospatial Analysis
    • Time Series Analysis
    success stories
    • Customer Success Stories

    Partners

    Partner program
    • Partner Benefits
    • TigerGraph Partners
    • Sign Up
    LIBRARY
    • Resources
    • Benchmark
    • Webinars
    Events
    • Trade Shows
    • Graph + AI Summit
    • Million Dollar Challenge
    EDUCATION
    • Training & Certifications
    Blog
    • TigerGraph Blog
    DEVELOPERS
    • Developers Hub
    • Community Forum
    • Documentation
    • Ecosystem

    COMPANY

    Company
    • Overview
    • Careers
    • News
    • Press Release
    • Awards
    • Legal
    • Patents
    • Security and Compliance
    • Contact
    Get Started
    • Start Free
    • Compare Editions
    • Online Demo - Test Drive
    • Request a Demo

    Product

    • Overview
    • TigerGraph 3.0
    • TIGERGRAPH DB
    • TIGERGRAPH CLOUD
    • GRAPHSTUDIO
    • TRY NOW

    customers

    • success stories

    RESOURCES

    • LIBRARY
    • Events
    • EDUCATION
    • BLOG
    • DEVELOPERS

    SOLUTIONS

    • SOLUTIONS
    • use cases
    • industry

    Partners

    • partner program

    company

    • Overview
    • news
    • Press Release
    • Awards

    start for free

    • Request Demo
    • take a test drive
    • SUPPORT
    • COMMUNITY
    • CONTACT
    • Copyright © 2023 TigerGraph
    • Privacy Policy
    • Linkedin
    • Facebook
    • Twitter

    Copyright © 2020 TigerGraph | Privacy Policy

    Copyright © 2020 TigerGraph Privacy Policy

    • SUPPORT
    • COMMUNITY
    • COMPANY
    • CONTACT
    • Linkedin
    • Facebook
    • Twitter

    Copyright © 2020 TigerGraph

    Privacy Policy

    • Products
    • Solutions
    • Customers
    • Partners
    • Resources
    • Company
    • START FREE
    START FOR FREE
    START FOR FREE
    TigerGraph
    PRODUCT
    PRODUCT
    • Overview
    • GraphStudio UI
    • Graph Data Science Library
    TIGERGRAPH DB
    • Overview
    • Features
    • GSQL Query Language
    TIGERGRAPH CLOUD
    • Overview
    • Cloud Starter Kits
    TRY TIGERGRAPH
    • Get Started for Free
    • Compare Editions
    SOLUTIONS
    SOLUTIONS
    • Why Graph?
    use cases
    • Benefits
    • Product & Service Marketing
    • Entity Resolution
    • Customer Journey/360
    • Recommendation Engine
    • Anti-Money Laundering (AML)
    • Cybersecurity Threat Detection
    • Fraud Detection
    • Risk Assessment & Monitoring
    • Energy Management
    • Network Resources Optimization
    • Supply Chain Analysis
    • AI & Machine Learning
    • Geospatial Analysis
    • Time Series Analysis
    industry
    • Advertising, Media & Entertainment
    • Financial Services
    • Healthcare & Life Sciences
    CUSTOMERS
    read all success stories


    PARTNERS
    Partner program
    • Partner Benefits
    • TigerGraph Partners
    • Sign Up
    RESOURCES
    LIBRARY
    • Resource Library
    • Benchmark
    • Webinars
    Events
    • Trade Shows
    • Graph + AI Summit
    • Graph for All - Million Dollar Challenge
    EDUCATION
    • TigerGraph Academy
    • Certification
    Blog
    • TigerGraph Blog
    DEVELOPERS
    • Developers Hub
    • Community Forum
    • Documentation
    • Ecosystem
    COMPANY
    COMPANY
    • Overview
    • Leadership
    • Careers  
    NEWS
    PRESS RELEASE
    AWARDS
    START FREE
    Start Free
    • Request a Demo
    • SUPPORT
    • COMMUNITY
    • CONTACT
    Dr. Jay Yu

    Dr. Jay Yu | VP of Product and Innovation

    Dr. Jay Yu is the VP of Product and Innovation at TigerGraph, responsible for driving product strategy and roadmap, as well as fostering innovation in graph database engine and graph solutions. He is a proven hands-on full-stack innovator, strategic thinker, leader, and evangelist for new technology and product, with 25+ years of industry experience ranging from highly scalable distributed database engine company (Teradata), B2B e-commerce services startup, to consumer-facing financial applications company (Intuit). He received his PhD from the University of Wisconsin - Madison, where he specialized in large scale parallel database systems

    Todd Blaschka | COO

    Todd Blaschka is a veteran in the enterprise software industry. He is passionate about creating entirely new segments in data, analytics and AI, with the distinction of establishing graph analytics as a Gartner Top 10 Data & Analytics trend two years in a row. By fervently focusing on critical industry and customer challenges, the companies under Todd's leadership have delivered significant quantifiable results to the largest brands in the world through channel and solution sales approach. Prior to TigerGraph, Todd led go to market and customer experience functions at Clustrix (acquired by MariaDB), Dataguise and IBM.