Skip to content
START FOR FREE
START FOR FREE
  • SUPPORT
  • COMMUNITY
Menu
  • SUPPORT
  • COMMUNITY
MENUMENU
  • Products
    • The World’s Fastest and Most Scalable Graph Platform

      LEARN MORE

      Watch a TigerGraph Demo

      TIGERGRAPH CLOUD

      • Overview
      • TigerGraph Cloud Suite
      • FAQ
      • Pricing

      USER TOOLS

      • GraphStudio
      • Insights
      • Application Workbenches
      • Connectors and Drivers
      • Starter Kits
      • openCypher Support

      TIGERGRAPH DB

      • Overview
      • GSQL Query Language
      • Compare Editions

      GRAPH DATA SCIENCE

      • Graph Data Science Library
      • Machine Learning Workbench
  • Solutions
    • The World’s Fastest and Most Scalable Graph Platform

      LEARN MORE

      Watch a TigerGraph Demo

      Solutions

      • Solutions Overview

      INCREASE REVENUE

      • Customer Journey/360
      • Product Marketing
      • Entity Resolution
      • Recommendation Engine

      MANAGE RISK

      • Fraud Detection
      • Anti-Money Laundering
      • Threat Detection
      • Risk Monitoring

      IMPROVE OPERATIONS

      • Supply Chain Analysis
      • Energy Management
      • Network Optimization

      By Industry

      • Advertising, Media & Entertainment
      • Financial Services
      • Healthcare & Life Sciences

      FOUNDATIONAL

      • AI & Machine Learning
      • Time Series Analysis
      • Geospatial Analysis
  • Customers
    • The World’s Fastest and Most Scalable Graph Platform

      LEARN MORE

      CUSTOMER SUCCESS STORIES

      • Ford
      • Intuit
      • JPMorgan Chase
      • READ MORE SUCCESS STORIES
      • Jaguar Land Rover
      • United Health Group
      • Xbox
  • Partners
    • The World’s Fastest and Most Scalable Graph Platform

      LEARN MORE

      PARTNER PROGRAM

      • Partner Benefits
      • TigerGraph Partners
      • Sign Up
      TigerGraph partners with organizations that offer complementary technology solutions and services.​
  • Resources
    • The World’s Fastest and Most Scalable Graph Platform

      LEARN MORE

      BLOG

      • TigerGraph Blog

      RESOURCES

      • Resource Library
      • Benchmarks
      • Demos
      • O'Reilly Graph + ML Book

      EVENTS & WEBINARS

      • Graph+AI Summit
      • Graph for All - Million Dollar Challenge
      • Events &Trade Shows
      • Webinars

      DEVELOPERS

      • Documentation
      • Ecosystem
      • Developers Hub
      • Community Forum

      SUPPORT

      • Contact Support
      • Production Guidelines

      EDUCATION

      • Training & Certifications
  • Company
    • Join the World’s Fastest and Most Scalable Graph Platform

      WE ARE HIRING

      COMPANY

      • Company Overview
      • Leadership
      • Legal Terms
      • Patents
      • Security and Compliance

      CAREERS

      • Join Us
      • Open Positions

      AWARDS

      • Awards and Recognition
      • Leader in Forrester Wave
      • Gartner Research

      PRESS RELEASE

      • Read All Press Releases
      TigerGraph Reports Exceptional Customer Growth and Product Leadership as More Market-Leading Companies Tap the Power of Graph
      March 1, 2023
      Read More »

      NEWS

      • Read All News
      The-New-Stack-Logo-square

      Multiple Vendors Make Data and Analytics Ubiquitous

      TigerGraph enhances fundamentals in latest platform update

  • START FREE
    • The World’s Fastest and Most Scalable Graph Platform

      GET STARTED

      • Request a Demo
      • CONTACT US
      • Try TigerGraph
      • START FREE
      • TRY AN ONLINE DEMO

It’s Not Just Hype – Graph is Transforming Businesses

  • Todd Blaschka
  • August 26, 2019
  • About TigerGraph, Benchmark, blog, Business, Graph Database Market, Graph Databases
  • Blog >
  • It’s Not Just Hype – Graph is Transforming Businesses

First, the good news.

In a recent report, Top 10 Data and Analytics Technology Trends That Will Change Your Business, Gartner Research identified graph database and analytics as a key technology. Gartner forecasts that, “Graph analytics will grow in the next few years due to the need to ask complex questions across complex data, which is not always practical or even possible at scale using SQL queries.” 

Not only that, graph technology enables other trends described in the same report. Chief amongst these is augmented analytics, which uses machine learning (ML) and artificial intelligence (AI) techniques to transform how analytics content is developed, consumed and shared. Without graph technology augmented analytics would be ill-equipped to offer meaningful insights as graph generates new features based on the relationship analysis to feed the machine learning models and improve their accuracy.

Another study from Gartner, Hype Cycle for Data Management, predicts that graph database management systems (DBMSs), “will increasingly be used to navigate both existing and newly discovered relationships more efficiently than relational processing over the next two to three years.” 

Last, and definitely not least, in its “Hype Cycle for AI” study, Gartner included graph technology in two places on the curve, Knowledge Graphs and Graph Analytics.

 Gartner forecasts that, “The application of graph processing and graph DBMSs will grow at 100 percent annually through 2022 to continuously accelerate data preparation and enable more complex and adaptive data science.”

Clearly, graph technology is hot.

Previous Generations of Graph Technology Haven’t Delivered.

Now for the bad news. 

If you look closely at the Hype Cycle for Data Management mentioned above, you’ll see that Gartner has positioned graph DBMSs at a place on the cycle where it’s heading into the Trough of Disillusionment. Ouch!

Look carefully at the Hype Cycle for AI too, and you will see that, while knowledge graphs are moving towards the Peak of Inflated Expectations, graph analytics is already heading into the Trough of Disillusionment, according to Gartner.

This is because the early generations of graph technology have failed to fully deliver on what they promised.

Scale-out Graph Fulfills the Promise

We are in an age of artificial intelligence that offers the potential for deep learning to uncover new patterns and provide insights that will drive innovation for another 20 years.  Deep learning, however, requires data, lots of data and the more examples of a trait or relation that can be identified, the more accurately deep learning can pick out patterns. 

Graph technology is the perfect fit for this – its expressiveness is ideal for creating business logic algorithms (network analysis, abnormal pattern matching, community detection) across complex data. However, performance and scale have held back graph’s progress. For example, to find deep information about a user may require traversing across many tables, which in turn requires many joins and/or key value look-ups. Results are obtained slowly, if the query completes at all.

With a native parallel graph, on the other hand, all connections are established in the graph at data loading/updating time – no joins are required and queries are typically completed in seconds, or less. We are in the age of Hybrid Transactional Analytical Processing (HTAP) and have a rich library of algorithms that quickly traverse graphs to find insights in real-time. According to Dan McCreary, a respected authority on data analysis, if you’re not leveraging graph algorithms you are missing out.

Driving Unprecedented Innovation

Graph technology is now in its third generation and the following chart shows how the technology has evolved:

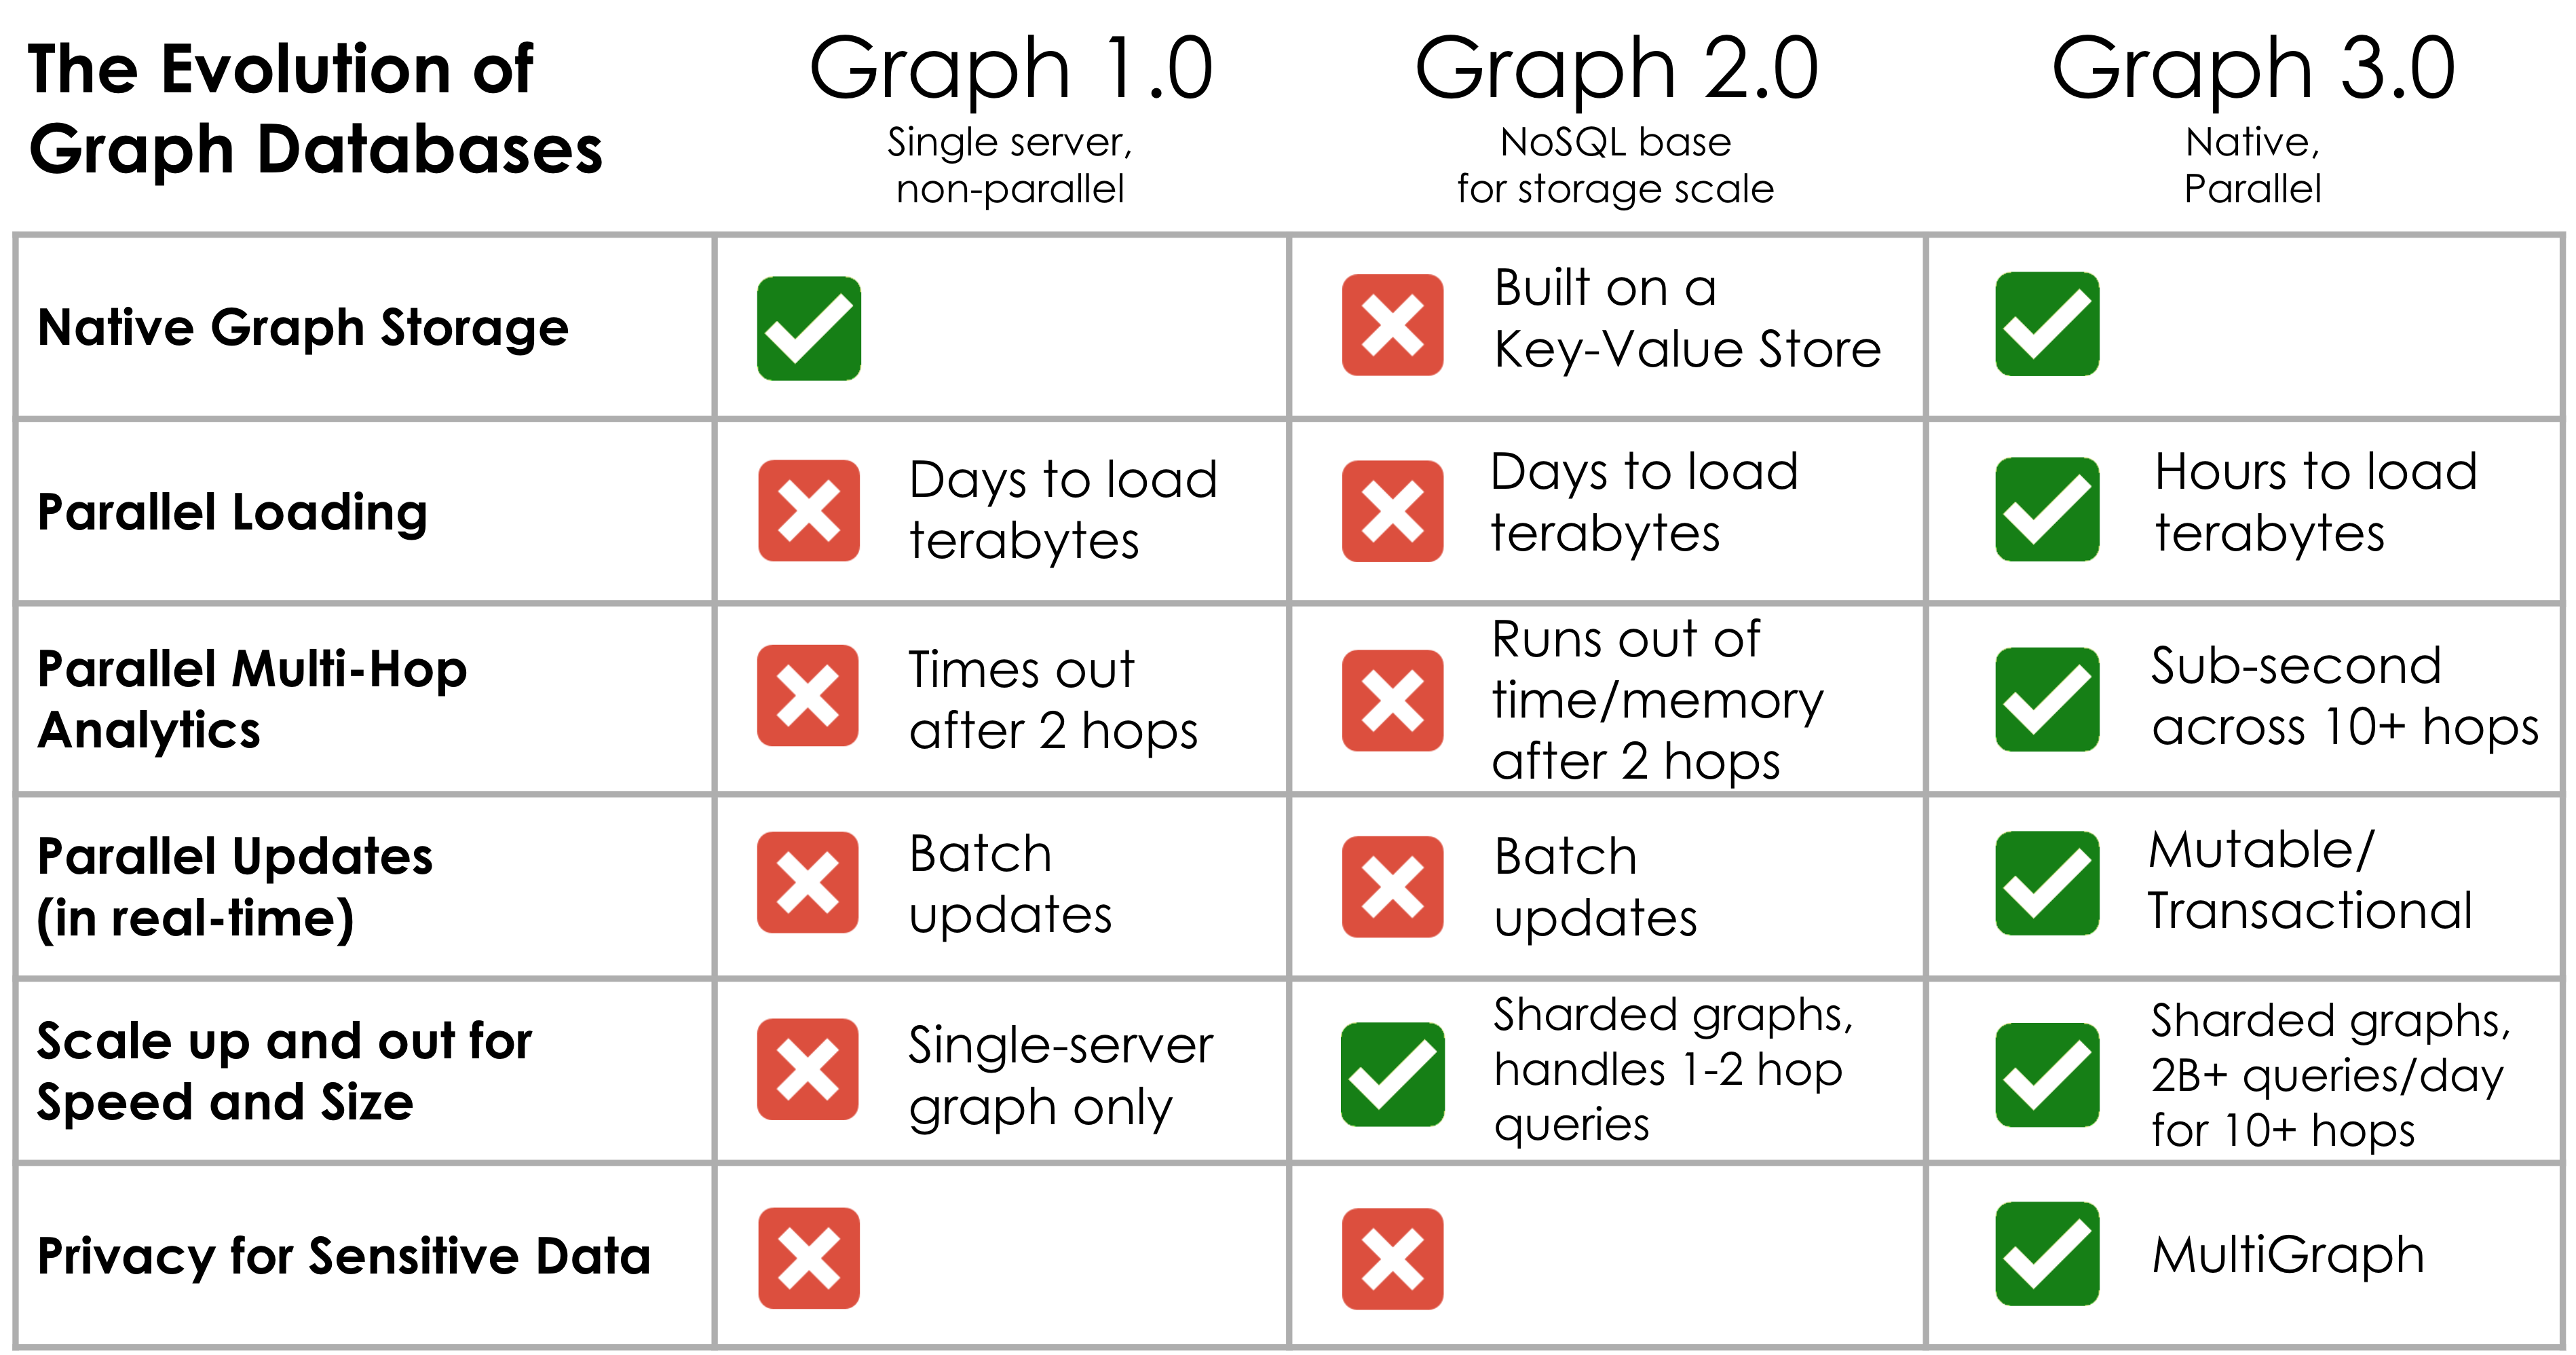
Graph technology has made huge strides. Third-generation graph includes a rich array of functionality that was lacking in earlier versions and is transforming business by providing the data scientists at those organizations with unprecedented abilities to understand the meaning in the connections in their data. Some of the functionality that’s essential includes:

•  Supporting deep link analytics (in other words, going beyond three hops) to reveal connections that are necessary for next-generation fraud detection, recommendation engine, artificial intelligence and machine learning and other use cases.

•  Scaling to multiple CPUs and across multiple machines for storing and parallel query processing of terabytes of data that yield results in seconds or minutes, instead of hours or days.

•  Protecting sensitive data in ways that enable the privacy requirements associated with GDPR and CCPA to be met.

TigerGraph exemplifies third generation graph performance. TigerGraph addresses what Gartner describes as a need for data and analytics leaders to “consider the ecosystem holistically in order to get value most efficiently from your data and analytics landscape” and that “it no longer makes sense to evaluate analytic and operational use cases in isolation.”

Don’t Just Take Our Word For It 

A recent study by researchers at the University of California Merced compared the performance of Graph 3.0 and Graph 1.0 technologies – in this case, TigerGraph and Neo4j. The study was a complete implementation of the Linked Data Benchmark Council Social Network Benchmark (LDBC SNB), considered by many to be the reference standard for evaluating graph technologies.

The research compared the different generations of graph technology in their loading, storage, and execution of 46 queries across a range of short-running (OLTP) and long-running (OLAP) inquiries. The results were revealing, if not unexpected.

The researchers found that the TigerGraph solution consistently outperformed the legacy Neo4j technology, by more than 100 times faster in some instances, with that gap expanding as the amount of data increased. Moreover, the Neo4j technology was unable to complete 13 out of 25 queries within the five-hour time limit.

This independent study aptly demonstrates the following three things:

•  TigerGraph is the first scalable graph technology to demonstrate both analytics and transactional processing capability. 

•  Only TigerGraph could scale to 1TB for deep analytical queries.

•  TigerGraph shows significantly compressed storage on typed property graph data as compared to Neo4j.

Don’t Settle for Legacy Technology

There’s never been a better time to upgrade to graph 3.0 technology.  Businesses who have done so are beginning to outperform their competition. You can read reviews by people just like you who already using our technology here.

You can also take us for a test drive here or consider becoming a Certified TigerGraph Associate – learn more about how to do that here.

Gartner predicts that graph technology will “enable more complex and adaptive data science” but, as we have seen, this will only be possible with third-generation graph technology. TigerGraph’s technology is transforming businesses – don’t be left behind using a legacy system.


You Might Also Like

Trillion edges benchmark: new world record beyond 100TB by TigerGraph featuring AMD based Amazon EC2 instances

Trillion edges benchmark: new world record...

March 13, 2023
Graph Databases 101: Your Top 5 Questions with Non-Technical Answers

Graph Databases 101: Your Top 5...

February 7, 2023
It’s Time to Harness the Power of Graph Technology [Infographic]

It’s Time to Harness the Power...

January 25, 2023

Introducing TigerGraph 3.0

July 1, 2020

Everything to Know to Pass your TigerGraph Certification Test

June 24, 2020

Neo4j 4.0 Fabric – A Look Behind the Curtain

February 7, 2020

TigerGraph Blog

  • Categories
    • blogs
      • About TigerGraph
      • Benchmark
      • Business
      • Community
      • Compliance
      • Customer
      • Customer 360
      • Cybersecurity
      • Developers
      • Digital Twin
      • eCommerce
      • Emerging Use Cases
      • Entity Resolution
      • Finance
      • Fraud / Anti-Money Laundering
      • GQL
      • Graph Database Market
      • Graph Databases
      • GSQL
      • Healthcare
      • Machine Learning / AI
      • Podcast
      • Supply Chain
      • TigerGraph
      • TigerGraph Cloud
    • Graph AI On Demand
      • Analysts and Research
      • Customer 360 and Entity Resolution
      • Customer Spotlight
      • Development
      • Finance, Banking, Insurance
      • Keynote
      • Session
    • Video
  • Recent Posts

    • Trillion edges benchmark: new world record beyond 100TB by TigerGraph featuring AMD based Amazon EC2 instances
    • Overview of Graph and Machine Learning with TigerGraph | Mar 8 @ 11am PST
    • Gartner Data & Analytics Summit 2023, London
    • Gartner Data and Analytics Summit, Orlando
    • Transaction Surveillance with Maximum Flow Algorithm
    TigerGraph

    Product

    SOLUTIONS

    customers

    RESOURCES

    start for free

    TIGERGRAPH DB
    • Overview
    • Features
    • GSQL Query Language
    GRAPH DATA SCIENCE
    • Graph Data Science Library
    • Machine Learning Workbench
    TIGERGRAPH CLOUD
    • Overview
    • Cloud Starter Kits
    • Login
    • FAQ
    • Pricing
    • Cloud Marketplaces
    USEr TOOLS
    • GraphStudio
    • TigerGraph Insights
    • Application Workbenches
    • Connectors and Drivers
    • Starter Kits
    • openCypher Support
    SOLUTIONS
    • Why Graph?
    industry
    • Advertising, Media & Entertainment
    • Financial Services
    • Healthcare & Life Sciences
    use cases
    • Benefits
    • Product & Service Marketing
    • Entity Resolution
    • Customer 360/MDM
    • Recommendation Engine
    • Anti-Money Laundering
    • Cybersecurity Threat Detection
    • Fraud Detection
    • Risk Assessment & Monitoring
    • Energy Management
    • Network & IT Management
    • Supply Chain Analysis
    • AI & Machine Learning
    • Geospatial Analysis
    • Time Series Analysis
    success stories
    • Customer Success Stories

    Partners

    Partner program
    • Partner Benefits
    • TigerGraph Partners
    • Sign Up
    LIBRARY
    • Resources
    • Benchmark
    • Webinars
    Events
    • Trade Shows
    • Graph + AI Summit
    • Million Dollar Challenge
    EDUCATION
    • Training & Certifications
    Blog
    • TigerGraph Blog
    DEVELOPERS
    • Developers Hub
    • Community Forum
    • Documentation
    • Ecosystem

    COMPANY

    Company
    • Overview
    • Careers
    • News
    • Press Release
    • Awards
    • Legal
    • Patents
    • Security and Compliance
    • Contact
    Get Started
    • Start Free
    • Compare Editions
    • Online Demo - Test Drive
    • Request a Demo

    Product

    • Overview
    • TigerGraph 3.0
    • TIGERGRAPH DB
    • TIGERGRAPH CLOUD
    • GRAPHSTUDIO
    • TRY NOW

    customers

    • success stories

    RESOURCES

    • LIBRARY
    • Events
    • EDUCATION
    • BLOG
    • DEVELOPERS

    SOLUTIONS

    • SOLUTIONS
    • use cases
    • industry

    Partners

    • partner program

    company

    • Overview
    • news
    • Press Release
    • Awards

    start for free

    • Request Demo
    • take a test drive
    • SUPPORT
    • COMMUNITY
    • CONTACT
    • Copyright © 2023 TigerGraph
    • Privacy Policy
    • Linkedin
    • Facebook
    • Twitter

    Copyright © 2020 TigerGraph | Privacy Policy

    Copyright © 2020 TigerGraph Privacy Policy

    • SUPPORT
    • COMMUNITY
    • COMPANY
    • CONTACT
    • Linkedin
    • Facebook
    • Twitter

    Copyright © 2020 TigerGraph

    Privacy Policy

    • Products
    • Solutions
    • Customers
    • Partners
    • Resources
    • Company
    • START FREE
    START FOR FREE
    START FOR FREE
    TigerGraph
    PRODUCT
    PRODUCT
    • Overview
    • GraphStudio UI
    • Graph Data Science Library
    TIGERGRAPH DB
    • Overview
    • Features
    • GSQL Query Language
    TIGERGRAPH CLOUD
    • Overview
    • Cloud Starter Kits
    TRY TIGERGRAPH
    • Get Started for Free
    • Compare Editions
    SOLUTIONS
    SOLUTIONS
    • Why Graph?
    use cases
    • Benefits
    • Product & Service Marketing
    • Entity Resolution
    • Customer Journey/360
    • Recommendation Engine
    • Anti-Money Laundering (AML)
    • Cybersecurity Threat Detection
    • Fraud Detection
    • Risk Assessment & Monitoring
    • Energy Management
    • Network Resources Optimization
    • Supply Chain Analysis
    • AI & Machine Learning
    • Geospatial Analysis
    • Time Series Analysis
    industry
    • Advertising, Media & Entertainment
    • Financial Services
    • Healthcare & Life Sciences
    CUSTOMERS
    read all success stories


    PARTNERS
    Partner program
    • Partner Benefits
    • TigerGraph Partners
    • Sign Up
    RESOURCES
    LIBRARY
    • Resource Library
    • Benchmark
    • Webinars
    Events
    • Trade Shows
    • Graph + AI Summit
    • Graph for All - Million Dollar Challenge
    EDUCATION
    • TigerGraph Academy
    • Certification
    Blog
    • TigerGraph Blog
    DEVELOPERS
    • Developers Hub
    • Community Forum
    • Documentation
    • Ecosystem
    COMPANY
    COMPANY
    • Overview
    • Leadership
    • Careers  
    NEWS
    PRESS RELEASE
    AWARDS
    START FREE
    Start Free
    • Request a Demo
    • SUPPORT
    • COMMUNITY
    • CONTACT
    Dr. Jay Yu

    Dr. Jay Yu | VP of Product and Innovation

    Dr. Jay Yu is the VP of Product and Innovation at TigerGraph, responsible for driving product strategy and roadmap, as well as fostering innovation in graph database engine and graph solutions. He is a proven hands-on full-stack innovator, strategic thinker, leader, and evangelist for new technology and product, with 25+ years of industry experience ranging from highly scalable distributed database engine company (Teradata), B2B e-commerce services startup, to consumer-facing financial applications company (Intuit). He received his PhD from the University of Wisconsin - Madison, where he specialized in large scale parallel database systems

    Todd Blaschka | COO

    Todd Blaschka is a veteran in the enterprise software industry. He is passionate about creating entirely new segments in data, analytics and AI, with the distinction of establishing graph analytics as a Gartner Top 10 Data & Analytics trend two years in a row. By fervently focusing on critical industry and customer challenges, the companies under Todd's leadership have delivered significant quantifiable results to the largest brands in the world through channel and solution sales approach. Prior to TigerGraph, Todd led go to market and customer experience functions at Clustrix (acquired by MariaDB), Dataguise and IBM.