Skip to content
START FOR FREE
START FOR FREE
  • SUPPORT
  • COMMUNITY
Menu
  • SUPPORT
  • COMMUNITY
MENUMENU
  • Products
    • The World’s Fastest and Most Scalable Graph Platform

      LEARN MORE

      Watch a TigerGraph Demo

      TIGERGRAPH CLOUD

      • Overview
      • TigerGraph Cloud Suite
      • FAQ
      • Pricing

      USER TOOLS

      • GraphStudio
      • Insights
      • Application Workbenches
      • Connectors and Drivers
      • Starter Kits
      • openCypher Support

      TIGERGRAPH DB

      • Overview
      • GSQL Query Language
      • Compare Editions

      GRAPH DATA SCIENCE

      • Graph Data Science Library
      • Machine Learning Workbench
  • Solutions
    • The World’s Fastest and Most Scalable Graph Platform

      LEARN MORE

      Watch a TigerGraph Demo

      Solutions

      • Solutions Overview

      INCREASE REVENUE

      • Customer Journey/360
      • Product Marketing
      • Entity Resolution
      • Recommendation Engine

      MANAGE RISK

      • Fraud Detection
      • Anti-Money Laundering
      • Threat Detection
      • Risk Monitoring

      IMPROVE OPERATIONS

      • Supply Chain Analysis
      • Energy Management
      • Network Optimization

      By Industry

      • Advertising, Media & Entertainment
      • Financial Services
      • Healthcare & Life Sciences

      FOUNDATIONAL

      • AI & Machine Learning
      • Time Series Analysis
      • Geospatial Analysis
  • Customers
    • The World’s Fastest and Most Scalable Graph Platform

      LEARN MORE

      CUSTOMER SUCCESS STORIES

      • Ford
      • Intuit
      • JPMorgan Chase
      • READ MORE SUCCESS STORIES
      • Jaguar Land Rover
      • United Health Group
      • Xbox
  • Partners
    • The World’s Fastest and Most Scalable Graph Platform

      LEARN MORE

      PARTNER PROGRAM

      • Partner Benefits
      • TigerGraph Partners
      • Sign Up
      TigerGraph partners with organizations that offer complementary technology solutions and services.​
  • Resources
    • The World’s Fastest and Most Scalable Graph Platform

      LEARN MORE

      BLOG

      • TigerGraph Blog

      RESOURCES

      • Resource Library
      • Benchmarks
      • Demos
      • O'Reilly Graph + ML Book

      EVENTS & WEBINARS

      • Graph+AI Summit
      • Graph for All - Million Dollar Challenge
      • Events &Trade Shows
      • Webinars

      DEVELOPERS

      • Documentation
      • Ecosystem
      • Developers Hub
      • Community Forum

      SUPPORT

      • Contact Support
      • Production Guidelines

      EDUCATION

      • Training & Certifications
  • Company
    • Join the World’s Fastest and Most Scalable Graph Platform

      WE ARE HIRING

      COMPANY

      • Company Overview
      • Leadership
      • Legal Terms
      • Patents
      • Security and Compliance

      CAREERS

      • Join Us
      • Open Positions

      AWARDS

      • Awards and Recognition
      • Leader in Forrester Wave
      • Gartner Research

      PRESS RELEASE

      • Read All Press Releases
      TigerGraph Recognized in 2022 Gartner® Critical Capabilities for Cloud Database Management Systems for Analytical Use Cases
      January 12, 2023
      Read More »

      NEWS

      • Read All News

      A Shock to the System: ShockNet Predicts How Economic Shocks Could Affect the World Economy

      TigerGraph Recognized for the First Time in the 2022 Gartner® Magic Quadrant™ for Cloud Database Management Systems

  • START FREE
    • The World’s Fastest and Most Scalable Graph Platform

      GET STARTED

      • Request a Demo
      • CONTACT US
      • Try TigerGraph
      • START FREE
      • TRY AN ONLINE DEMO

Leveraging Geospatial Data with a Native Parallel Graph Database

  • Emily McAuliffe
  • February 5, 2019
  • blog, Developers, Graph Database Market, Graph Databases
  • Blog >
  • Leveraging Geospatial Data with a Native Parallel Graph Database

Paradigm Shift Enables TigerGraph to Uncover Hidden Insights from Geolocation Data

Have you wondered how you can add and leverage geospatial data to your applications? There is a massive amount of value untapped in this space. In 2017, the geospatial analytics market reached $38.65 billion. It is estimated to grow at an annual rate of 18.2%, and by 2027, the entire geoanalytics market will reach $174.65 billion. The large return on investment (ROI) associated with adding geospatial insights to your business has sparked the interest of 78% of C-level executives who are now considering investing in location data. As a startup founder, or a product owner at your company, geo-related data initiatives should be a no-brainer. To understand the scale of the market, check out the TigerGraph geospatial solutions page.

Some of my observations about the big data industry:

  • We collect data, but we don’t fully use the data.
  • The traditional solutions find it too difficult to integrate the collected data, so we pipe it into a data lake, put it to sleep, to waste away.

Recently, my mindset towards the geospatial analytics field has changed. Coming from the relational world, then navigating through document DBMS and multi-modal DBMS, I experienced a paradigm shift when I arrived at TigerGraph, particularly pertaining to how we leverage location data. In the past, you may not have considered location data because the implementation requires additional geospatial software to handle the analytical workload, or a third party index in addition to your DBMS engine. A graph database, on the other hand, naturally models an unbounded number of dimensions, including organization hierarchy, time dimension, and location/geospatial hierarchy.  In particular, I realized that TigerGraph’s real-time deep link analytics opens up the solution space and uncovers the hidden insights from collected location data.

Design For Future

The pain points have always been around the inflexible schema and architecture in traditional data management systems. You may need to rethink your architecture all the way to design for now and the future. There is no exception when we brainstorm about geospatial applications.

From the technology side, a modern platform like TigerGraph allows us to design for the future with flexible architecture and a performant engine. Geospatial analytics is essential to fulfill the potential of the Internet of Things, Artificial Intelligence, Autonomous Driving and Edge Computing. These applications will require TigerGraph’s real-time deep link analytics from geospatial data. As a hybrid OLAP and OLTP graph database engine, TigerGraph is a future-proofing technology choice. I am excited to see more geo-enriched applications in the future based on TigerGraph.

Technical Approach

In our Graph Guru 8 webinar, we give you a detailed look at our GeoGraph reference design for a geospatial search application based on TigerGraph. Here’s a quick preview of GeoGraph:

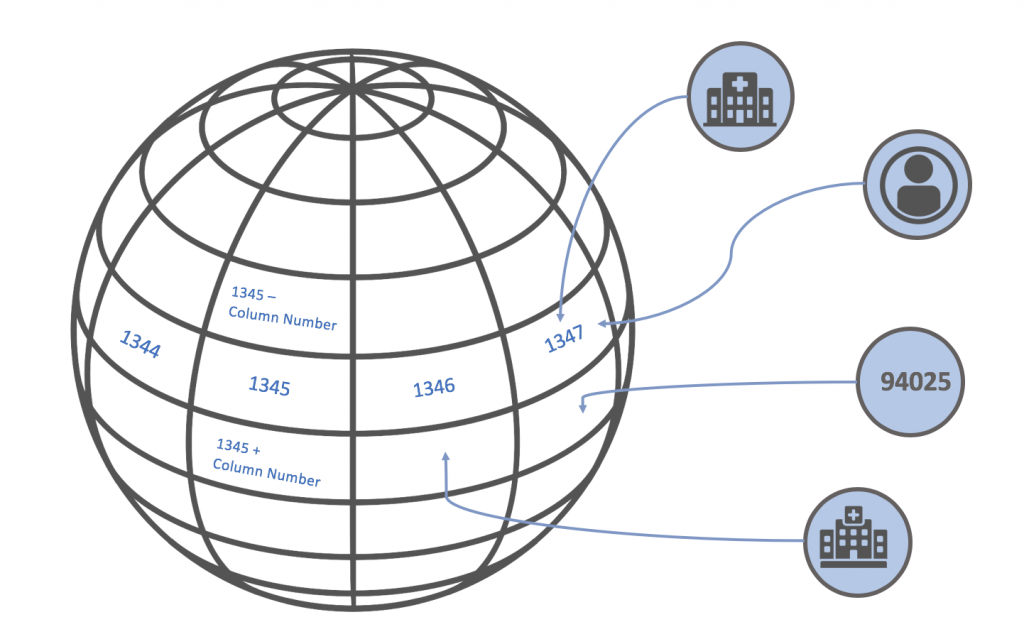
  1. Partition the earth into a grid of bounding boxes or cells. Boxes that follow latitude and longitude lines are the most straightforward.
  2. Represent each box by a vertex in the graph.
  3. Assign each grid box an ID, which is x + y*c, where (x,y) is its location in the grid, and c is the number of columns.
  4. For each Object vertex having geolocation data, create an edge between the Object vertex and the grid vertex corresponding to its geolocation..

Visually, each grid cell or each object is represented as a vertex, and it is connected to nearby object vertices with location edges. See the following diagram for details. “Object” here can be people, things, vehicles, sensors, or anything else with a geolocation.

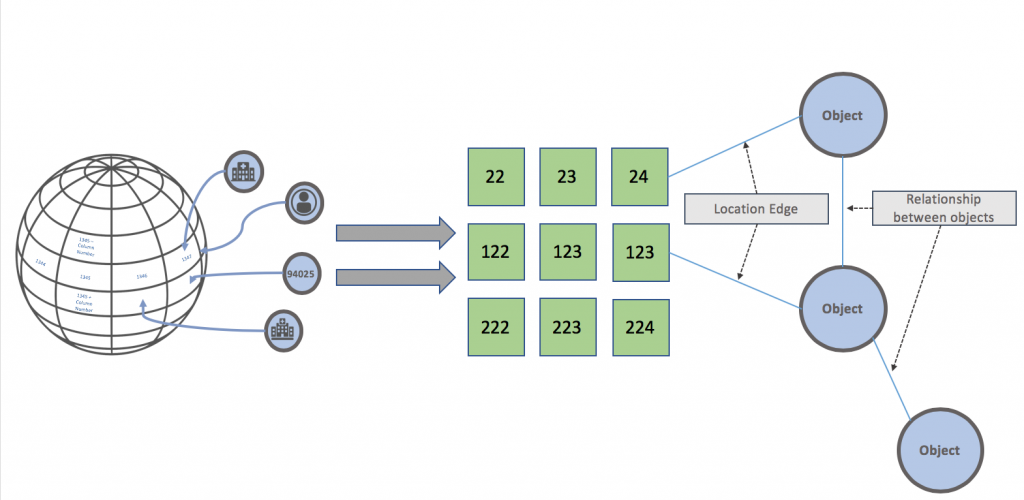
Then, when searching for objects close to a given Object or location, we can use the GeoGraph to instantly find the set of Objects that are within the same geocell, as well as those in neighboring cells.

The current implementation is very lightweight and elegant, which demonstrates the versatile nature of the TigerGraph engine. I encourage readers to follow our solution engineer Xinyu Chang’s instructions to design the graph schema, map the data, write the GSQL queries to recreate the application (see instructions via github).

Next Steps

To learn more about how TigerGraph can leverage your geospatial data:

  • Visit our new solutions page on Geospatial Analysis.
  • Listen to our Graph Gurus episode on Geospatial Analysis with a Native Parallel Graph Database.
  • Experiment with the dataset from our Graph Gurus webinar using TigerGraph’s Developer Edition and build a proof-of-concept Geospatial Search application.

Also stay tuned for Part 2 of this blog topic: Implementing GeoGraph on a Native Parallel Graph Database.

You Might Also Like

TigerGraph Showcases Unrivaled Performance at Scale

TigerGraph Showcases Unrivaled Performance at Scale

January 12, 2023
How to Create a Visual Graph Analytics Application Using TigerGraph Insights in 30 mins

How to Create a Visual Graph...

November 14, 2022
Turbocharge your business intelligence with TigerGraph’s ML Workbench on TigerGraph Cloud

Turbocharge your business intelligence with TigerGraph’s...

November 14, 2022

Introducing TigerGraph 3.0

July 1, 2020

Everything to Know to Pass your TigerGraph Certification Test

June 24, 2020

Neo4j 4.0 Fabric – A Look Behind the Curtain

February 7, 2020

TigerGraph Blog

  • Categories
    • blogs
      • About TigerGraph
      • Benchmark
      • Business
      • Community
      • Compliance
      • Customer
      • Customer 360
      • Cybersecurity
      • Developers
      • Digital Twin
      • eCommerce
      • Emerging Use Cases
      • Entity Resolution
      • Finance
      • Fraud / Anti-Money Laundering
      • GQL
      • Graph Database Market
      • Graph Databases
      • GSQL
      • Healthcare
      • Machine Learning / AI
      • Podcast
      • Supply Chain
      • TigerGraph
      • TigerGraph Cloud
    • Graph AI On Demand
      • Analysts and Research
      • Customer 360 and Entity Resolution
      • Customer Spotlight
      • Development
      • Finance, Banking, Insurance
      • Keynote
      • Session
    • Video
  • Recent Posts

    • It’s Time to Harness the Power of Graph Technology [Infographic]
    • TigerGraph Showcases Unrivaled Performance at Scale
    • TigerGraph 101 An Introduction to Graph | Jan 26th @ 9am PST
    • Data Science Salon New York
    • Tech For Retail
    TigerGraph

    Product

    SOLUTIONS

    customers

    RESOURCES

    start for free

    TIGERGRAPH DB
    • Overview
    • Features
    • GSQL Query Language
    GRAPH DATA SCIENCE
    • Graph Data Science Library
    • Machine Learning Workbench
    TIGERGRAPH CLOUD
    • Overview
    • Cloud Starter Kits
    • Login
    • FAQ
    • Pricing
    • Cloud Marketplaces
    USEr TOOLS
    • GraphStudio
    • TigerGraph Insights
    • Application Workbenches
    • Connectors and Drivers
    • Starter Kits
    • openCypher Support
    SOLUTIONS
    • Why Graph?
    industry
    • Advertising, Media & Entertainment
    • Financial Services
    • Healthcare & Life Sciences
    use cases
    • Benefits
    • Product & Service Marketing
    • Entity Resolution
    • Customer 360/MDM
    • Recommendation Engine
    • Anti-Money Laundering
    • Cybersecurity Threat Detection
    • Fraud Detection
    • Risk Assessment & Monitoring
    • Energy Management
    • Network & IT Management
    • Supply Chain Analysis
    • AI & Machine Learning
    • Geospatial Analysis
    • Time Series Analysis
    success stories
    • Customer Success Stories

    Partners

    Partner program
    • Partner Benefits
    • TigerGraph Partners
    • Sign Up
    LIBRARY
    • Resources
    • Benchmark
    • Webinars
    Events
    • Trade Shows
    • Graph + AI Summit
    • Million Dollar Challenge
    EDUCATION
    • Training & Certifications
    Blog
    • TigerGraph Blog
    DEVELOPERS
    • Developers Hub
    • Community Forum
    • Documentation
    • Ecosystem

    COMPANY

    Company
    • Overview
    • Careers
    • News
    • Press Release
    • Awards
    • Legal
    • Patents
    • Security and Compliance
    • Contact
    Get Started
    • Start Free
    • Compare Editions
    • Online Demo - Test Drive
    • Request a Demo

    Product

    • Overview
    • TigerGraph 3.0
    • TIGERGRAPH DB
    • TIGERGRAPH CLOUD
    • GRAPHSTUDIO
    • TRY NOW

    customers

    • success stories

    RESOURCES

    • LIBRARY
    • Events
    • EDUCATION
    • BLOG
    • DEVELOPERS

    SOLUTIONS

    • SOLUTIONS
    • use cases
    • industry

    Partners

    • partner program

    company

    • Overview
    • news
    • Press Release
    • Awards

    start for free

    • Request Demo
    • take a test drive
    • SUPPORT
    • COMMUNITY
    • CONTACT
    • Copyright © 2023 TigerGraph
    • Privacy Policy
    • Linkedin
    • Facebook
    • Twitter

    Copyright © 2020 TigerGraph | Privacy Policy

    Copyright © 2020 TigerGraph Privacy Policy

    • SUPPORT
    • COMMUNITY
    • COMPANY
    • CONTACT
    • Linkedin
    • Facebook
    • Twitter

    Copyright © 2020 TigerGraph

    Privacy Policy

    • Products
    • Solutions
    • Customers
    • Partners
    • Resources
    • Company
    • START FREE
    START FOR FREE
    START FOR FREE
    TigerGraph
    PRODUCT
    PRODUCT
    • Overview
    • GraphStudio UI
    • Graph Data Science Library
    TIGERGRAPH DB
    • Overview
    • Features
    • GSQL Query Language
    TIGERGRAPH CLOUD
    • Overview
    • Cloud Starter Kits
    TRY TIGERGRAPH
    • Get Started for Free
    • Compare Editions
    SOLUTIONS
    SOLUTIONS
    • Why Graph?
    use cases
    • Benefits
    • Product & Service Marketing
    • Entity Resolution
    • Customer Journey/360
    • Recommendation Engine
    • Anti-Money Laundering (AML)
    • Cybersecurity Threat Detection
    • Fraud Detection
    • Risk Assessment & Monitoring
    • Energy Management
    • Network Resources Optimization
    • Supply Chain Analysis
    • AI & Machine Learning
    • Geospatial Analysis
    • Time Series Analysis
    industry
    • Advertising, Media & Entertainment
    • Financial Services
    • Healthcare & Life Sciences
    CUSTOMERS
    read all success stories


    PARTNERS
    Partner program
    • Partner Benefits
    • TigerGraph Partners
    • Sign Up
    RESOURCES
    LIBRARY
    • Resource Library
    • Benchmark
    • Webinars
    Events
    • Trade Shows
    • Graph + AI Summit
    • Graph for All - Million Dollar Challenge
    EDUCATION
    • TigerGraph Academy
    • Certification
    Blog
    • TigerGraph Blog
    DEVELOPERS
    • Developers Hub
    • Community Forum
    • Documentation
    • Ecosystem
    COMPANY
    COMPANY
    • Overview
    • Leadership
    • Careers  
    NEWS
    PRESS RELEASE
    AWARDS
    START FREE
    Start Free
    • Request a Demo
    • SUPPORT
    • COMMUNITY
    • CONTACT
    Dr. Jay Yu

    Dr. Jay Yu | VP of Product and Innovation

    Dr. Jay Yu is the VP of Product and Innovation at TigerGraph, responsible for driving product strategy and roadmap, as well as fostering innovation in graph database engine and graph solutions. He is a proven hands-on full-stack innovator, strategic thinker, leader, and evangelist for new technology and product, with 25+ years of industry experience ranging from highly scalable distributed database engine company (Teradata), B2B e-commerce services startup, to consumer-facing financial applications company (Intuit). He received his PhD from the University of Wisconsin - Madison, where he specialized in large scale parallel database systems

    Todd Blaschka | COO

    Todd Blaschka is a veteran in the enterprise software industry. He is passionate about creating entirely new segments in data, analytics and AI, with the distinction of establishing graph analytics as a Gartner Top 10 Data & Analytics trend two years in a row. By fervently focusing on critical industry and customer challenges, the companies under Todd's leadership have delivered significant quantifiable results to the largest brands in the world through channel and solution sales approach. Prior to TigerGraph, Todd led go to market and customer experience functions at Clustrix (acquired by MariaDB), Dataguise and IBM.