


If you’re reading this and thinking what is Graph?
A few resources to enlighten you on your journey to learning graph:
– What is a graph database and why should you care?
This blog post will walk you through:
– Creating your first TigerGraph Instance
– Getting started with TigerGraph Cloud Portal
– Getting started with GraphStudio
Creating You First TigerGraph Instance (3 Steps)
Note: If you’re super fast you can deploy a free instance in less than 1 minute!
Step 0) Create an account at tgcloud.io
Okay, you caught me this is an extra step, but I swear once you’re logged in there are ONLY three steps (before you hit “Submit”)
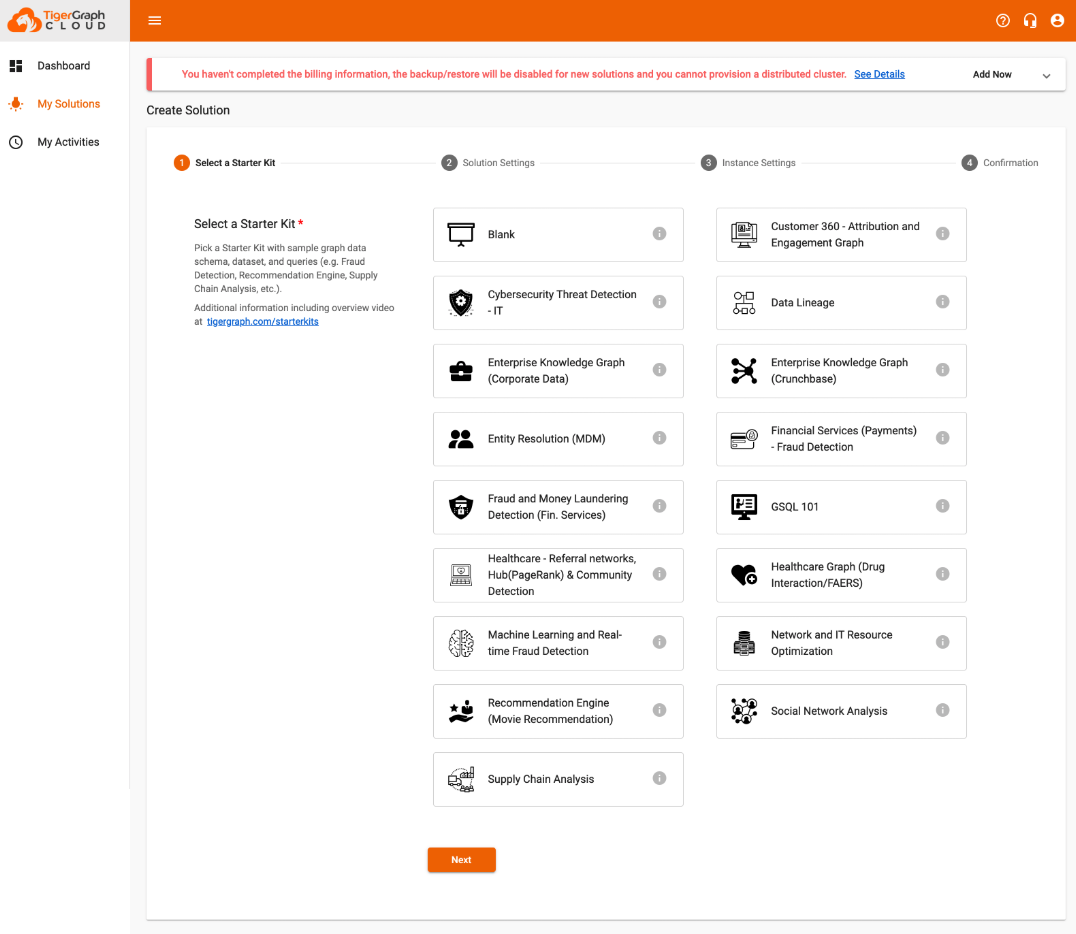
Step 1) Navigate to “My Solutions” & click “CREATE SOLUTION”
Once you see the screen shown below choose one of the prebuilt “Starter Kits”, or you also have the option of choosing a “blank” graph.
If you are creating an instance for GSQL 101 Certification, I would recommend the “GSQL 101” graph.
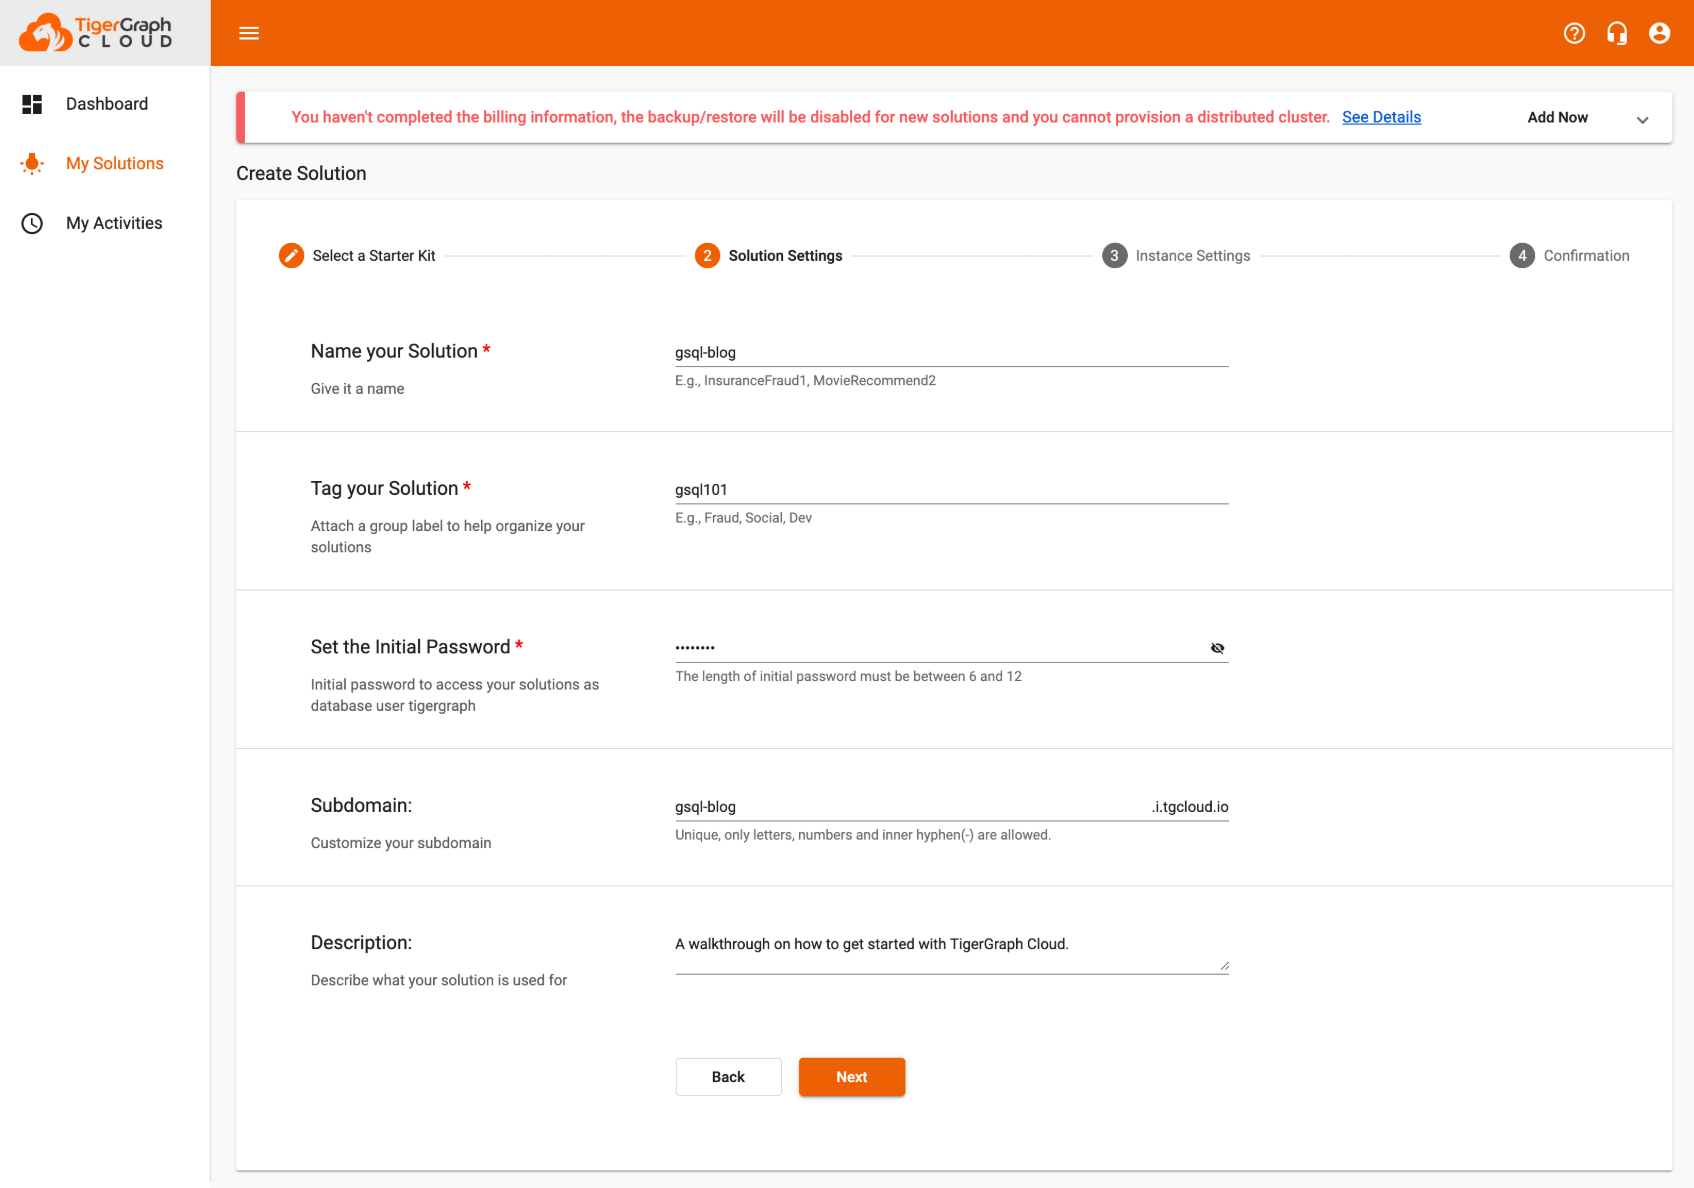
Step 2) Add Solution Settings
Here you will be able to give a name & sub-domain of your choosing to your solution. Once you finish filling the fields out hit “next”.
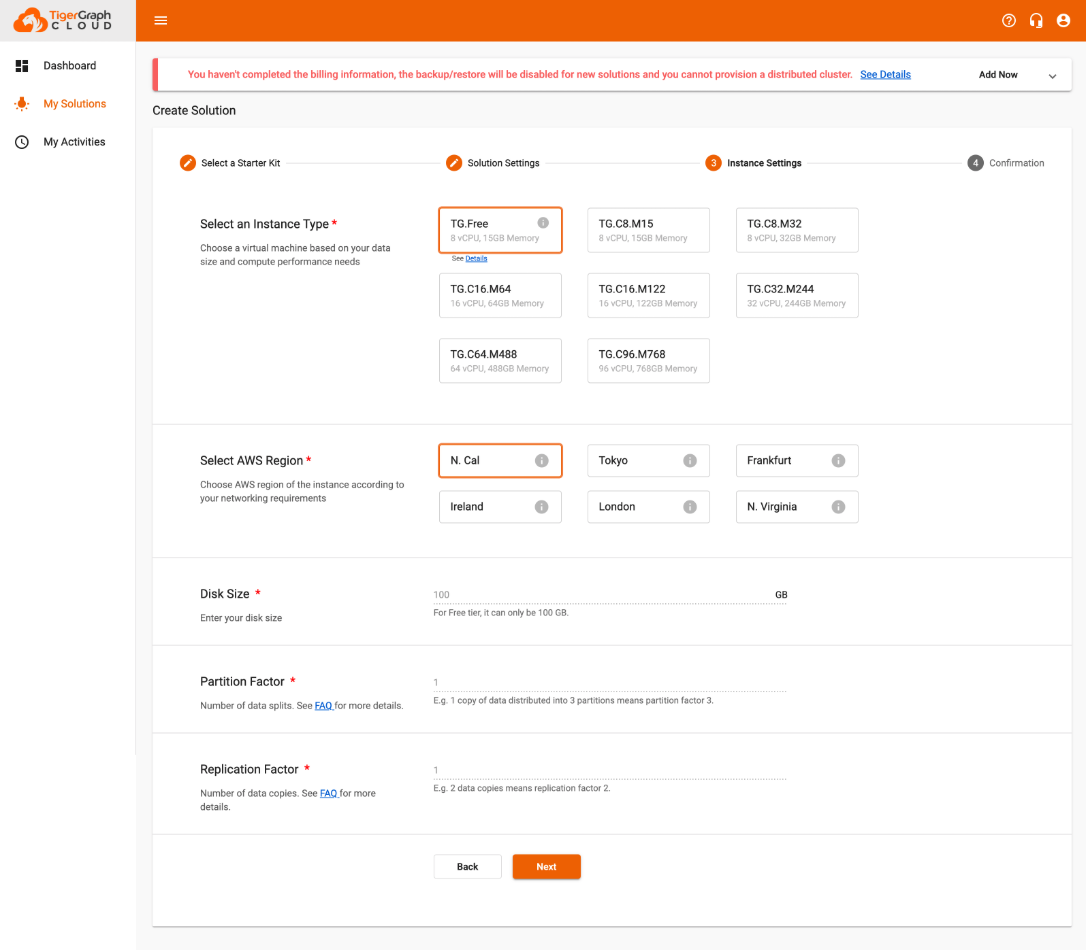
Step 3) Select your Instance Settings
If you would like to give TigerGraph a test choose the “TG.Free” option. Once you finish hit “next” & “submit” if everything looks good!
Because it’s free, if your graph is inactive for more than 2 hours it will spin down your solution to save resources.
It really was that simple! Probably the simplest provisioning process that you’ve ever dealt with!
At this point you will now have a Full Function Graph Solution, now what?
Getting Started with TigerGraph Cloud Portal
When you log in to your cloud solution for the first time, you will arrive at your dashboard (see image below).
Don’t worry, the screen may look slightly different, but once you provision your first Graph Instance it will populate.
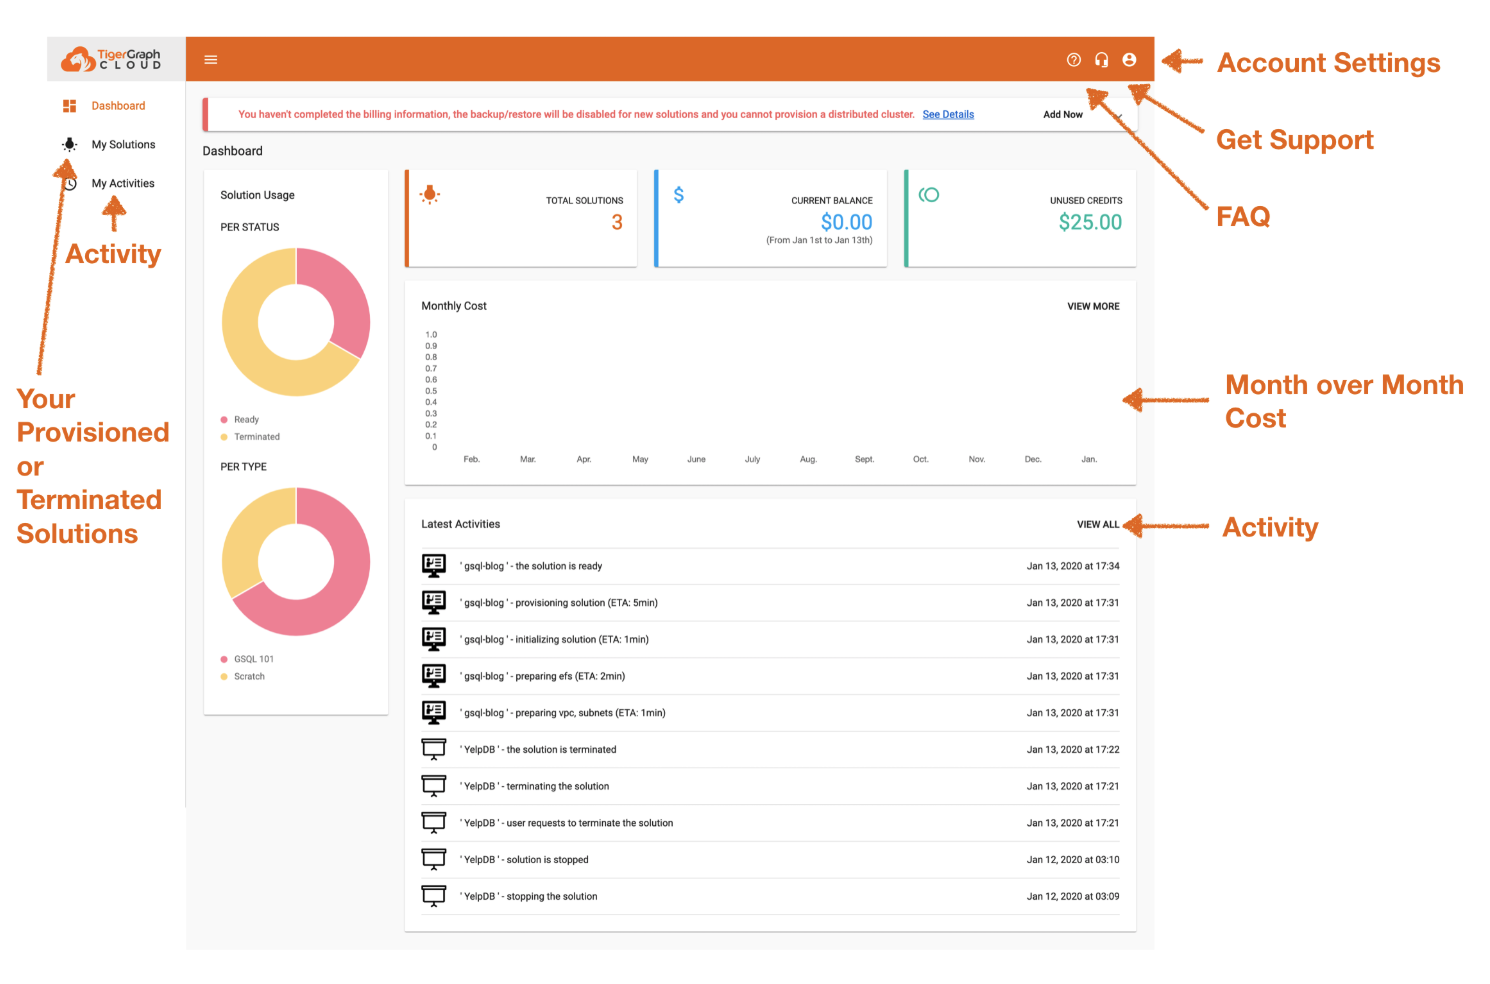
1. Let’s begin to explore.
Top Right: You will see your profile (account settings) this is where you can update your portal account.
Left Side: You will see the various tabs including:
- “My Solution” which is the main tab you will be interacting with that includes all the details on your instances that you have provisioned.
- “My Activities” a place to see what is activity around your instances.
2. Let’s click on “My Solutions”
If you’ve already completed the provisioning of a server, you should see something similar to the image below.
If it is blank check out this blog on how to get an instance built for free in a few minutes.
3. Let’s begin to explore.
Click around on some of the icons below. Done?
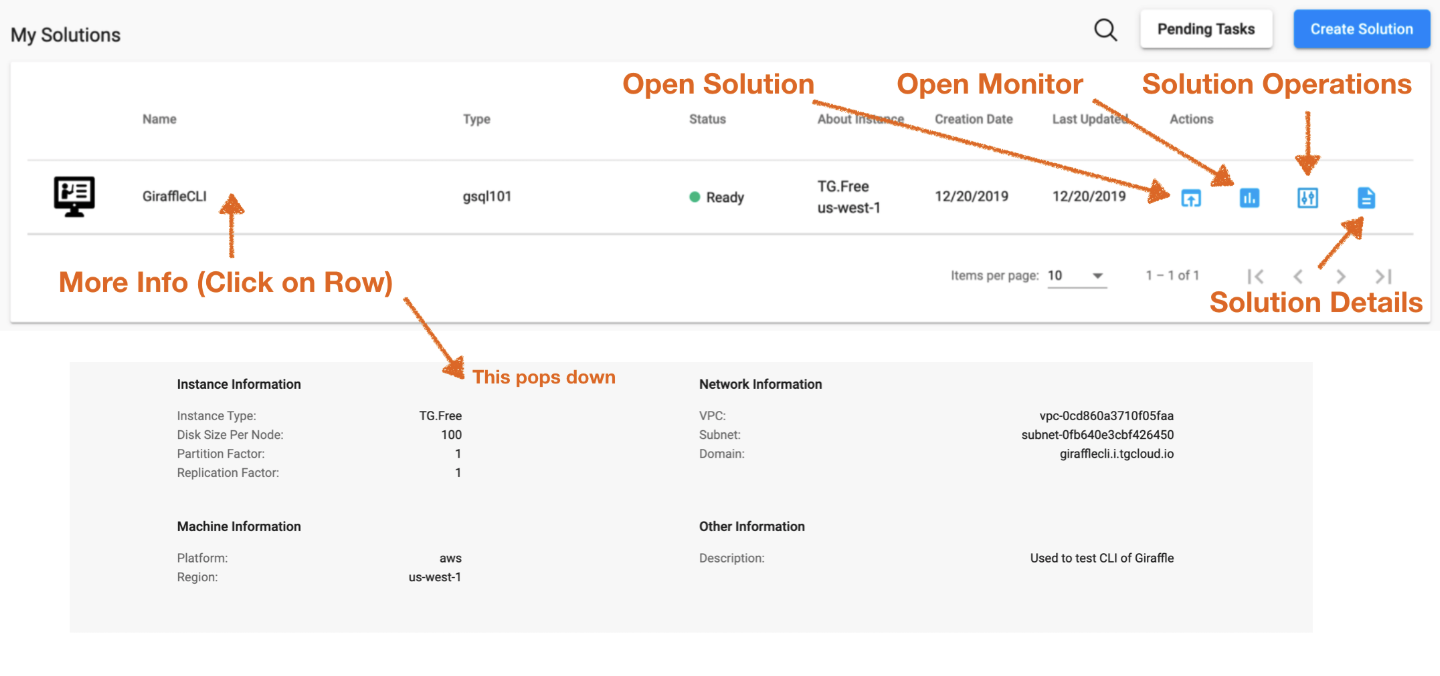
4. Let’s get to the fun part by clicking the “Open Solution”
Getting Started with GraphStudio
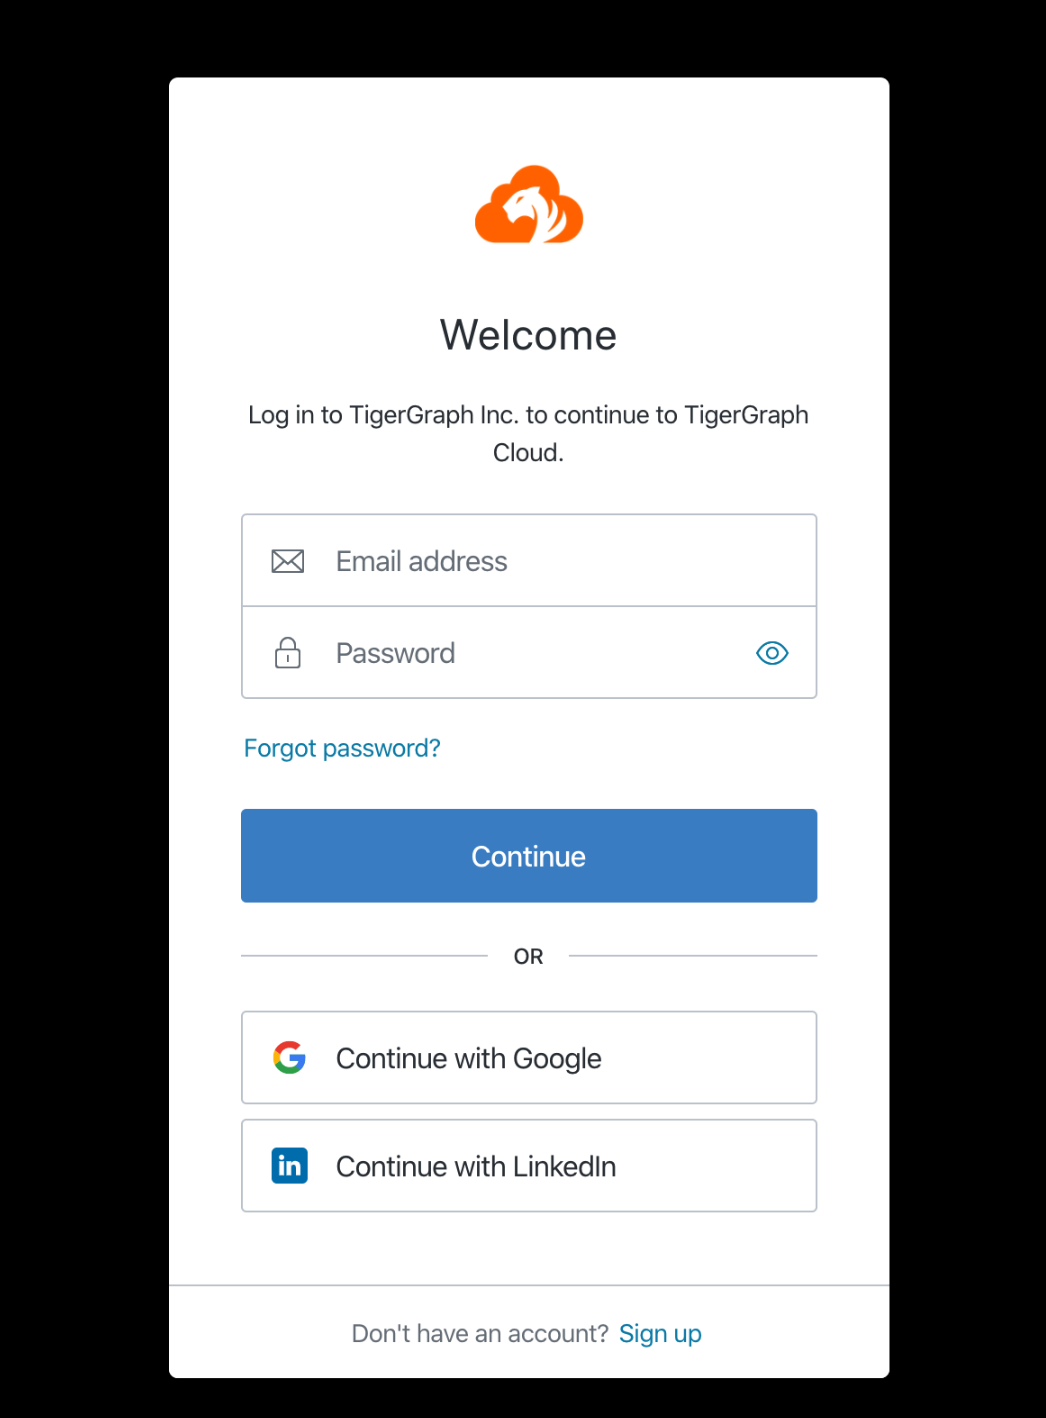
1. Login Page
When you hit “open solutions” you will see a screen like the one below.
The first step will be to login to your provisioned instance. By default, the username is “tigergraph” and the password is the one you choose when provisioning the instance.
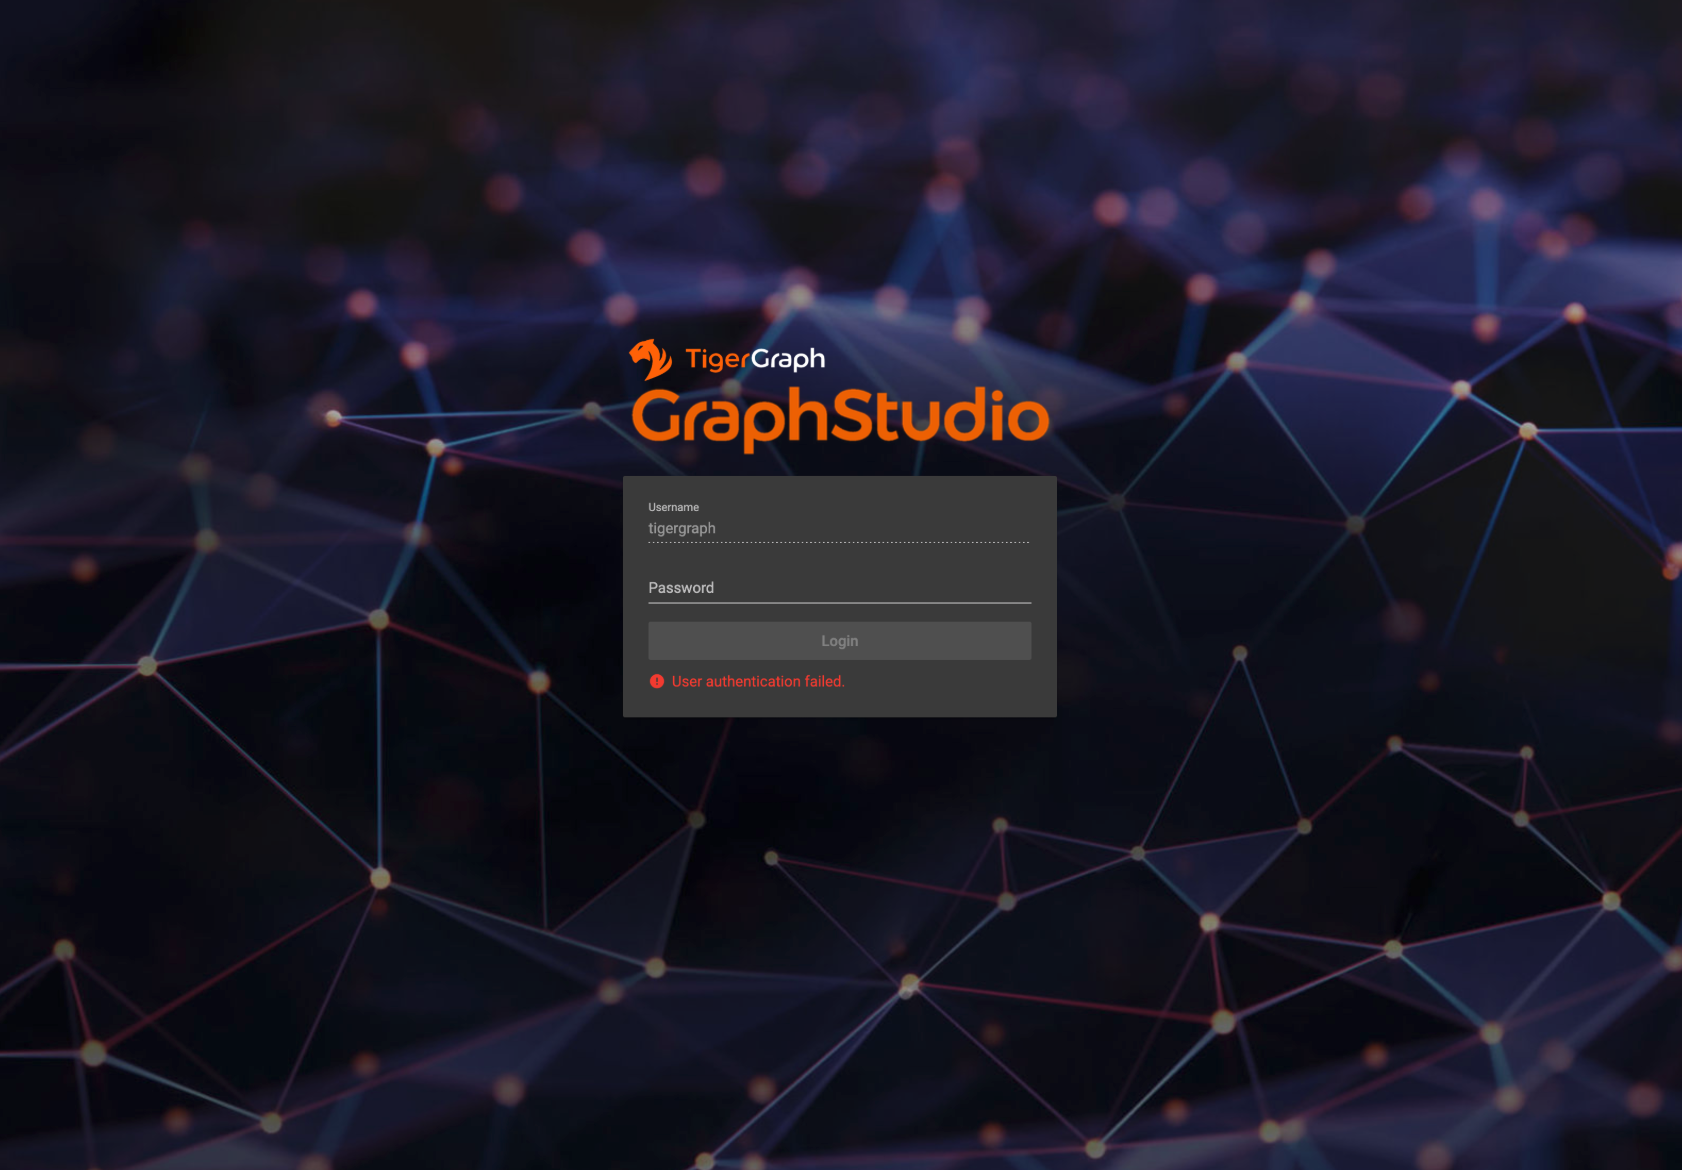
Login Page
Side Note: before we can Explore and Query the data, we need to first do the following (which we will cover in steps 2,3,4)
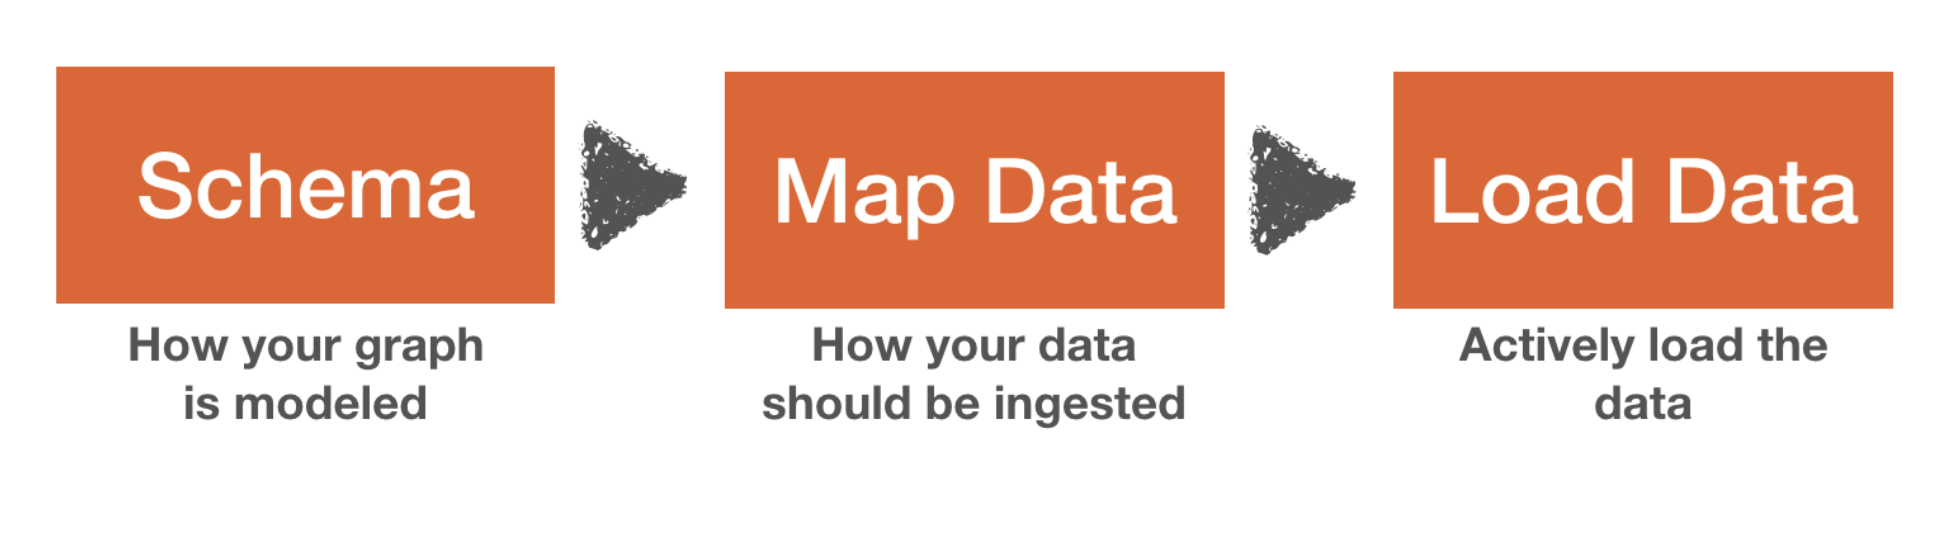
2. Publish Schema Design
Click on the “Design Schema” tab.
This is your Schema Design Studio. Think of it as your data modeling space.
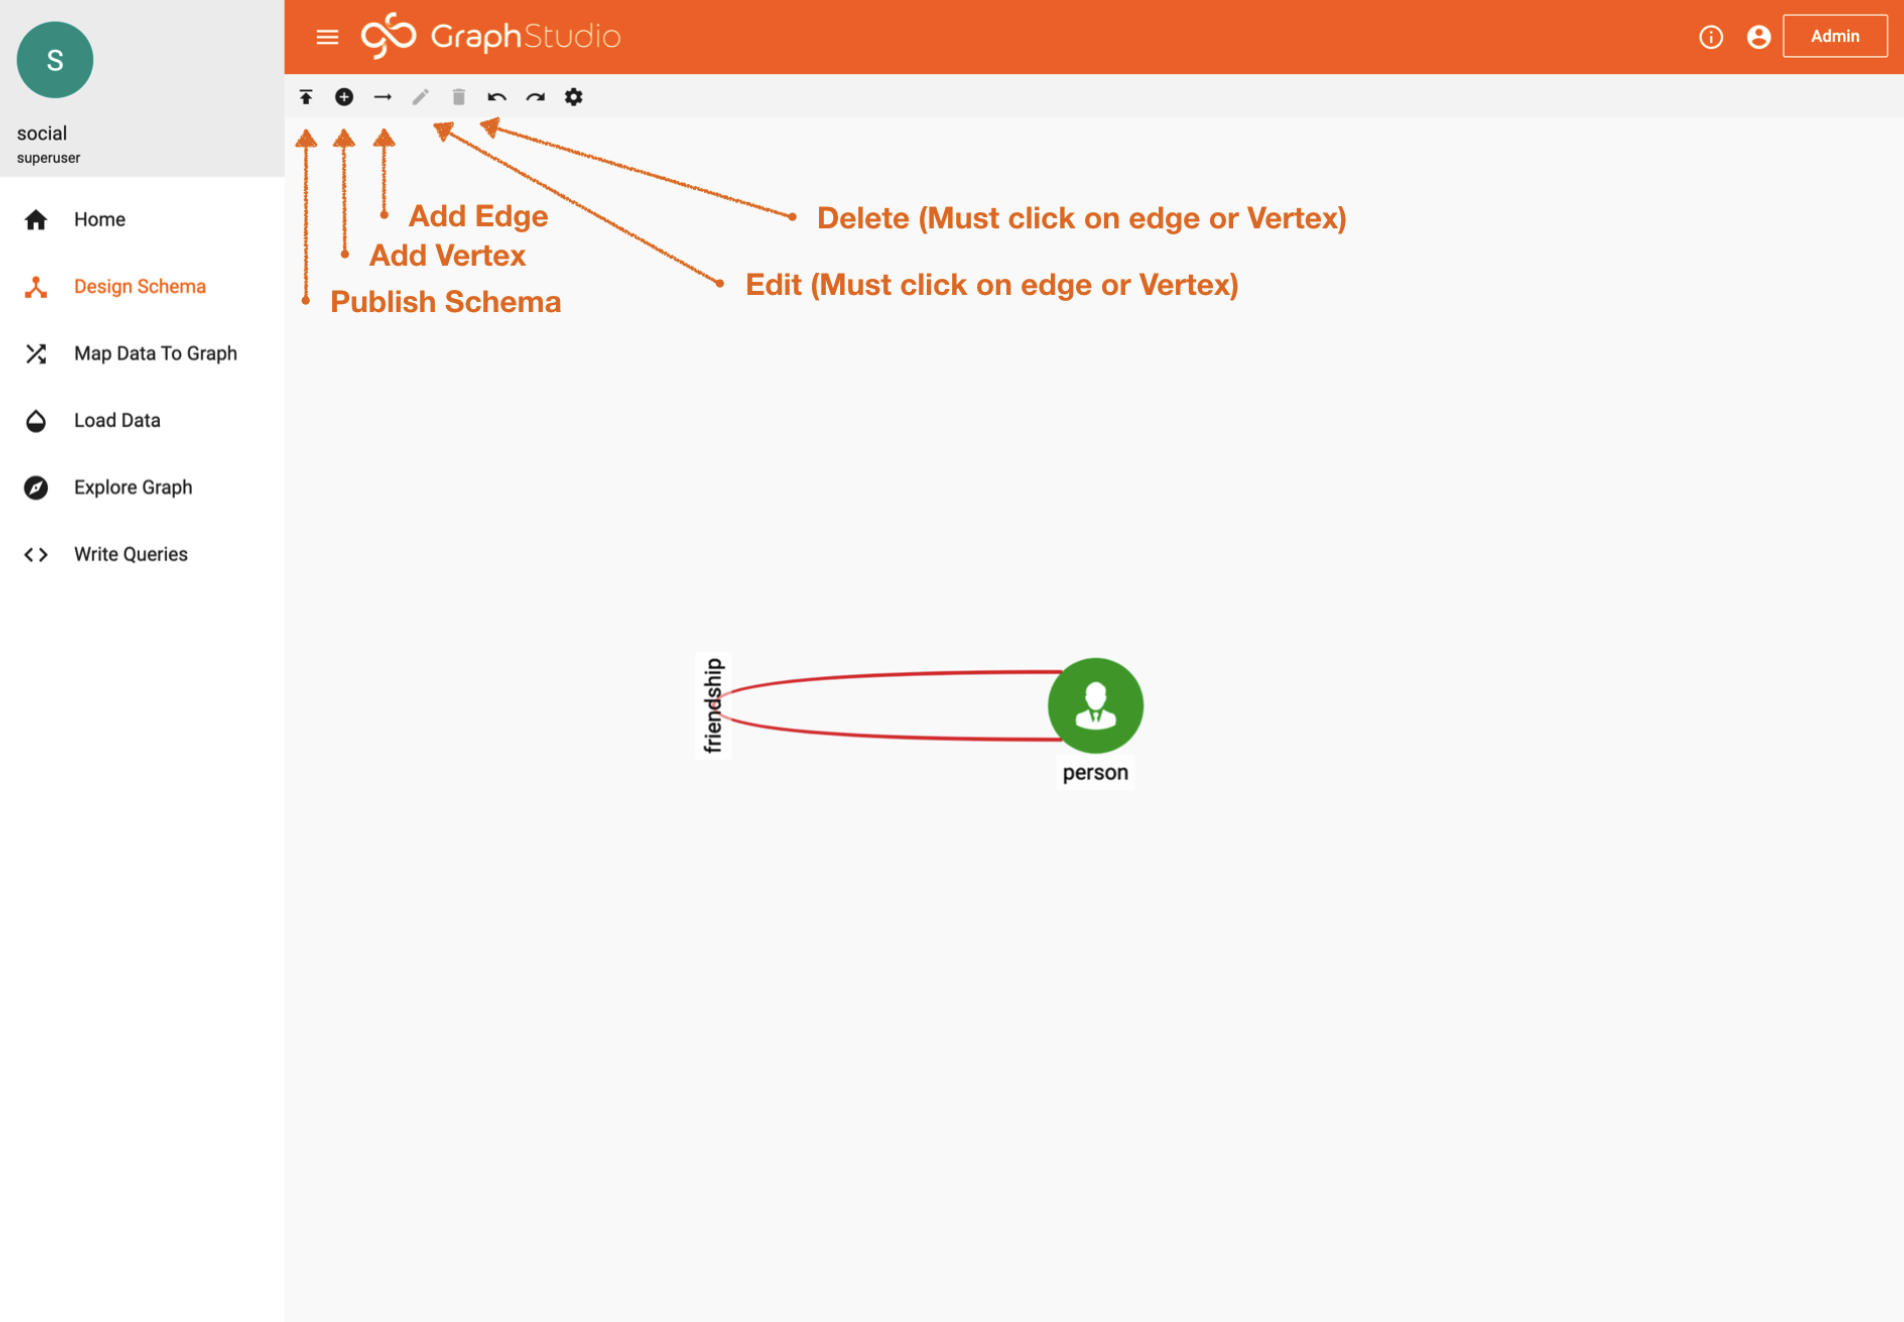
Design Schema Tab
One thing that is important when designing the database (aka building the schema) is thinking about how you should structure the data, how is it going to be accessed, are there certain types of algorithms that you will need to account for?
For more information on schema modeling checkout this helpful video.
For the purpose of this tutorial, you will just need to hit the “publish” button which will activate your current design.
Or, if you want to get fancy, try adding a few more vertices or edges.
Done? Let’s move on.
3. Data Mapping
Click on the “Map Data to Graph” tab.
Now that we have the data model published, we can create a data mapping of how the data should be inserted into the graph.
For this example, you see that we have two files, a “friendship.csv” file pointing to the edge “friendship” & a “person.csv” file that points to the “person” vertex.
If you want to explore, click around on edges, files, icons, and vertices… Just be careful of the “delete” button.
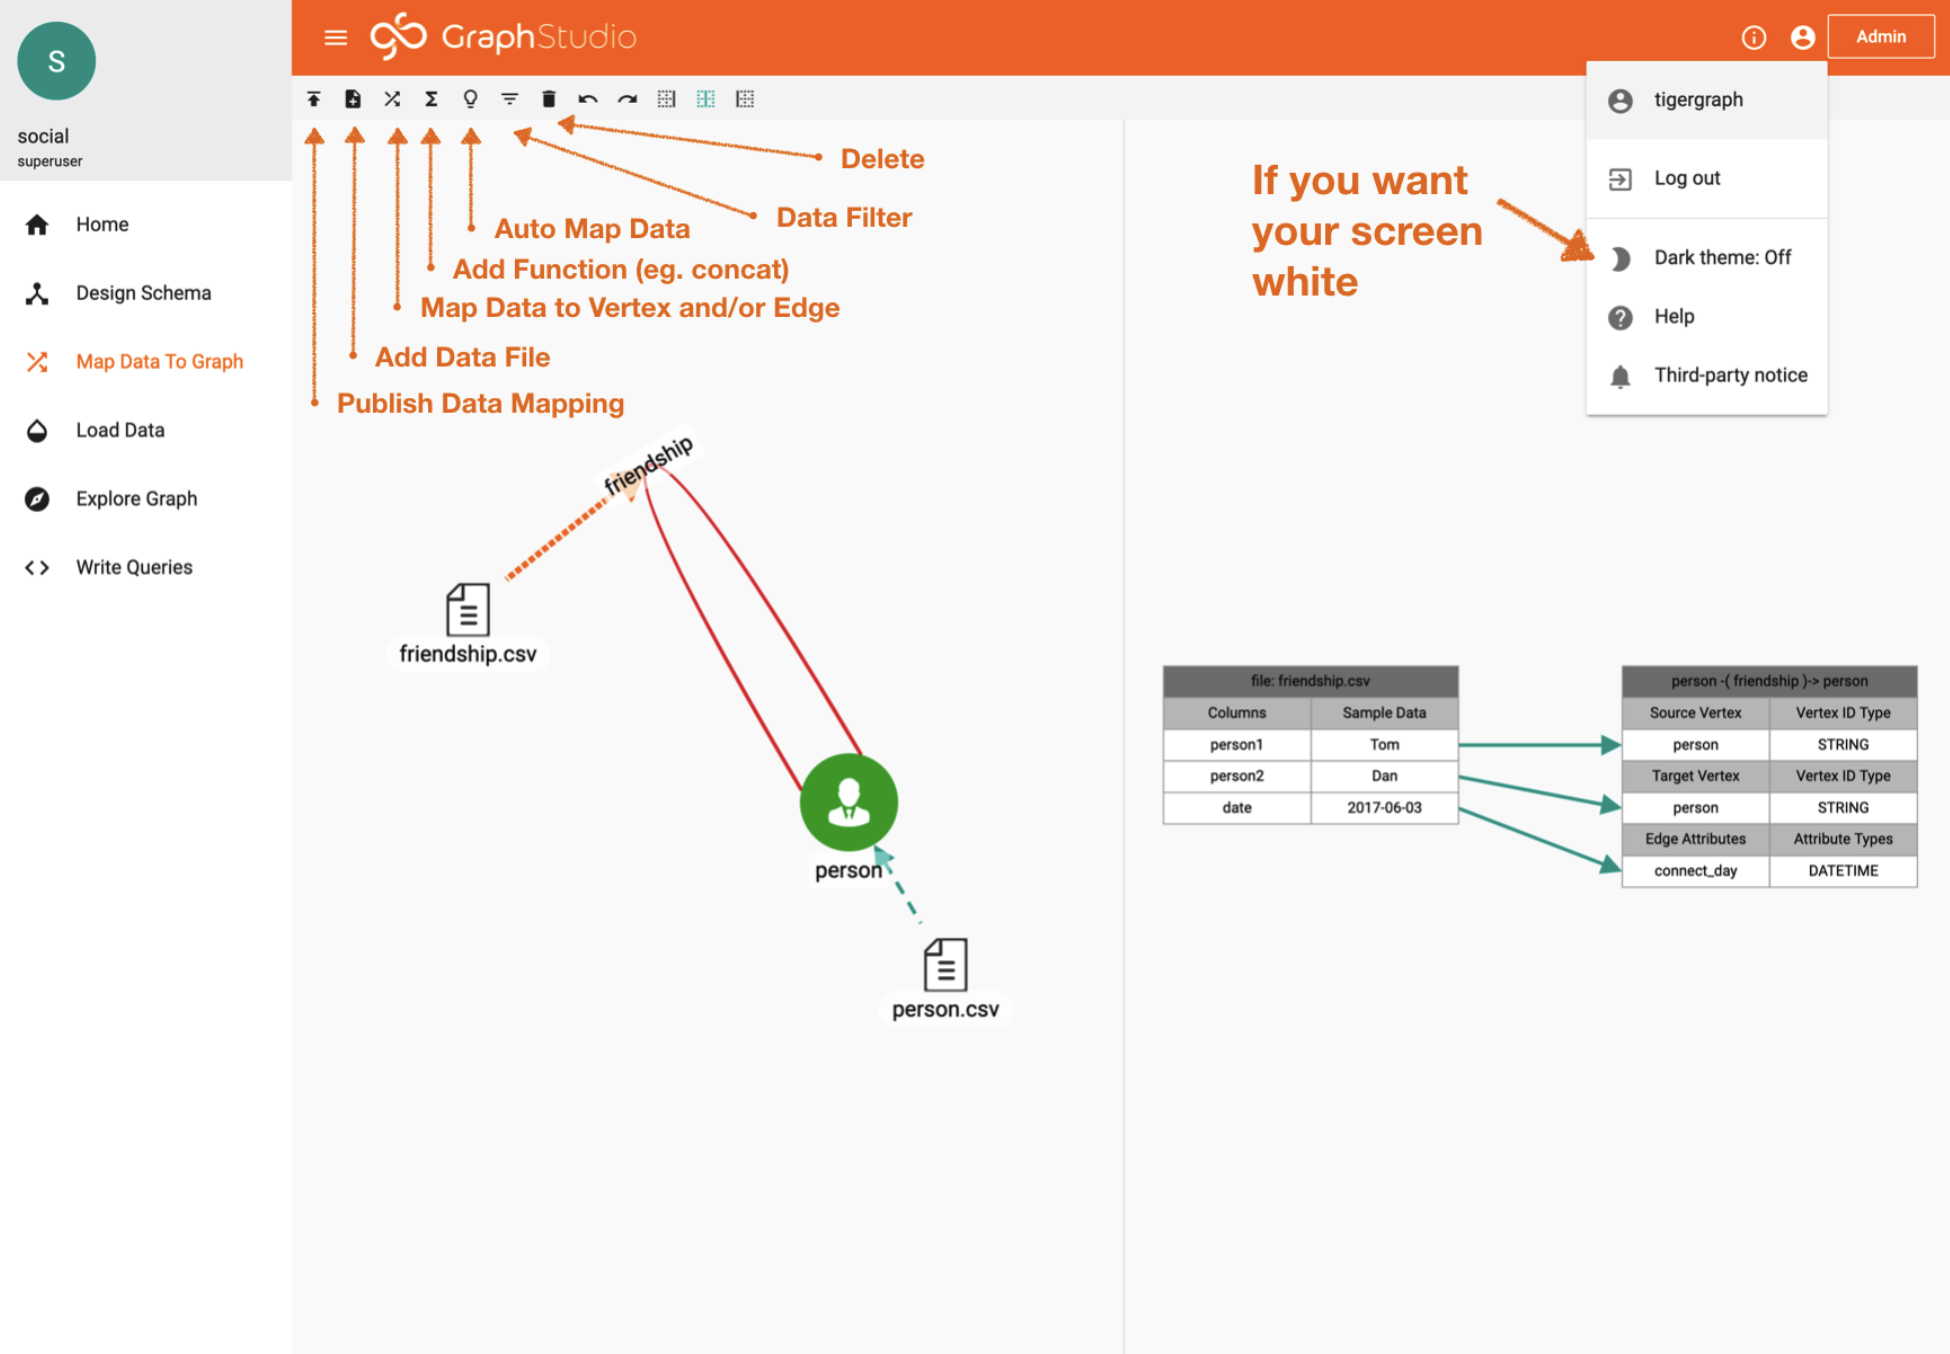
Data Mapping Tab
Now double click on one of the edges.
Focus your eyes on the right (of the image above), you will notice how the data or the current file is mapped.
The neat part about these starter kits is that all of the data is pre-mapped. All you need to do is “Publish” the data mapping.
If you have chosen a blank demo. No worries. Just add your data file and then “map data” to Vertex or Edge (reference the icon tools above).
This is the most basic way to load static data. There are many other ways including (but not limited to) kafka streaming, S3, spark, & REST endpoints.
4. Data Loading
Click on the “Load Data” tab.
At this stage we have the schema built and data file mapped. Looking on the right you will notice that there is no data in the graph. That is because we will need to choose 1 or all of the files to initiate the data loading procedure.
Simply click the “play” button to load all the files. It’s that simple.
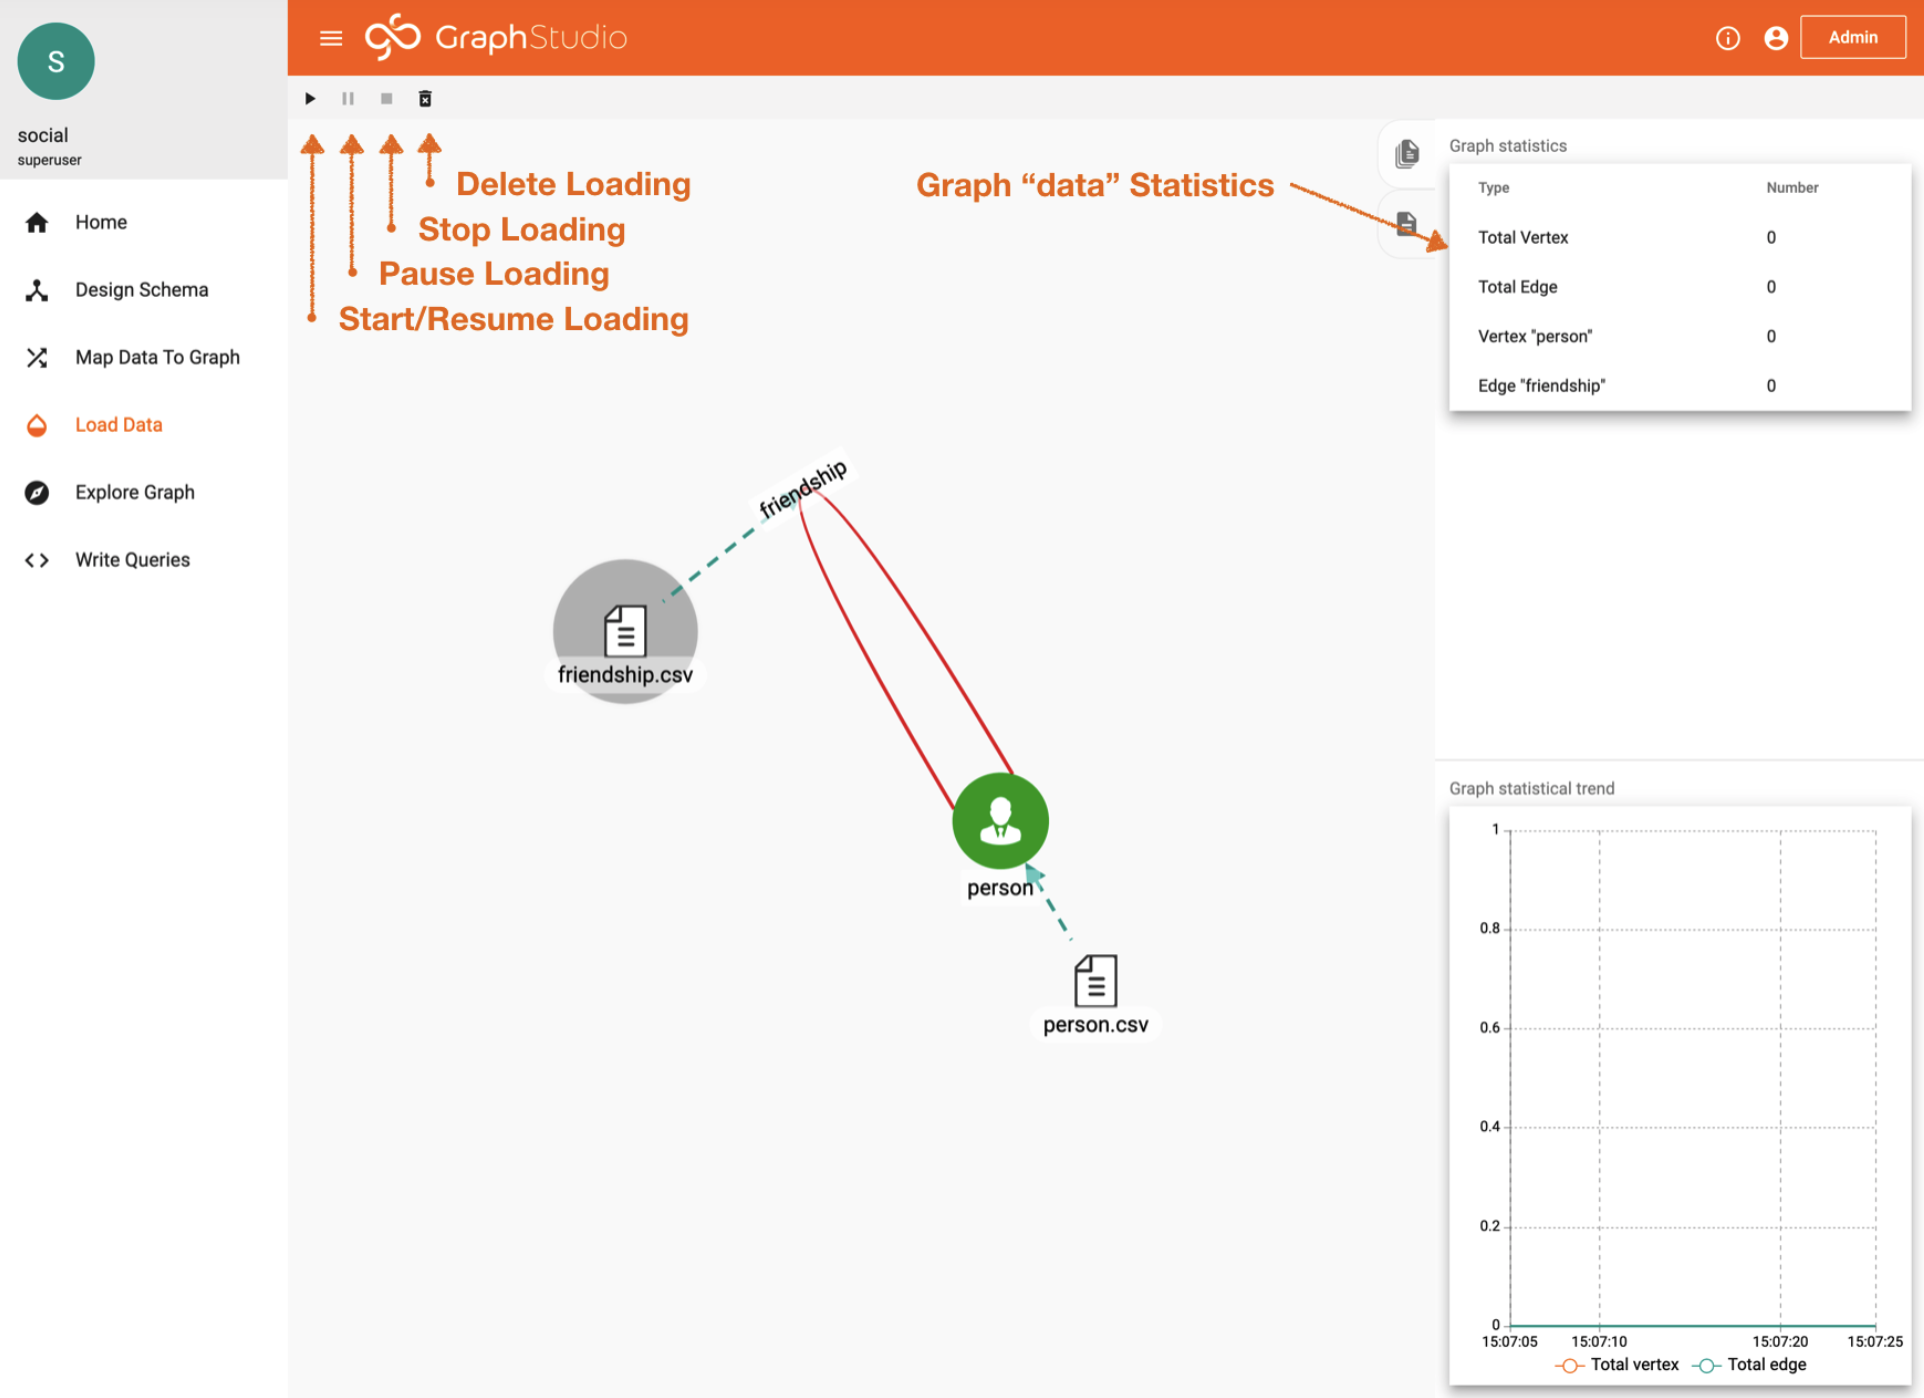
Data Loading Tab
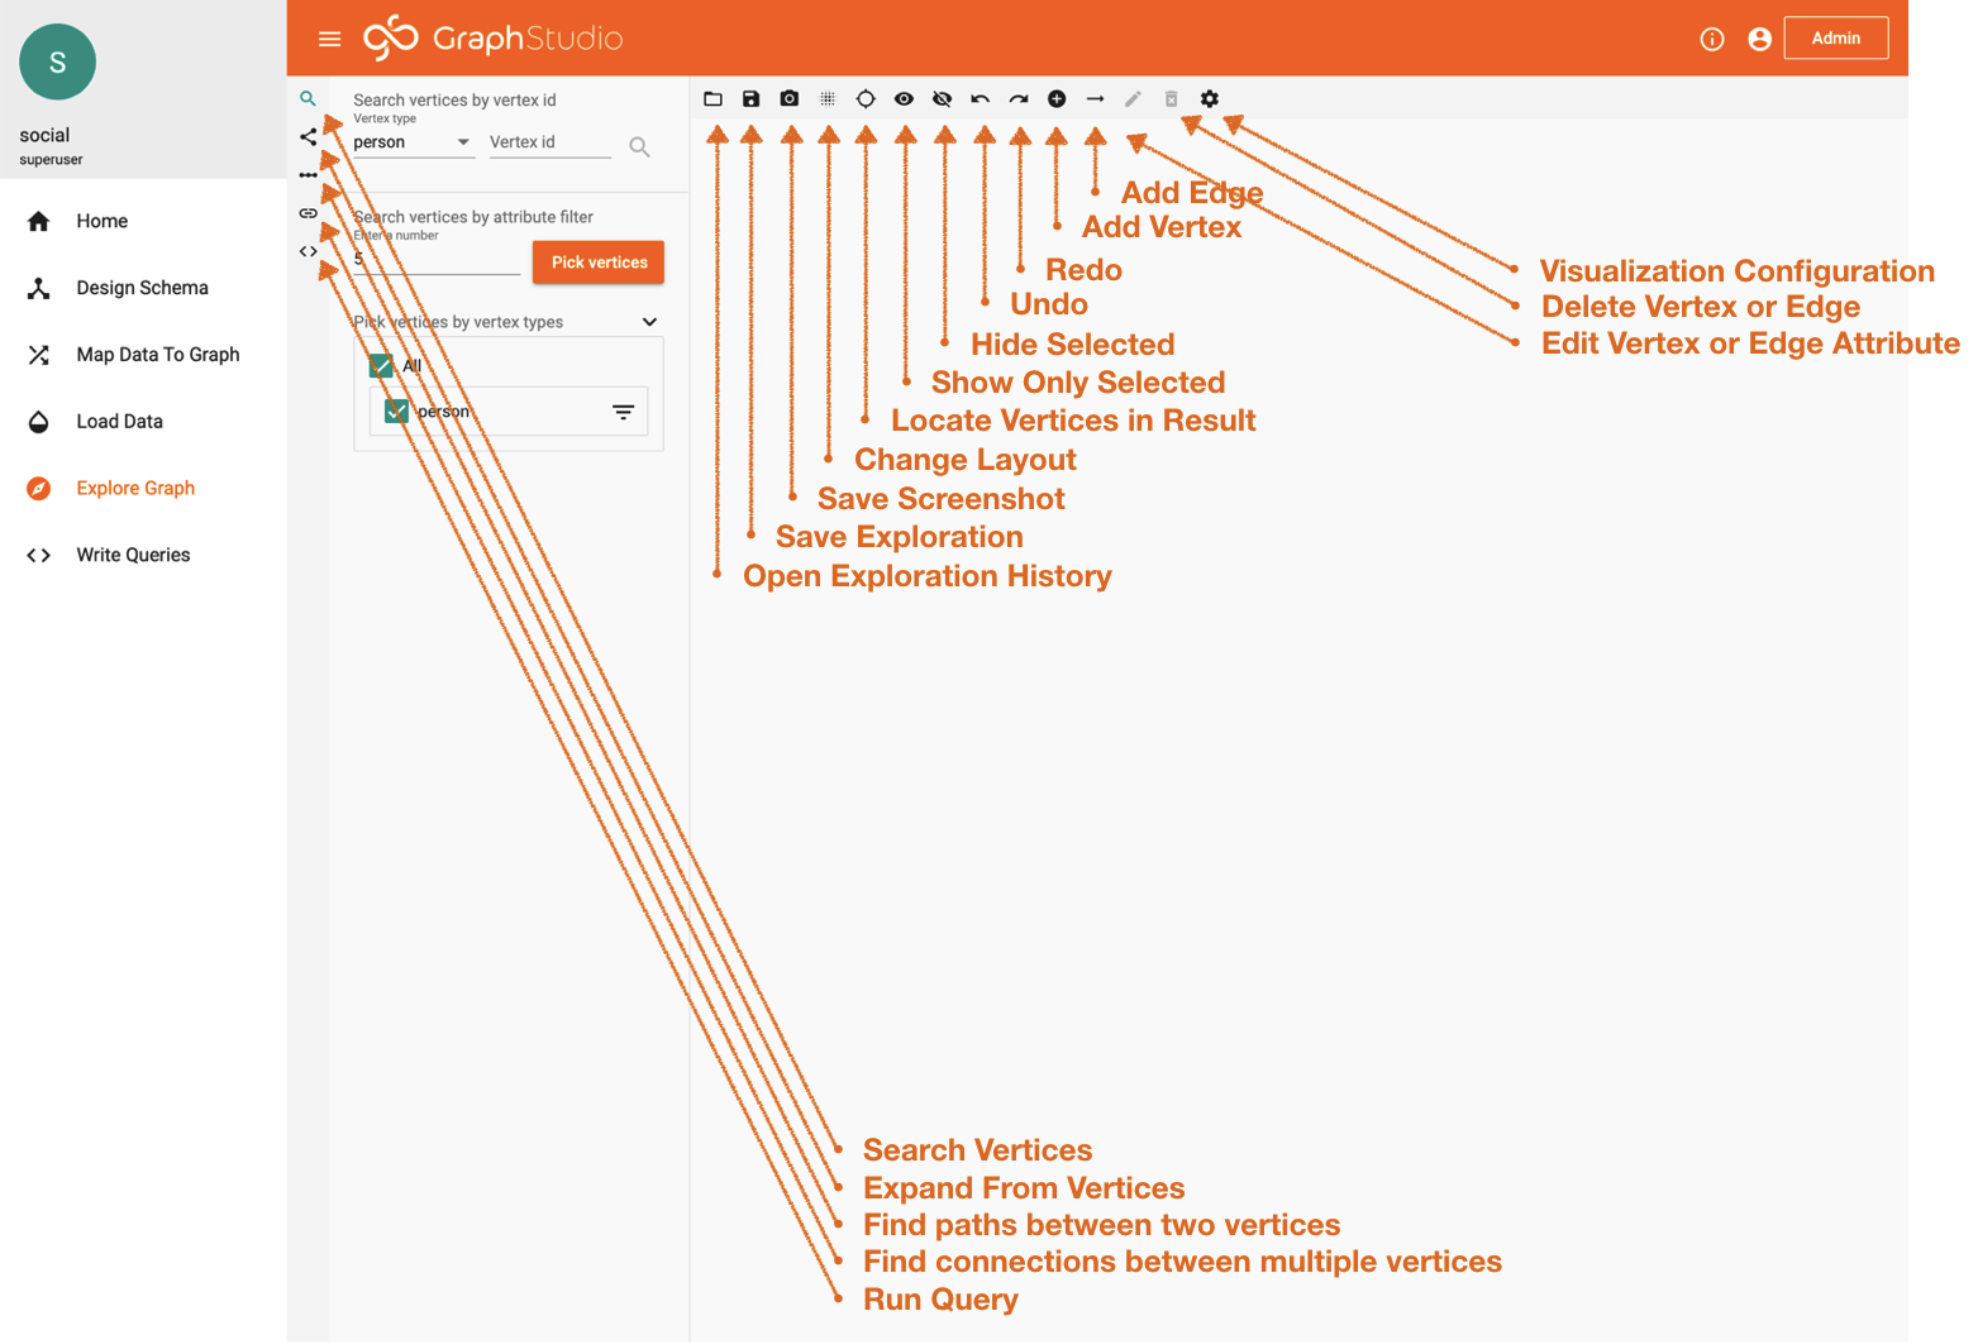
5. Data Exploration
Click on the “Explore Graph” tab.
Finally, we made it to the fun stuff!
What you’re seeing below is one of the most powerful graph exploration tools. It allows you to access your data and crawl your data without writing a single line of code. This is the page where you can have the MOST fun.
My recommendation is to just start clicking around:
– Pick Random Vertices.
– Try Expanding Vertices.
– Try Expanding Only Certain Edges
6. Query Building
Click on the “Write Queries” tab.
As much fun as you had above.. this is where the MAGIC happens. Yes, MAGIC in all CAPS! Haha.
Why is it MAGIC? Because GSQL is a turning complete language meaning you can do absolutely anything with it.
But wait there is more.. (always wanted to say that after watching all the commercials)
My favorite feature is every query you build… The query gets automagically exposed as a REST service.
How cool!
Ok, maybe I’m the only one that finds this truly marvelous. But never the less it’s super convenient because after you write something it immediately becomes functional.
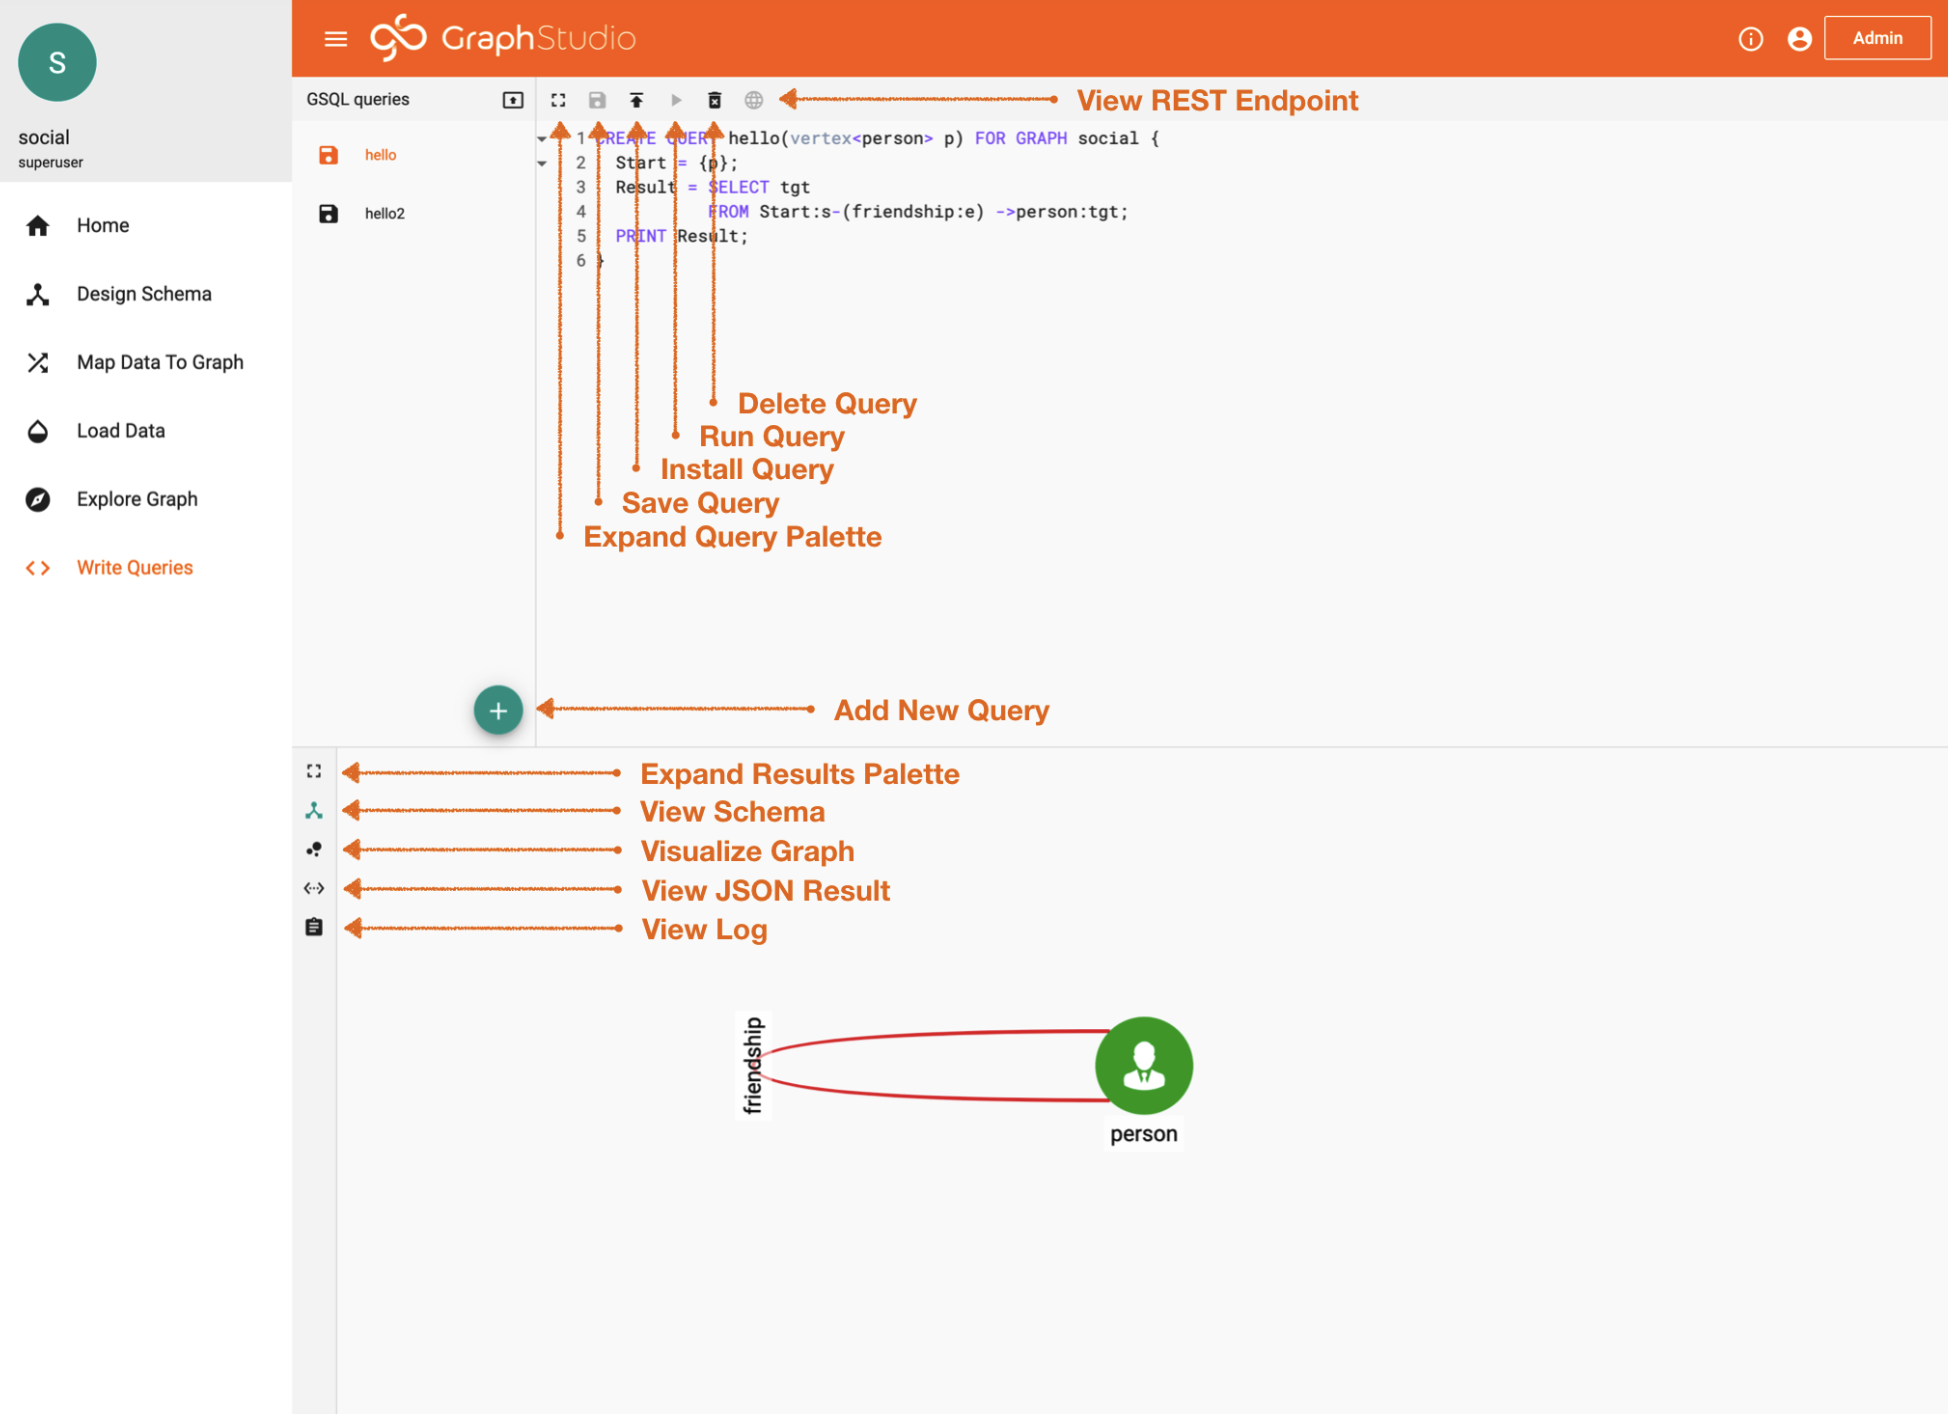
Query Building
Let’s test this out (reference image above for places you should click):
– Click on the “hello” query — This query is designed for the user to put a name into the parameter and the logic is to find all the people that that user is friends with.
– Click the “Install” button
– Click the “Run” button
Now it’s ready for a parameter. You can try “Tom”.
What do you see? Do you see the connections? Awesome Right? You just literally passed a parameter to the REST endpoint to get these results.
– Click “View JSON” — Now you will see the JSON that TigerGraph returns.
Your first time writing GSQL queries? I would recommend the following two resources to help get started:
GSQL Learning Resources / Certification
TigerGraph Test Drive: Virtual Demo
In Conclusion
WHY THIS IS EXCITING?! — In a matter of minutes not only did you provision a graph… but, you created a schema, you mapped data, you loaded data, you wrote a parameterized query that was exposed as a REST endpoint and then called that query via the REST endpoint.
With that, I’m DROPPING THE MIC. Bam.


