Skip to content
START FOR FREE
START FOR FREE
  • SUPPORT
  • COMMUNITY
Menu
  • SUPPORT
  • COMMUNITY
MENUMENU
  • Products
    • The World’s Fastest and Most Scalable Graph Platform

      LEARN MORE

      Watch a TigerGraph Demo

      TIGERGRAPH CLOUD

      • Overview
      • TigerGraph Cloud Suite
      • FAQ
      • Pricing

      USER TOOLS

      • GraphStudio
      • Insights
      • Application Workbenches
      • Connectors and Drivers
      • Starter Kits
      • openCypher Support

      TIGERGRAPH DB

      • Overview
      • GSQL Query Language
      • Compare Editions

      GRAPH DATA SCIENCE

      • Graph Data Science Library
      • Machine Learning Workbench
  • Solutions
    • The World’s Fastest and Most Scalable Graph Platform

      LEARN MORE

      Watch a TigerGraph Demo

      Solutions

      • Solutions Overview

      INCREASE REVENUE

      • Customer Journey/360
      • Product Marketing
      • Entity Resolution
      • Recommendation Engine

      MANAGE RISK

      • Fraud Detection
      • Anti-Money Laundering
      • Threat Detection
      • Risk Monitoring

      IMPROVE OPERATIONS

      • Supply Chain Analysis
      • Energy Management
      • Network Optimization

      By Industry

      • Advertising, Media & Entertainment
      • Financial Services
      • Healthcare & Life Sciences

      FOUNDATIONAL

      • AI & Machine Learning
      • Time Series Analysis
      • Geospatial Analysis
  • Customers
    • The World’s Fastest and Most Scalable Graph Platform

      LEARN MORE

      CUSTOMER SUCCESS STORIES

      • Ford
      • Intuit
      • JPMorgan Chase
      • READ MORE SUCCESS STORIES
      • Jaguar Land Rover
      • United Health Group
      • Xbox
  • Partners
    • The World’s Fastest and Most Scalable Graph Platform

      LEARN MORE

      PARTNER PROGRAM

      • Partner Benefits
      • TigerGraph Partners
      • Sign Up
      TigerGraph partners with organizations that offer complementary technology solutions and services.​
  • Resources
    • The World’s Fastest and Most Scalable Graph Platform

      LEARN MORE

      BLOG

      • TigerGraph Blog

      RESOURCES

      • Resource Library
      • Benchmarks
      • Demos
      • O'Reilly Graph + ML Book

      EVENTS & WEBINARS

      • Graph+AI Summit
      • Graph for All - Million Dollar Challenge
      • Events &Trade Shows
      • Webinars

      DEVELOPERS

      • Documentation
      • Ecosystem
      • Developers Hub
      • Community Forum

      SUPPORT

      • Contact Support
      • Production Guidelines

      EDUCATION

      • Training & Certifications
  • Company
    • Join the World’s Fastest and Most Scalable Graph Platform

      WE ARE HIRING

      COMPANY

      • Company Overview
      • Leadership
      • Legal Terms
      • Patents
      • Security and Compliance

      CAREERS

      • Join Us
      • Open Positions

      AWARDS

      • Awards and Recognition
      • Leader in Forrester Wave
      • Gartner Research

      PRESS RELEASE

      • Read All Press Releases
      TigerGraph Recognized in 2022 Gartner® Critical Capabilities for Cloud Database Management Systems for Analytical Use Cases
      January 12, 2023
      Read More »

      NEWS

      • Read All News

      A Shock to the System: ShockNet Predicts How Economic Shocks Could Affect the World Economy

      TigerGraph Recognized for the First Time in the 2022 Gartner® Magic Quadrant™ for Cloud Database Management Systems

  • START FREE
    • The World’s Fastest and Most Scalable Graph Platform

      GET STARTED

      • Request a Demo
      • CONTACT US
      • Try TigerGraph
      • START FREE
      • TRY AN ONLINE DEMO

The Beauty of Graph Algorithms with Built-in Parallelism

  • Yu Xu
  • July 17, 2019
  • blog, Developers, Graph Databases, GSQL
  • Blog >
  • The Beauty of Graph Algorithms with Built-in Parallelism

Many people already know that graph algorithms are the most efficient and sometimes the only solution for complex business use cases, such as clustering different groups of users (Community Detection), finding influential persons or entities (PageRank Algorithm), or predicting user behaviors for personalized recommendation (Label Propagation Algorithm).   However, it is not commonly known that Graph is also the ideal approach to solve problems where there might be an unknown number of joins to connect two entities. This type of problem is common across verticals including use cases such as enterprise knowledge, supply chain analytics, and energy flow computation. 

This blog describes how Graph can solve these problems in a natural, concise, and efficient way and can provide answers in subseconds, even when traversing hundreds of millions of entities and relationships. 

Problem Description 

 Let us consider a simple example in analyzing relationships between companies.  

There is only one table Ownership ( company, owner, percentage) with three columns where each row describes the percentage of a company owned by an owner. 

Business Query (Output): find the top K “final owner” companies which own the most of Company A. A final owner is a company which is not owned by any other company.

Inputs: name of Company A, integer K   

As an example, given Company 1 as the input in Figure 1,  Company 9 owns the most of Company 1. 
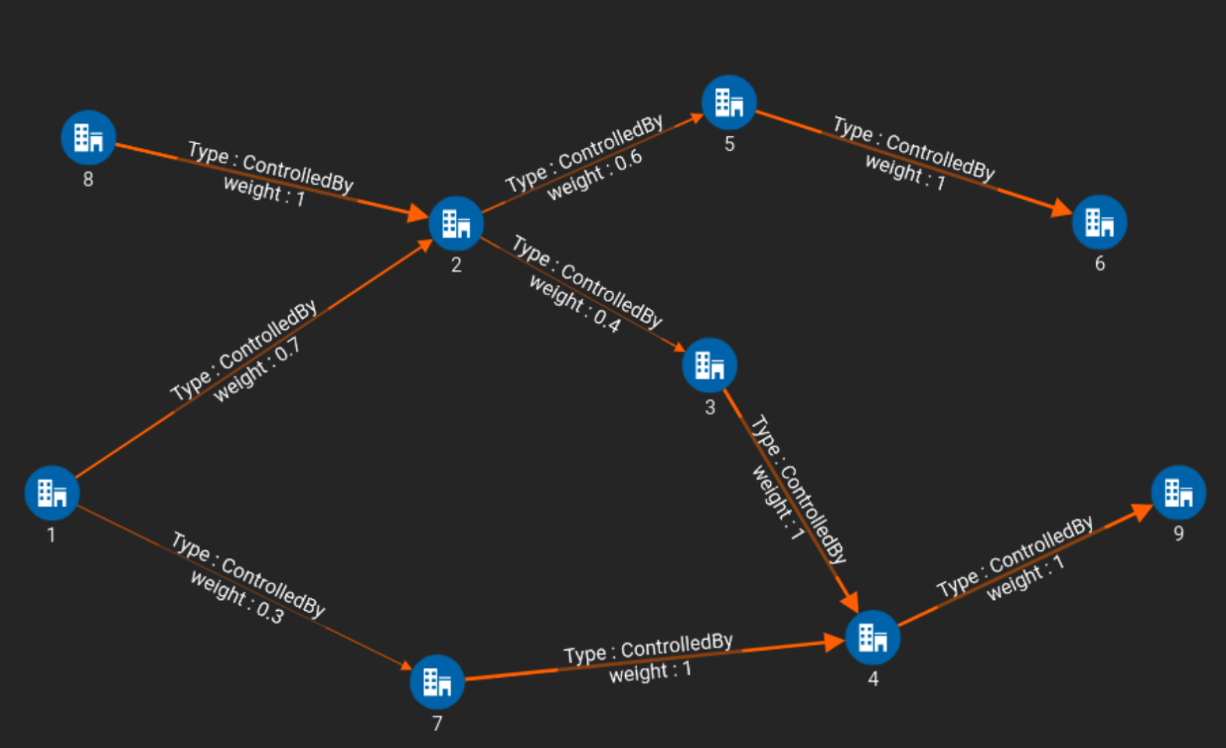
Figure 1

Challenges

There are two challenges: 

1. Unknown number of joins. We don’t know how many levels/steps away a company X may have ownership of Company A (directly or indirectly). 

2. There might be multiple paths with different number of steps from Company A to a company X which has ownership in Company A.   For example, Company X may have ownership in Company A through 5 intermediate companies on one path while may also have ownership in Company A through 3 intermediate companies on another path. Furthermore, the 5 intermediate companies on one path and the 3 intermediate companies on the second path may or may not overlap. 

As an example in Figure 1, Company 9 owns Company 1 via two paths with different lengths. RDBMS and NoSQL DBs aren’t designed to handle multiple hops (joins) efficiently. Moreover, standard SQL does not have any way to express “join repeatedly until you reach a target.”  Furthermore, on big datasets, the computational time and effort on non-graph DBs and even on older generation graph DBs is prohibitive. The reason is that those architectures do not have the vertex-centric parallel computation that is needed to do the work minimally and efficiently. They wastefully join entire tables, even though most of the table is not relevant. 

The above type of problems occur in many industries and use cases. For example, in supply chain management, we can have a Bill of Materials Table BOM ( Part, Parent_Part, Quantity ).   Each row describes that a Part (first column) is one of the components needed to make the Parent_Part (second column), and the third column describes how many Part units are needed to make one Parent_Part.  Again we have the same two challenges as described above: A Part X may depend on a Part Y through an unknown number of steps. There are many business questions which need to traverse the Part dependency graph along different paths with different steps.  For example, 

-Compute whether an order of some final products can be satisfied with the current inventory of all the parts needed.

-Compute the pricing change of final products if the price of some parts change.

-Electric power grids also need to address these challenges. If one or more component goes offline, the utility needs to know what effect this has on downstream and upstream components and power lines.

Graph Solution with Built-in Parallelism 

Now we describe how we can use a Graph DB with built-in parallelism in its graph query language, such as TigerGraph and its query language GSQL, to easily and efficiently solve this type of problem.  Parallelism is important because it is the natural and efficient way to implement many graph-oriented problems. Computer scientists who’ve studied some graph algorithms know that they often have steps which start with “For each vertex / For each edge / For each neighbor of vertex V…”  These “for each” conditions mean that we need to do the same task for each member in a set. If the set is large, the efficient way to do the work is in parallel. GSQL features built-in parallelism, so that it is very easy to express these “for each” tasks.

There are a few approaches to solve this company ownership problem, which illustrates the power and flexibility of GSQL. In TigerGraph’s parallel read-compute-update execution flow, a query or algorithm behaves like a distributed walk or traversal of the graph: We start from a designated set of vertices and then follow a plan for step-by-step walking or traversing to neighboring edges. Along the way, we gather data from vertices or edges. We can pass along data to the vertices we encounter, or save it for the end.

Approach 1

The high-level idea is to go through the company ownership graph in two passes.  Each pass begins with Company A and propagates through ownership edges. The first pass is essentially a preparation stage. It simply computes for any Company Y the number of companies Company Y directly owns which also have ownership in Company A.   This computed number on each such Company Y is used in the second pass to make sure each company completely sums up all ownership in Company A it has before it propagates its ownership of Company A to the companies which directly own it. For example, in Figure 1, Company 4 stores the number 2, because two of its in-neighbors have ownership of Company 1.

The second pass propagates percentages of ownership of Company A to all companies directly or indirectly owning Company A. Each owner company  waits until it receives an ownership message from the number of direct owners computed in the first pass,. It then takes the total ownership of Company A it has received and propagates fractions of that amount to its owners. For our example of Figure 1, Company 2 waits until it receives 1 message (70% ownership). After receiving this, it sends messages to its owners. It sends the message “42%” (70% x 0.6) to Company 5 and “28%” (70% x 0.4) to Company 3.

Note that we only compute the total ownership of each owner Company Y only one time, which is efficient.  In use cases like supply chain and energy flow analysis, the propagative computations they need (e.g., the change in price, voltage, or current)  are much more compute-intensive, so efficient single-pass computation across the graph is important to real-time performance. 

Please see the GSQL query in Figure 2.  The complete solution including graph model and GSQL queries are available at TigerGraph’s github repository. 

CREATE QUERY getOwnershipPert (vertex<Company> inputComp) FOR GRAPH MyGraph { 

  SumAccum<int> @msgCnt1, @msgCnt2;
  OrAccum<bool> @visited;
  SumAccum<float> @score = 0;
  SetAccum<vertex> @@results;

  Start = {inputComp};

  WHILE Start.size() > 0 limit 8 DO
    Start = SELECT t FROM Start:s-(ControlledBy:e)-:t
            ACCUM [email protected] += 1
            POST-ACCUM [email protected] = true
            HAVING [email protected] == false;  // don't start again for the second visit;
  end;

  Start = {inputComp};

  Start = SELECT s FROM Start:s ACCUM [email protected] = 1; // initialize @score

  WHILE Start.size() > 0 LIMIT 8 DO
    Start = SELECT t FROM Start:s-(ControlledBy:e)-:t
            ACCUM [email protected] += 1, [email protected] += [email protected] * e.weight
            POST-ACCUM 
            CASE WHEN t.outdegree("ControlledBy") == 0 THEN
              @@results += t 
            END
            HAVING [email protected] ==  [email protected]; // make sure got all the scores
  END;

  Start = @@results;

  Start = SELECT s FROM Start:s ORDER BY [email protected] desc LIMIT 5;
	
  PRINT Start;
}

Approach 2

The expressiveness of a high-level graph query language with built-in parallelism, such as GSQL, means we can efficiently express business logic which would be very cumbersome in the low-level APIs for NoSQL, and even impossible in SQL.  Our second approach does not need the preparation stage of the first approach. The idea is to utilize the business knowledge that the ownership of Company A by Company Y is accumulative. This means we can compute the ownership of company along each path separately, and if multiple paths intersect at a vertex, we can simply add the contribution by each path, regardless of when a path reaches that shared vertex. .  

Referring to Figure 1 for an example, in Round 2, Company 7 tells its neighbor Company 4 that it owns 30% of Company. So, in Round 3, Company 4 tells its neighbor Company 9 that it owns 30% of Company A. However, also in Round 3, Company 3 tells Company 4 that it owns 28% of Company A.  Therefore in Round 4, Company 4 gives Company 9 an update, telling it that is owns an additional 28% of Company A.

CREATE QUERY getOwnershipPertDelta(vertex<Company> inputComp) FOR GRAPH MyGraph { 
	
  SumAccum<float> @deltaOld, @deltaNew, @score;
  SetAccum<vertex> @@results;
	
  Start = {inputComp};
	
  Start = SELECT s FROM Start:s ACCUM [email protected] = 1, [email protected] = 1;

  WHILE Start.size() > 0 LIMIT 8 DO
    Start = SELECT t FROM Start:s-(ControlledBy:e)-:t
            ACCUM [email protected] += [email protected] * e.weight
            POST-ACCUM 
	        [email protected] += [email protected], 
              [email protected] = [email protected], 
              [email protected] = 0,
	        CASE WHEN t.outdegree("ControlledBy") == 0 THEN 
                @@results += t
              END;
  END;

  Start = @@results;
  Start = SELECT s FROM Start:s ORDER BY [email protected] desc LIMIT 5;
  PRINT Start;
}

Conclusion

Real world problems (such as supply chain optimization, routing logistics, , enterprise knowledge graph, fraud prevention, risk management, and others  can be complex, due to the highly interconnected data. RDBMS and non-graph NoSQL DBs are not designed to express and to solve these type of important problems. Developers do not want to hard code a solution in Java or C++ either, which can be time-consuming, error-prone, hard to maintain and reuse, no parallel or distributed capability.    A solution using high-level graph query language with built-in parallelism is the only solution and it’s a beautiful solution too. 


You Might Also Like

TigerGraph Showcases Unrivaled Performance at Scale

TigerGraph Showcases Unrivaled Performance at Scale

January 12, 2023
How to Create a Visual Graph Analytics Application Using TigerGraph Insights in 30 mins

How to Create a Visual Graph...

November 14, 2022
Turbocharge your business intelligence with TigerGraph’s ML Workbench on TigerGraph Cloud

Turbocharge your business intelligence with TigerGraph’s...

November 14, 2022

Introducing TigerGraph 3.0

July 1, 2020

Everything to Know to Pass your TigerGraph Certification Test

June 24, 2020

Neo4j 4.0 Fabric – A Look Behind the Curtain

February 7, 2020

TigerGraph Blog

  • Categories
    • blogs
      • About TigerGraph
      • Benchmark
      • Business
      • Community
      • Compliance
      • Customer
      • Customer 360
      • Cybersecurity
      • Developers
      • Digital Twin
      • eCommerce
      • Emerging Use Cases
      • Entity Resolution
      • Finance
      • Fraud / Anti-Money Laundering
      • GQL
      • Graph Database Market
      • Graph Databases
      • GSQL
      • Healthcare
      • Machine Learning / AI
      • Podcast
      • Supply Chain
      • TigerGraph
      • TigerGraph Cloud
    • Graph AI On Demand
      • Analysts and Research
      • Customer 360 and Entity Resolution
      • Customer Spotlight
      • Development
      • Finance, Banking, Insurance
      • Keynote
      • Session
    • Video
  • Recent Posts

    • It’s Time to Harness the Power of Graph Technology [Infographic]
    • TigerGraph Showcases Unrivaled Performance at Scale
    • TigerGraph 101 An Introduction to Graph | Jan 26th @ 9am PST
    • Data Science Salon New York
    • Tech For Retail
    TigerGraph

    Product

    SOLUTIONS

    customers

    RESOURCES

    start for free

    TIGERGRAPH DB
    • Overview
    • Features
    • GSQL Query Language
    GRAPH DATA SCIENCE
    • Graph Data Science Library
    • Machine Learning Workbench
    TIGERGRAPH CLOUD
    • Overview
    • Cloud Starter Kits
    • Login
    • FAQ
    • Pricing
    • Cloud Marketplaces
    USEr TOOLS
    • GraphStudio
    • TigerGraph Insights
    • Application Workbenches
    • Connectors and Drivers
    • Starter Kits
    • openCypher Support
    SOLUTIONS
    • Why Graph?
    industry
    • Advertising, Media & Entertainment
    • Financial Services
    • Healthcare & Life Sciences
    use cases
    • Benefits
    • Product & Service Marketing
    • Entity Resolution
    • Customer 360/MDM
    • Recommendation Engine
    • Anti-Money Laundering
    • Cybersecurity Threat Detection
    • Fraud Detection
    • Risk Assessment & Monitoring
    • Energy Management
    • Network & IT Management
    • Supply Chain Analysis
    • AI & Machine Learning
    • Geospatial Analysis
    • Time Series Analysis
    success stories
    • Customer Success Stories

    Partners

    Partner program
    • Partner Benefits
    • TigerGraph Partners
    • Sign Up
    LIBRARY
    • Resources
    • Benchmark
    • Webinars
    Events
    • Trade Shows
    • Graph + AI Summit
    • Million Dollar Challenge
    EDUCATION
    • Training & Certifications
    Blog
    • TigerGraph Blog
    DEVELOPERS
    • Developers Hub
    • Community Forum
    • Documentation
    • Ecosystem

    COMPANY

    Company
    • Overview
    • Careers
    • News
    • Press Release
    • Awards
    • Legal
    • Patents
    • Security and Compliance
    • Contact
    Get Started
    • Start Free
    • Compare Editions
    • Online Demo - Test Drive
    • Request a Demo

    Product

    • Overview
    • TigerGraph 3.0
    • TIGERGRAPH DB
    • TIGERGRAPH CLOUD
    • GRAPHSTUDIO
    • TRY NOW

    customers

    • success stories

    RESOURCES

    • LIBRARY
    • Events
    • EDUCATION
    • BLOG
    • DEVELOPERS

    SOLUTIONS

    • SOLUTIONS
    • use cases
    • industry

    Partners

    • partner program

    company

    • Overview
    • news
    • Press Release
    • Awards

    start for free

    • Request Demo
    • take a test drive
    • SUPPORT
    • COMMUNITY
    • CONTACT
    • Copyright © 2023 TigerGraph
    • Privacy Policy
    • Linkedin
    • Facebook
    • Twitter

    Copyright © 2020 TigerGraph | Privacy Policy

    Copyright © 2020 TigerGraph Privacy Policy

    • SUPPORT
    • COMMUNITY
    • COMPANY
    • CONTACT
    • Linkedin
    • Facebook
    • Twitter

    Copyright © 2020 TigerGraph

    Privacy Policy

    • Products
    • Solutions
    • Customers
    • Partners
    • Resources
    • Company
    • START FREE
    START FOR FREE
    START FOR FREE
    TigerGraph
    PRODUCT
    PRODUCT
    • Overview
    • GraphStudio UI
    • Graph Data Science Library
    TIGERGRAPH DB
    • Overview
    • Features
    • GSQL Query Language
    TIGERGRAPH CLOUD
    • Overview
    • Cloud Starter Kits
    TRY TIGERGRAPH
    • Get Started for Free
    • Compare Editions
    SOLUTIONS
    SOLUTIONS
    • Why Graph?
    use cases
    • Benefits
    • Product & Service Marketing
    • Entity Resolution
    • Customer Journey/360
    • Recommendation Engine
    • Anti-Money Laundering (AML)
    • Cybersecurity Threat Detection
    • Fraud Detection
    • Risk Assessment & Monitoring
    • Energy Management
    • Network Resources Optimization
    • Supply Chain Analysis
    • AI & Machine Learning
    • Geospatial Analysis
    • Time Series Analysis
    industry
    • Advertising, Media & Entertainment
    • Financial Services
    • Healthcare & Life Sciences
    CUSTOMERS
    read all success stories


    PARTNERS
    Partner program
    • Partner Benefits
    • TigerGraph Partners
    • Sign Up
    RESOURCES
    LIBRARY
    • Resource Library
    • Benchmark
    • Webinars
    Events
    • Trade Shows
    • Graph + AI Summit
    • Graph for All - Million Dollar Challenge
    EDUCATION
    • TigerGraph Academy
    • Certification
    Blog
    • TigerGraph Blog
    DEVELOPERS
    • Developers Hub
    • Community Forum
    • Documentation
    • Ecosystem
    COMPANY
    COMPANY
    • Overview
    • Leadership
    • Careers  
    NEWS
    PRESS RELEASE
    AWARDS
    START FREE
    Start Free
    • Request a Demo
    • SUPPORT
    • COMMUNITY
    • CONTACT
    Dr. Jay Yu

    Dr. Jay Yu | VP of Product and Innovation

    Dr. Jay Yu is the VP of Product and Innovation at TigerGraph, responsible for driving product strategy and roadmap, as well as fostering innovation in graph database engine and graph solutions. He is a proven hands-on full-stack innovator, strategic thinker, leader, and evangelist for new technology and product, with 25+ years of industry experience ranging from highly scalable distributed database engine company (Teradata), B2B e-commerce services startup, to consumer-facing financial applications company (Intuit). He received his PhD from the University of Wisconsin - Madison, where he specialized in large scale parallel database systems

    Todd Blaschka | COO

    Todd Blaschka is a veteran in the enterprise software industry. He is passionate about creating entirely new segments in data, analytics and AI, with the distinction of establishing graph analytics as a Gartner Top 10 Data & Analytics trend two years in a row. By fervently focusing on critical industry and customer challenges, the companies under Todd's leadership have delivered significant quantifiable results to the largest brands in the world through channel and solution sales approach. Prior to TigerGraph, Todd led go to market and customer experience functions at Clustrix (acquired by MariaDB), Dataguise and IBM.