Skip to content
START FOR FREE
START FOR FREE
  • SUPPORT
  • COMMUNITY
Menu
  • SUPPORT
  • COMMUNITY
MENUMENU
  • Products
    • The World’s Fastest and Most Scalable Graph Platform

      LEARN MORE

      Watch a TigerGraph Demo

      TIGERGRAPH CLOUD

      • Overview
      • TigerGraph Cloud Suite
      • FAQ
      • Pricing

      USER TOOLS

      • GraphStudio
      • Insights
      • Application Workbenches
      • Connectors and Drivers
      • Starter Kits
      • openCypher Support

      TIGERGRAPH DB

      • Overview
      • GSQL Query Language
      • Compare Editions

      GRAPH DATA SCIENCE

      • Graph Data Science Library
      • Machine Learning Workbench
  • Solutions
    • The World’s Fastest and Most Scalable Graph Platform

      LEARN MORE

      Watch a TigerGraph Demo

      Solutions

      • Solutions Overview

      INCREASE REVENUE

      • Customer Journey/360
      • Product Marketing
      • Entity Resolution
      • Recommendation Engine

      MANAGE RISK

      • Fraud Detection
      • Anti-Money Laundering
      • Threat Detection
      • Risk Monitoring

      IMPROVE OPERATIONS

      • Supply Chain Analysis
      • Energy Management
      • Network Optimization

      By Industry

      • Advertising, Media & Entertainment
      • Financial Services
      • Healthcare & Life Sciences

      FOUNDATIONAL

      • AI & Machine Learning
      • Time Series Analysis
      • Geospatial Analysis
  • Customers
    • The World’s Fastest and Most Scalable Graph Platform

      LEARN MORE

      CUSTOMER SUCCESS STORIES

      • Ford
      • Intuit
      • JPMorgan Chase
      • READ MORE SUCCESS STORIES
      • Jaguar Land Rover
      • United Health Group
      • Xbox
  • Partners
    • The World’s Fastest and Most Scalable Graph Platform

      LEARN MORE

      PARTNER PROGRAM

      • Partner Benefits
      • TigerGraph Partners
      • Sign Up
      TigerGraph partners with organizations that offer complementary technology solutions and services.​
  • Resources
    • The World’s Fastest and Most Scalable Graph Platform

      LEARN MORE

      BLOG

      • TigerGraph Blog

      RESOURCES

      • Resource Library
      • Benchmarks
      • Demos
      • O'Reilly Graph + ML Book

      EVENTS & WEBINARS

      • Graph+AI Summit
      • Graph for All - Million Dollar Challenge
      • Events &Trade Shows
      • Webinars

      DEVELOPERS

      • Documentation
      • Ecosystem
      • Developers Hub
      • Community Forum

      SUPPORT

      • Contact Support
      • Production Guidelines

      EDUCATION

      • Training & Certifications
  • Company
    • Join the World’s Fastest and Most Scalable Graph Platform

      WE ARE HIRING

      COMPANY

      • Company Overview
      • Leadership
      • Legal Terms
      • Patents
      • Security and Compliance

      CAREERS

      • Join Us
      • Open Positions

      AWARDS

      • Awards and Recognition
      • Leader in Forrester Wave
      • Gartner Research

      PRESS RELEASE

      • Read All Press Releases
      TigerGraph Reports Exceptional Customer Growth and Product Leadership as More Market-Leading Companies Tap the Power of Graph
      March 1, 2023
      Read More »

      NEWS

      • Read All News
      The-New-Stack-Logo-square

      Multiple Vendors Make Data and Analytics Ubiquitous

      TigerGraph enhances fundamentals in latest platform update

  • START FREE
    • The World’s Fastest and Most Scalable Graph Platform

      GET STARTED

      • Request a Demo
      • CONTACT US
      • Try TigerGraph
      • START FREE
      • TRY AN ONLINE DEMO

The Intersection of Learning, Knowledge, and Language

  • TigerGraph
  • April 8, 2022
  • blog, Graph Databases, Healthcare
  • Blog >
  • The Intersection of Learning, Knowledge, and Language

This is an abbreviated and edited version of a presentation by Dan McCreary, Distinguished Engineer – Advanced Technology Collaborative at Optum, a division of UnitedHealth Group, during the Graph + AI Summit Fall 2021 conference.

Intersection of Learning, Knowledge, and Language

Watch the full session from Graph + AI Summit Fall

Today we’ll talk about the intersection of learning, knowledge and language, and where innovation is going to be occurring in Enterprise Knowledge Graphs. 

I’m a Distinguished Engineer in a group at Optum called the Advanced Technology Collaborative, which matches emerging technology with the business problems within our business units. For context, Optum employs almost 35,000 IT employees, of which 3,200 are data scientists. We’re not just focused on one domain, such as graph, and not just machine learning, but we’re looking at where these domains come together. And that’s where innovation is occurring. 

There are a lot of new ideas that might explain how you can use Enterprise Knowledge Graph (EKG) strategies. So today, we’ll explore more than graphs and TigerGraph — we’ll explore how learning, specifically machine learning, as well as symbolic learning, are going to combine with knowledge graphs symbiotically. 

Large language models such as GPT-3, or these Bert models, are in fact, knowledge graphs, and there’s a huge amount of innovation in these. Using them effectively is important because, in healthcare, at least 80% to 90% of our knowledge is tied up not in tables and columns of relational databases, but it’s tied up in documents and clinical notes, and in conversations. Every time that we record a conversation and transcribe it, we have knowledge in those transcripts. We can use that knowledge to find insight into the organization.

We’re also going to talk about the relationship between knowledge graphs and the field of thinking called Systems Thinking. We’re going to apply a way of looking at the world, a type of analysis — Systems Thinking — to our challenge of EKGs, and how to set them up, how to manage them, how to grow them, and how to think strategically about how EKGs fit into the mission of our companies and how we serve our customers. 

What Are Enterprise Knowledge Graphs?

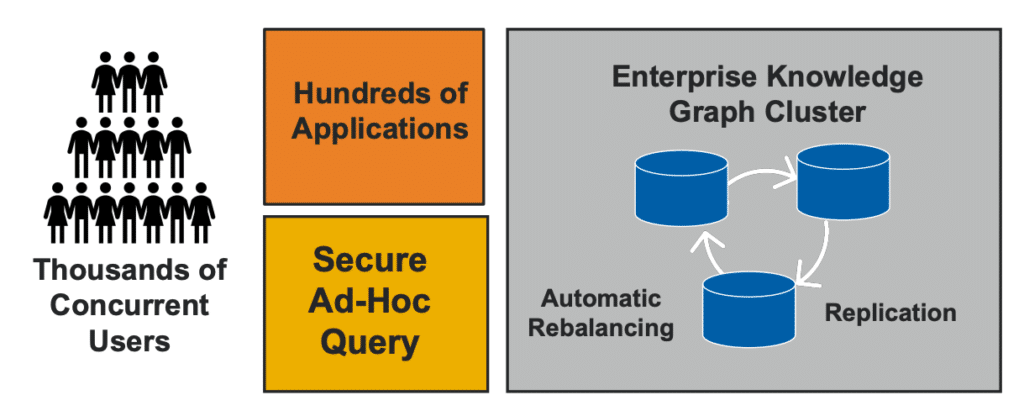
At Optum, we think that EKGs are very different from some of the other definitions out there. For this discussion, we see “enterprise” as scaling to multiple departments and growing without having to be re-architected. Think thousands of concurrent users and hundreds of applications, allowing anybody to do ad hoc queries but only see the data they should see given the roles they have. I’m talking about high availability, things like rolling upgrades, detailed high As security, fine-grained control, resource quotas, and a very large library of graph algorithms. 

Figure 1: Elements for an Enterprise Knowledge Graph

In terms of scale-out, there are several dimensions: 

  • Scaling out data sizes. Add more data to our knowledge graph without shutting down the servers 
  • Scale-out compute. Add more compute resources, more nodes, the clusters 
  • Scale-out security. Allow security to be managed, and continually monitor data quality 
  • Scale-out algorithms. Add more algorithms without slowing down the server 
  • Square out query. Add more and more concurrent queries as the system grows. 

At Optum, we’ve been working hard to build scalable knowledge graphs about health care because we have:

  • 10s of billions of edges in our system and billions of vertices 
  • 10s of millions of updates every day
  • 25,000+ concurrent users.

We have streaming interfaces so that a change reflected in an operational source system is also reflected in our customer service center screens that use the knowledge graph. This happens within 60 seconds, while our users, all of them, have 100 millisecond response times to see a full member journey of all of our customers’ use. Most importantly, we are now starting to see deep insights about clinical value over all of these systems. 

We can’t just look at one dimension of our members. We can’t just look at the times they visited our website, their emails, or their claims. We have to pull all of these things together in one place, including their net promoter score. How do all the different things that we’re working on impact their net promoter score, how is their experience with their call centers, or how they pick their plans? All of these things are tied together, and we can’t look at one little dimension at a time. Everything has to be together so we can do cross-domain queries. 

Our goal is to get the right information to the right people at the right time. It’s evolving into what we call the central nervous system of our organization, where we have intelligent triggers and proactive alerts so that all of our consumers and healthcare information care coordinators or physicians or nurses, every one of our agents, everybody that’s working in assisted living centers, all of them can get the right notification of the right information. And it’s not just clinical history, it’s also through the Internet of Things, biometric readings that are happening in real-time in our hospitals and clinics. All of those things should be able to notify people, and just the right people, at the right time.

What Is a System?

A system is, in our definition, a collection of components that interact together to produce some sort of behavior. A sample EKG system is broken down into sub-components:

  • Source systems that we gather data from
  • Change data capture events, every time there’s an insert or update or delete the streams, that we publish those events on
  • The graph database that we ingest the data into
  • All the many UI systems that we build (for dashboards and reports, and analysis and event recording). 

Plus, metadata is really a key piece of that so we can track the lineage of where our data has come from. 

What’s important about this is that these systems are inherently complex. They have lots of subsystems, and those subsystems evolve over time. As systems get larger, towards the 10 billion vertex mark, we start to see what we call emergent behavior, behavior that we couldn’t actually predict. But that starts to happen as we put together more complex systems.

Systems Thinking and Examples of its Archetypes

Systems thinking is an approach where we take a holistic look at these components, not one piece at a time, not silo by silo by silo. We’re trying to focus on all the parts and how they relate, and how they interact over time within the context of larger systems. 

Artificial Intelligence Fly Wheel

A good example of systems thinking for knowledge graphs is what we call the AI Fly Wheel, one of our archetypal patterns. As we have data in our graph, we can use that data to build machine learning models. Those machine learning models might do things like making predictions of what products a customer might want. How do we gather the feedback about what predictions people like? Why don’t we take that feedback, and add it to our data set to get more data? 

Figure 2: Key components in the AI Fly Wheel

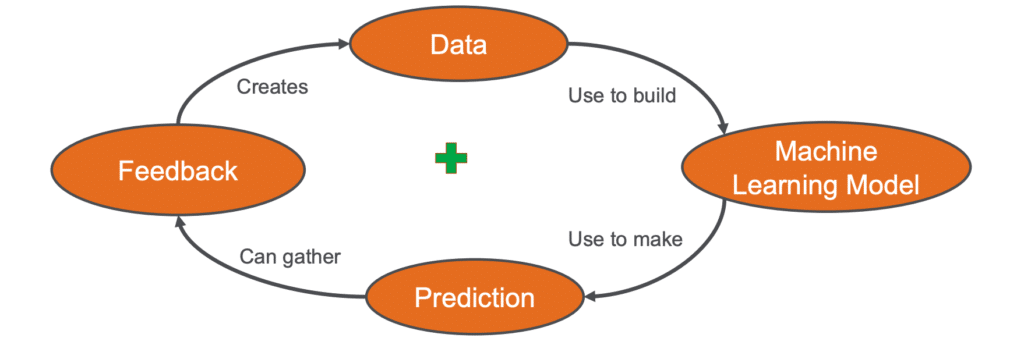
Initially, our predictions may not be very good. As we add more feedback, we get more data, we get better machine models, we make better predictions, and we get a positive feedback cycle. And that’s why we have the plus in a lot of the center of our causal loop diagrams. 

Tragedy of the Commons

Another example of an archetype is what we call the Tragedy of the Commons, a story about how farmers in our old medieval villages often had their own pastures, and there was a common area, and they had a rotation system so that each farmer could use it. If the farmers overgraze those common areas, they would become barren, and nobody could use them. So whenever there’s a common resource, we consider how to share that resource so it’s not abused. If there are too many people hitting the knowledge graph at the same time, performance may be slow. So how do we deal with shared resources?

Metcalfe’s Law or the Network Effect

Another archetype example is Metcalfe’s Law or the Network Effect. This is the value of standards and our knowledge graphs. If we have a fax machine, but none of our partners has a fax machine, the value of the fax is very little because we can’t send information to our suppliers or customers. If, however, we have a standard way of representing data, a way to move things in and out of the data that everybody understands, and we manage quality, then that network effect becomes a positive reinforcement, and is valuable.

So, standards are really important, and one of the archetypes that we use when deciding what data we should put into our knowledge graph, and how to standardize or normalize, or canonicalize that data for consistency, so that everybody can share their queries over this data. Architects need to understand how to use these Systems Thinking patterns to help expand and grow the usage of these knowledge graphs.

Systems Thinking is actually a relatively small number of about a dozen core concepts — causal loop diagrams, feedback, understanding positive and negative reinforcement, etc. The trick is, how do we apply this and find archetypes that are appropriate for our internal knowledge graphs, and when to apply them. 

Spring 2022 Graph + AI Summit

The Spring 2022 Graph + AI Summit is just over a month away, and registration is open. Don’t miss out on the industry’s only open conference dedicated to democratizing and accelerating analytics, AI, and machine learning with graph algorithms. Register for free today! 

You Might Also Like

Trillion edges benchmark: new world record beyond 100TB by TigerGraph featuring AMD based Amazon EC2 instances

Trillion edges benchmark: new world record...

March 13, 2023
Graph Databases 101: Your Top 5 Questions with Non-Technical Answers

Graph Databases 101: Your Top 5...

February 7, 2023
It’s Time to Harness the Power of Graph Technology [Infographic]

It’s Time to Harness the Power...

January 25, 2023

Introducing TigerGraph 3.0

July 1, 2020

Everything to Know to Pass your TigerGraph Certification Test

June 24, 2020

Neo4j 4.0 Fabric – A Look Behind the Curtain

February 7, 2020

TigerGraph Blog

  • Categories
    • blogs
      • About TigerGraph
      • Benchmark
      • Business
      • Community
      • Compliance
      • Customer
      • Customer 360
      • Cybersecurity
      • Developers
      • Digital Twin
      • eCommerce
      • Emerging Use Cases
      • Entity Resolution
      • Finance
      • Fraud / Anti-Money Laundering
      • GQL
      • Graph Database Market
      • Graph Databases
      • GSQL
      • Healthcare
      • Machine Learning / AI
      • Podcast
      • Supply Chain
      • TigerGraph
      • TigerGraph Cloud
    • Graph AI On Demand
      • Analysts and Research
      • Customer 360 and Entity Resolution
      • Customer Spotlight
      • Development
      • Finance, Banking, Insurance
      • Keynote
      • Session
    • Video
  • Recent Posts

    • Trillion edges benchmark: new world record beyond 100TB by TigerGraph featuring AMD based Amazon EC2 instances
    • Overview of Graph and Machine Learning with TigerGraph | Mar 8 @ 11am PST
    • Gartner Data & Analytics Summit 2023, London
    • Gartner Data and Analytics Summit, Orlando
    • Transaction Surveillance with Maximum Flow Algorithm
    TigerGraph

    Product

    SOLUTIONS

    customers

    RESOURCES

    start for free

    TIGERGRAPH DB
    • Overview
    • Features
    • GSQL Query Language
    GRAPH DATA SCIENCE
    • Graph Data Science Library
    • Machine Learning Workbench
    TIGERGRAPH CLOUD
    • Overview
    • Cloud Starter Kits
    • Login
    • FAQ
    • Pricing
    • Cloud Marketplaces
    USEr TOOLS
    • GraphStudio
    • TigerGraph Insights
    • Application Workbenches
    • Connectors and Drivers
    • Starter Kits
    • openCypher Support
    SOLUTIONS
    • Why Graph?
    industry
    • Advertising, Media & Entertainment
    • Financial Services
    • Healthcare & Life Sciences
    use cases
    • Benefits
    • Product & Service Marketing
    • Entity Resolution
    • Customer 360/MDM
    • Recommendation Engine
    • Anti-Money Laundering
    • Cybersecurity Threat Detection
    • Fraud Detection
    • Risk Assessment & Monitoring
    • Energy Management
    • Network & IT Management
    • Supply Chain Analysis
    • AI & Machine Learning
    • Geospatial Analysis
    • Time Series Analysis
    success stories
    • Customer Success Stories

    Partners

    Partner program
    • Partner Benefits
    • TigerGraph Partners
    • Sign Up
    LIBRARY
    • Resources
    • Benchmark
    • Webinars
    Events
    • Trade Shows
    • Graph + AI Summit
    • Million Dollar Challenge
    EDUCATION
    • Training & Certifications
    Blog
    • TigerGraph Blog
    DEVELOPERS
    • Developers Hub
    • Community Forum
    • Documentation
    • Ecosystem

    COMPANY

    Company
    • Overview
    • Careers
    • News
    • Press Release
    • Awards
    • Legal
    • Patents
    • Security and Compliance
    • Contact
    Get Started
    • Start Free
    • Compare Editions
    • Online Demo - Test Drive
    • Request a Demo

    Product

    • Overview
    • TigerGraph 3.0
    • TIGERGRAPH DB
    • TIGERGRAPH CLOUD
    • GRAPHSTUDIO
    • TRY NOW

    customers

    • success stories

    RESOURCES

    • LIBRARY
    • Events
    • EDUCATION
    • BLOG
    • DEVELOPERS

    SOLUTIONS

    • SOLUTIONS
    • use cases
    • industry

    Partners

    • partner program

    company

    • Overview
    • news
    • Press Release
    • Awards

    start for free

    • Request Demo
    • take a test drive
    • SUPPORT
    • COMMUNITY
    • CONTACT
    • Copyright © 2023 TigerGraph
    • Privacy Policy
    • Linkedin
    • Facebook
    • Twitter

    Copyright © 2020 TigerGraph | Privacy Policy

    Copyright © 2020 TigerGraph Privacy Policy

    • SUPPORT
    • COMMUNITY
    • COMPANY
    • CONTACT
    • Linkedin
    • Facebook
    • Twitter

    Copyright © 2020 TigerGraph

    Privacy Policy

    • Products
    • Solutions
    • Customers
    • Partners
    • Resources
    • Company
    • START FREE
    START FOR FREE
    START FOR FREE
    TigerGraph
    PRODUCT
    PRODUCT
    • Overview
    • GraphStudio UI
    • Graph Data Science Library
    TIGERGRAPH DB
    • Overview
    • Features
    • GSQL Query Language
    TIGERGRAPH CLOUD
    • Overview
    • Cloud Starter Kits
    TRY TIGERGRAPH
    • Get Started for Free
    • Compare Editions
    SOLUTIONS
    SOLUTIONS
    • Why Graph?
    use cases
    • Benefits
    • Product & Service Marketing
    • Entity Resolution
    • Customer Journey/360
    • Recommendation Engine
    • Anti-Money Laundering (AML)
    • Cybersecurity Threat Detection
    • Fraud Detection
    • Risk Assessment & Monitoring
    • Energy Management
    • Network Resources Optimization
    • Supply Chain Analysis
    • AI & Machine Learning
    • Geospatial Analysis
    • Time Series Analysis
    industry
    • Advertising, Media & Entertainment
    • Financial Services
    • Healthcare & Life Sciences
    CUSTOMERS
    read all success stories


    PARTNERS
    Partner program
    • Partner Benefits
    • TigerGraph Partners
    • Sign Up
    RESOURCES
    LIBRARY
    • Resource Library
    • Benchmark
    • Webinars
    Events
    • Trade Shows
    • Graph + AI Summit
    • Graph for All - Million Dollar Challenge
    EDUCATION
    • TigerGraph Academy
    • Certification
    Blog
    • TigerGraph Blog
    DEVELOPERS
    • Developers Hub
    • Community Forum
    • Documentation
    • Ecosystem
    COMPANY
    COMPANY
    • Overview
    • Leadership
    • Careers  
    NEWS
    PRESS RELEASE
    AWARDS
    START FREE
    Start Free
    • Request a Demo
    • SUPPORT
    • COMMUNITY
    • CONTACT
    Dr. Jay Yu

    Dr. Jay Yu | VP of Product and Innovation

    Dr. Jay Yu is the VP of Product and Innovation at TigerGraph, responsible for driving product strategy and roadmap, as well as fostering innovation in graph database engine and graph solutions. He is a proven hands-on full-stack innovator, strategic thinker, leader, and evangelist for new technology and product, with 25+ years of industry experience ranging from highly scalable distributed database engine company (Teradata), B2B e-commerce services startup, to consumer-facing financial applications company (Intuit). He received his PhD from the University of Wisconsin - Madison, where he specialized in large scale parallel database systems

    Todd Blaschka | COO

    Todd Blaschka is a veteran in the enterprise software industry. He is passionate about creating entirely new segments in data, analytics and AI, with the distinction of establishing graph analytics as a Gartner Top 10 Data & Analytics trend two years in a row. By fervently focusing on critical industry and customer challenges, the companies under Todd's leadership have delivered significant quantifiable results to the largest brands in the world through channel and solution sales approach. Prior to TigerGraph, Todd led go to market and customer experience functions at Clustrix (acquired by MariaDB), Dataguise and IBM.