Skip to content
START FOR FREE
START FOR FREE
  • SUPPORT
  • COMMUNITY
  • CONTACT
Menu
  • SUPPORT
  • COMMUNITY
  • CONTACT
MENUMENU
  • Products
    • The World’s Fastest and Most Scalable Graph Platform

      LEARN MORE

      Watch a TigerGraph Demo

      PRODUCTS

      • Why Graph?
      • Products Overview
      • What's New
      • GraphStudio User Interface
      • Visualization Toolkits
      • GSQL Query Language
      • Connectors

      TigerGRAPH ENTERPRISE

      • Enterprise Overview
      • Features

      TIGERGRAPH CLOUD

      • Cloud Overview
      • Cloud Starter Kits
      • Login/Sign Up
      • FAQ
      • Pricing
      • Marketplaces

      Graph Data Science

      • Graph Data Science Library
      • Machine Learning Workbench

      TRY TIGERGRAPH

      • Get Started for Free
      • Compare Editions
      • Test Drive - Online Demo
      • Watch Demos
      • Request a Demo
  • Solutions
    • The World’s Fastest and Most Scalable Graph Platform

      LEARN MORE

      Watch a TigerGraph Demo

      Solutions

      • Solutions Overview

      INCREASE REVENUE

      • Customer Journey/360
      • Product Marketing
      • Entity Resolution
      • Recommendation Engine

      MANAGE RISK

      • Fraud Detection
      • Anti-Money Laundering
      • Threat Detection
      • Risk Monitoring

      IMPROVE OPERATIONS

      • Supply Chain Analysis
      • Energy Management
      • Network Optimization

      By Industry

      • Advertising, Media & Entertainment
      • Financial Services
      • Healthcare & Life Sciences

      FOUNDATIONAL

      • AI & Machine Learning
      • Time Series Analysis
      • Geospatial Analysis
  • Customers
    • The World’s Fastest and Most Scalable Graph Platform

      LEARN MORE

      CUSTOMER SUCCESS STORIES

      • Citrix
      • Ford
      • Intuit
      • JPMorgan Chase
      • READ MORE SUCCESS STORIES
      • Jaguar Land Rover
      • United Health Group
      • Xbox
  • Partners
    • The World’s Fastest and Most Scalable Graph Platform

      LEARN MORE

      PARTNER PROGRAM

      • Partner Benefits
      • TigerGraph Partners
      • Sign Up
      TigerGraph partners with organizations that offer complementary technology solutions and services.​
  • Resources
    • The World’s Fastest and Most Scalable Graph Platform

      LEARN MORE

      BLOG

      • TigerGraph Blog

      RESOURCES

      • Resource Library
      • Benchmarks
      • Demos
      • O'Reilly Graph + ML Book

      EVENTS & WEBINARS

      • Graph+AI Summit
      • Trade Shows
      • Graph for All - Million Dollar Challenge
      • Webinars

      DEVELOPERS

      • Documentation
      • Ecosystem
      • Developers Hub
      • Community Forum

      SUPPORT

      • Contact Support
      • Production Guidelines

      EDUCATION

      • Certification
      • Training
  • Company
    • Join the World’s Fastest and Most Scalable Graph Platform

      WE ARE HIRING

      COMPANY

      • Company Overview
      • Leadership
      • Legal Terms

      CAREERS

      • Join Us
      • Open Positions

      AWARDS

      • Awards and Recognition
      • Leader in Forrester Wave
      • Gartner Research

      PRESS RELEASE

      • Read All Press Releases
      TigerGraph Delivers 600% ROI and $20.81M in Net Present Value in Total Economic Impact Study
      May 12, 2022
      Read More »

      NEWS

      • Read All News
      News

      TigerGraph expands its presence in France

      entrepreneur

      We Asked Entrepreneur Readers: How Do You Inspire Yourself, and Others?

  • START FOR FREE
    • The World’s Fastest and Most Scalable Graph Platform

      GET STARTED

      • Request a Demo
      • CONTACT US
      • Try TigerGraph
      • GET STARTED FOR FREE
      • TRY AN ONLINE DEMO

Introducing TigerGraph 3.1

  • Victor Lee
  • December 7, 2020
  • blog, TigerGraph
  • Blog >
  • Introducing TigerGraph 3.1

Introducing TigerGraph 3.1

by Rayees Pasha, Product Manager, TigerGraph

On December 2nd 2020, we announced the general availability release of TigerGraph version 3.1. In this blog, we would like to provide more details on the release. TigerGraph 3.1 is the first feature update in the 3.x series following the major 3.0 release earlier this year. As we round out 2020, we are pleased to offer some exciting new features as part of the 3.1. Additionally, we have added some features that build on and extend our core capabilities that have helped us become the only Graph database designed for enterprises. With 3.1, our goal is to make TigerGraph ready for the most demanding workloads and enterprise customer requirements. 

Areas of Product Focus

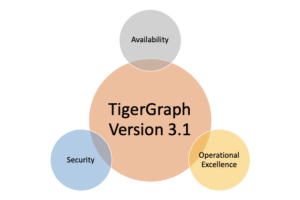
In 3.1, we have primarily focused on Availability, Security and Operational Excellence as three pillars of feature development.
TigerGraph Version 3.1

  • Availability: Enable customers to run Business critical workloads by enhancing fault tolerance in all areas of the product.
  • Security: Allow enterprise with large number of users and diverse set of use cases to use a unified system with data access safeguards.
  • Operational Excellence: Make it easier for Operations staff to support TigerGraph database through multiple interfaces 

TigerGraph 3.1 Feature Highlights

New features and enhancements in 3.1 touch all areas of the product. A quick tour of the new feature highlights in version 3.1. 

Availability:

In 3.1, we are introducing Continuous Availability as a key differentiation to ensure that TigerGraph can be run under demanding conditions and tolerate both software and hardware failures at multiple levels. We have designed Continuous Availability to go beyond the basic requirements of any system that has HA capabilities. This capability allows business continuity besides enhancing uptime of services. Specifically, we have added the following features to help attain this goal:

  • Enhanced availability for user-facing components including GSQL and GraphStudio to ensure always-on client connectivity
    • Support continuous availability with application server HA
  • Disaster Recovery Support using native Cross-region replication for core data operations
    • Allow customers to deploy TigerGraph clusters across Regions and Data Centers 

Security

As more of our customers start using TigerGraph in multiple applications, the need for shared access based on granular controls has become critical. TigerGraph is built as a physically converged but logically separate database system. In order to enable seamless collaboration between different teams, strong safeguards for data access are required to be in place to ensure the right permissions are enforced. Additionally, there should be visibility into authorization enforcement to audit the access records. With all that in mind, the following features were added to 3.1:

  • Vertex-level Access Control 
    • Similar to Row-level access: tags on individual vertices determine which users/roles have access to the data sets
    • This is a BETA feature in 3.1. We plan to enhance this feature by adding more functionality in the upcoming releases.
  • Audit Logging Enhancements
    • User and system application information for all data access requests.
    • Time of the Request Request Parameters, Status (request succeeded or failed) for all requests 
    • System management and configuration changes

Operational Excellence

In 3.0, Ease of Use and Developer Productivity were major areas of focus. We extend that to Operations teams in 3.1 with features designed at making it easier for DBAs to diagnose problems. Also, we are bringing parity to the AdminPortal by making more and more administrative tasks available through the GUI. Here are a few features in this area:

  • Granular Query level monitoring
    • Granular Memory usage reporting for queries
  • AdminPortal:
    • Support continuous availability in Admin Portal with application server HA
    • Allow customers to debug and manage database logs
    • Security setup and configuration for LDAP/SSO/SSL
    • Perform cluster configuration changes in restpp, Nginx, application server setting

Additionally, there are a number of new features on the Database Engine and Language side as part of ongoing improvements to make the product easier to use for the developers. 

  • Support for SQL-like tabular SELECT and Output
    • Easier application and developer migration from relational database
    • Allow easy integration with 3rd party BI tools
  • Read-Committed Isolation level for Querying
    • Flexibility for developers to pick Isolation level based on application needs and reduce concurrent resource contention
  • More powerful Distributed Mode queries
    • Queries run in Distributed mode support nearly the full scope of the GSQL language.

And many more … 

If you would like to get started with TigerGraph 3.1, you can download TigerGraph 3.1 binary packages at TigerGraph Download Location.

If you have any questions or feedback regarding TigerGraph version 3.1 release, please feel free to reach out to TigerGraph Product team at [email protected]

Thank you

TigerGraph Database Product Team

You Might Also Like

Graph + AI Summit - Getting the Most from Your Virtual Summit Experience

Graph + AI Summit - Getting...

May 18, 2022
3 Real-time Banking Scenarios for Operational Excellence with TigerGraph

3 Real-time Banking Scenarios for Operational...

May 17, 2022
Speeding the Process for Pharmaceutical Drug Approvals

Speeding the Process for Pharmaceutical Drug...

May 12, 2022

Introducing TigerGraph 3.0

July 1, 2020

Everything to Know to Pass your TigerGraph Certification Test

June 24, 2020

Neo4j 4.0 Fabric – A Look Behind the Curtain

February 7, 2020

TigerGraph Blog

  • Categories
    • Analyst Research
    • blog
    • blogs
      • About TigerGraph
      • Benchmark
      • Business
      • Community
      • Customer
      • Customer 360
      • Cybersecurity
      • Developers
      • eCommerce
      • Entity Resolution
      • Executive Brief
      • Finance
      • Fraud / Anti-Money Laundering
      • GQL
      • Graph Database Market
      • Graph Databases
      • Graph Gurus
      • GSQL
      • Healthcare
      • Machine Learning
      • Machine Learning / AI
      • Meetup
      • Mini Guide
      • Podcast
      • Press
      • Press Releases
      • Product
      • Supply Chain
      • TigerGraph
      • TigerGraph Cloud
      • TigerGraph Press Release
    • Cloud
    • Data Science
    • EMEA EVENTS
    • Emerging Use Cases
    • Fraud / Anti-Money Laundering
    • Healthcare
    • Machine Learning / AI
    • On-Demand Event
    • Partners
    • Recommendation Engine
    • Success Stories
    • Uncategorized
    • US EVENTS
  • Recent Posts

    • Le Big Boss /Supply Chain Dinner – Paris
    • EBA Day Vienna
    • Graph + AI Summit – Getting the Most from Your Virtual Summit Experience
    • HPE Discover
    • CDAO Exchange
    TigerGraph

    Product

    SOLUTIONS

    customers

    RESOURCES

    start for free

    PRODUCT
    • Overview
    • What's New
    • Toolkits
    • Connectors
    • Data Science Library
    TIGERGRAPH DB
    • Overview
    • No-Code Graph Analytics
    • Features
    • GSQL Query Language
    TIGERGRAPH CLOUD
    • Overview
    • Cloud Starter Kits
    • Login
    • FAQ
    • Pricing
    • Cloud Marketplaces
    GRAPHSTUDIO
    • Overview
    • Take a Test Drive
    TRY NOW
    • Get Started for Free
    • Compare Editions
    • License FAQ
    SOLUTIONS
    • Why Graph?
    industry
    • Advertising, Media & Entertainment
    • Financial Services
    • Healthcare & Life Sciences
    use cases
    • Benefits
    • Product & Service Marketing
    • Entity Resolution
    • Customer 360/MDM
    • Recommendation Engine
    • Anti-Money Laundering
    • Cybersecurity Threat Detection
    • Fraud Detection
    • Risk Assessment & Monitoring
    • Energy Management
    • Network & IT Management
    • Supply Chain Analysis
    • AI & Machine Learning
    • Geospatial Analysis
    • Time Series Analysis
    success stories
    • Customer Success Stories

    Partners

    Partner program
    • Partner Benefits
    • TigerGraph Partners
    • Sign Up
    LIBRARY
    • Resources
    • Benchmark
    • Webinars
    Events
    • Trade Shows
    • Graph + AI Summit
    • Million Dollar Challenge
    EDUCATION
    • TigerGraph Academy
    • Certification
    Blog
    • TigerGraph Blog
    DEVELOPERS
    • Developers Hub
    • Community Forum
    • Documentation
    • Ecosystem

    COMPANY

    Company
    • Overview
    • Careers
    • News
    • Press Release
    • Awards
    • Legal
    Get Started
    • Get TigerGraph
    • Compare Editions
    • Online Demo - Test Drive
    • Request a Demo

    Product

    • Overview
    • TigerGraph 3.0
    • TIGERGRAPH DB
    • TIGERGRAPH CLOUD
    • GRAPHSTUDIO
    • TRY NOW

    customers

    • success stories

    RESOURCES

    • LIBRARY
    • Events
    • EDUCATION
    • BLOG
    • DEVELOPERS

    SOLUTIONS

    • SOLUTIONS
    • use cases
    • industry

    Partners

    • partner program

    company

    • Overview
    • news
    • Press Release
    • Awards

    start for free

    • Request Demo
    • take a test drive
    • SUPPORT
    • COMMUNITY
    • CONTACT
    • Copyright © 2022 TigerGraph
    • Privacy Policy
    • Linkedin
    • Facebook
    • Twitter

    Copyright © 2020 TigerGraph | Privacy Policy

    Copyright © 2020 TigerGraph Privacy Policy

    • SUPPORT
    • COMMUNITY
    • COMPANY
    • CONTACT
    • Linkedin
    • Facebook
    • Twitter

    Copyright © 2020 TigerGraph

    Privacy Policy

    • Products
    • Solutions
    • Customers
    • Partners
    • Resources
    • Company
    • START FOR FREE
    START FOR FREE
    START FOR FREE
    TigerGraph
    PRODUCT
    PRODUCT
    • Overview
    • GraphStudio UI
    • Graph Data Science Library
    TIGERGRAPH DB
    • Overview
    • Features
    • GSQL Query Language
    TIGERGRAPH CLOUD
    • Overview
    • Cloud Starter Kits
    TRY TIGERGRAPH
    • Get Started for Free
    • Compare Editions
    SOLUTIONS
    SOLUTIONS
    • Why Graph?
    use cases
    • Benefits
    • Product & Service Marketing
    • Entity Resolution
    • Customer Journey/360
    • Recommendation Engine
    • Anti-Money Laundering (AML)
    • Cybersecurity Threat Detection
    • Fraud Detection
    • Risk Assessment & Monitoring
    • Energy Management
    • Network Resources Optimization
    • Supply Chain Analysis
    • AI & Machine Learning
    • Geospatial Analysis
    • Time Series Analysis
    industry
    • Advertising, Media & Entertainment
    • Financial Services
    • Healthcare & Life Sciences
    CUSTOMERS
    read all success stories


    PARTNERS
    Partner program
    • Partner Benefits
    • TigerGraph Partners
    • Sign Up
    RESOURCES
    LIBRARY
    • Resource Library
    • Benchmark
    • Webinars
    Events
    • Trade Shows
    • Graph + AI Summit
    • Graph for All - Million Dollar Challenge
    EDUCATION
    • TigerGraph Academy
    • Certification
    Blog
    • TigerGraph Blog
    DEVELOPERS
    • Developers Hub
    • Community Forum
    • Documentation
    • Ecosystem
    COMPANY
    COMPANY
    • Overview
    • Leadership
    • Careers  
    NEWS
    PRESS RELEASE
    AWARDS
    START FOR FREE
    Start For Free
    • Try TigerGraph Now
    • Request a Demo
    • SUPPORT
    • COMMUNITY
    • CONTACT
    Dr. Jay Yu

    Dr. Jay Yu | VP of Product and Innovation

    Dr. Jay Yu is the VP of Product and Innovation at TigerGraph, responsible for driving product strategy and roadmap, as well as fostering innovation in graph database engine and graph solutions. He is a proven hands-on full-stack innovator, strategic thinker, leader, and evangelist for new technology and product, with 25+ years of industry experience ranging from highly scalable distributed database engine company (Teradata), B2B e-commerce services startup, to consumer-facing financial applications company (Intuit). He received his PhD from the University of Wisconsin - Madison, where he specialized in large scale parallel database systems

    Todd Blaschka | COO

    Todd Blaschka is a veteran in the enterprise software industry. He is passionate about creating entirely new segments in data, analytics and AI, with the distinction of establishing graph analytics as a Gartner Top 10 Data & Analytics trend two years in a row. By fervently focusing on critical industry and customer challenges, the companies under Todd's leadership have delivered significant quantifiable results to the largest brands in the world through channel and solution sales approach. Prior to TigerGraph, Todd led go to market and customer experience functions at Clustrix (acquired by MariaDB), Dataguise and IBM.