Skip to content
START FOR FREE
START FOR FREE
  • SUPPORT
  • COMMUNITY
Menu
  • SUPPORT
  • COMMUNITY
MENUMENU
  • Products
    • The World’s Fastest and Most Scalable Graph Platform

      LEARN MORE

      Watch a TigerGraph Demo

      TIGERGRAPH CLOUD

      • Overview
      • TigerGraph Cloud Suite
      • FAQ
      • Pricing

      USER TOOLS

      • GraphStudio
      • Insights
      • Application Workbenches
      • Connectors and Drivers
      • Starter Kits
      • openCypher Support

      TIGERGRAPH DB

      • Overview
      • GSQL Query Language
      • Compare Editions

      GRAPH DATA SCIENCE

      • Graph Data Science Library
      • Machine Learning Workbench
  • Solutions
    • The World’s Fastest and Most Scalable Graph Platform

      LEARN MORE

      Watch a TigerGraph Demo

      Solutions

      • Solutions Overview

      INCREASE REVENUE

      • Customer Journey/360
      • Product Marketing
      • Entity Resolution
      • Recommendation Engine

      MANAGE RISK

      • Fraud Detection
      • Anti-Money Laundering
      • Threat Detection
      • Risk Monitoring

      IMPROVE OPERATIONS

      • Supply Chain Analysis
      • Energy Management
      • Network Optimization

      By Industry

      • Advertising, Media & Entertainment
      • Financial Services
      • Healthcare & Life Sciences

      FOUNDATIONAL

      • AI & Machine Learning
      • Time Series Analysis
      • Geospatial Analysis
  • Customers
    • The World’s Fastest and Most Scalable Graph Platform

      LEARN MORE

      CUSTOMER SUCCESS STORIES

      • Ford
      • Intuit
      • JPMorgan Chase
      • READ MORE SUCCESS STORIES
      • Jaguar Land Rover
      • United Health Group
      • Xbox
  • Partners
    • The World’s Fastest and Most Scalable Graph Platform

      LEARN MORE

      PARTNER PROGRAM

      • Partner Benefits
      • TigerGraph Partners
      • Sign Up
      TigerGraph partners with organizations that offer complementary technology solutions and services.​
  • Resources
    • The World’s Fastest and Most Scalable Graph Platform

      LEARN MORE

      BLOG

      • TigerGraph Blog

      RESOURCES

      • Resource Library
      • Benchmarks
      • Demos
      • O'Reilly Graph + ML Book

      EVENTS & WEBINARS

      • Graph+AI Summit
      • Graph for All - Million Dollar Challenge
      • Events &Trade Shows
      • Webinars

      DEVELOPERS

      • Documentation
      • Ecosystem
      • Developers Hub
      • Community Forum

      SUPPORT

      • Contact Support
      • Production Guidelines

      EDUCATION

      • Training & Certifications
  • Company
    • Join the World’s Fastest and Most Scalable Graph Platform

      WE ARE HIRING

      COMPANY

      • Company Overview
      • Leadership
      • Legal Terms
      • Patents
      • Security and Compliance

      CAREERS

      • Join Us
      • Open Positions

      AWARDS

      • Awards and Recognition
      • Leader in Forrester Wave
      • Gartner Research

      PRESS RELEASE

      • Read All Press Releases
      TigerGraph Reports Exceptional Customer Growth and Product Leadership as More Market-Leading Companies Tap the Power of Graph
      March 1, 2023
      Read More »

      NEWS

      • Read All News
      The-New-Stack-Logo-square

      Multiple Vendors Make Data and Analytics Ubiquitous

      TigerGraph enhances fundamentals in latest platform update

  • START FREE
    • The World’s Fastest and Most Scalable Graph Platform

      GET STARTED

      • Request a Demo
      • CONTACT US
      • Try TigerGraph
      • START FREE
      • TRY AN ONLINE DEMO

Use Cases of Graph Databases in Automotive Applications

  • TigerGraph
  • May 3, 2022
  • blog, Business, Supply Chain
  • Blog >
  • Use Cases of Graph Databases in Automotive Applications

This article was originally published on Medium.com by Behzad Benam, IT Consultant & Architect at msg, on April 25, 2022, and is republished with permission. 

TigerGraph offers efficient solutions for creating graph databases for applications in the automotive industry.

Sample Graph

Getting the data representation right is a critical decision in any data-driven project. The graph type of data representation was initially used as a recommendation by Netflix, Google, Linkedin, and Amazon. Compared to relational databases with tables connected by primary and foreign keys, we have nodes and edges connecting nodes and defining relationships in a graph database.

We usually use query languages to access data in a database. In relational databases, we often use SQL as the query language. A graph database is a NoSQL database, and data access is supported by query languages such as Cypher, GraphQL, Gremlin, AQL, or SPARQL. Below, I will present use cases from the automotive industry that are likely to be applicable in other sectors. The aim is to show that the automotive industry can take advantage of graph databases and take more significant steps toward digitizing the industry much faster.

Product Management

Product management as a primary category includes three use cases: production, sales/after-sales, and supply chain management. The exciting point about implementing the graph databases is that you can create each graph database separately and then connect them via new relationships to get a more extensive data model of the system as a whole.

Separating graph databases of all system elements reduces complexity in the earlier database design process. After designing each graph database, we can connect all graph databases by finding the right nodes and adding the required relationships.

Production Management

Product and supplier-related data are the most significant nodes in the production management graph database. A product has a production process that includes multiple components delivered by a supplier. A product has documentation and a manual. The production receives the product order from the sales organization and checks the technical availability such as hardware and software components and test routines. The system will notify the customer when the production order is complete.

Sales and After-sales Management

The sales organization, customer, and product are the most influential data in this graph database. Customers can request the purchase, repair of the product, or maintenance. The customer could also ask for information about the product or even request a resale, which the original retailer could likely handle.

Supply Chain Management

Suppliers should deliver a bug-free product and test it in advance. The vehicle production team should schedule and synchronize all testing required for a supplier’s product at vehicle production. All test results should be stored in a documentation database to be accessible to the customer service team.

System Safety

Safety mechanisms should avoid unacceptable risks resulting in product behavior. One aspect is functional safety considering random hardware failures and systematic failures. Another aspect of safety is looking at it from an operational perspective and what could go wrong in a given scenario or which scenarios are still unknown to designers. We can show that graph databases can be applied to both safety aspects. Typically, a safety analysis based on hardware failures in functional safety and trigger events in the safety of the intended function (SOTIF) is performed to derive overarching safety requirements or goals.

Functional Safety: Component Reliability and Safety

System components and properties are the central nodes in the graph database for functional safety analysis. The vehicle condition can change positively depending on strategic, tactical, or operational tasks and negatively due to component malfunctions. Safety measures can make the system stable again. These events are a part of relationships and properties between two different system components. The Fault-Tolerant Time Interval (FTTI) can be viewed as relationship property, whether we can achieve it or not.

Safety of Intended Function (SOTIF)

The basis of SOTIF analysis could be similar to functional safety analysis but using different data, relationships, and safety mechanisms. The functional components are the central nodes in the graph database for SOTIF analysis. The vehicle status can be changed positively depending on strategic, tactical, or operational tasks and negatively by triggering events in the corresponding driving scenarios.

Safety measures can make the system stable again if a functional component violates a safety goal. The “triggering events” are not hardware component failures and are all events or functional component failures that harm the vehicle’s driving behavior. An example could be a pedestrian or cyclist suddenly appearing in front of a car. Each new undesired event can make the system unstable and requires a dedicated safety mechanism to bring the system into a safe state.

System Security

Automotive security should ensure the integrity, authenticity, confidentiality, and availability of the system. There are different levels of security analysis in automotive applications. The first level is the embedded level. An attacker will attempt to access the embedded hardware communication buses, such as the CAN bus, to manipulate memory or an actuator value. The second security aspect is on the cloud side or in the vehicle control center. The third aspect is the communication between vehicles and infrastructure or backend.

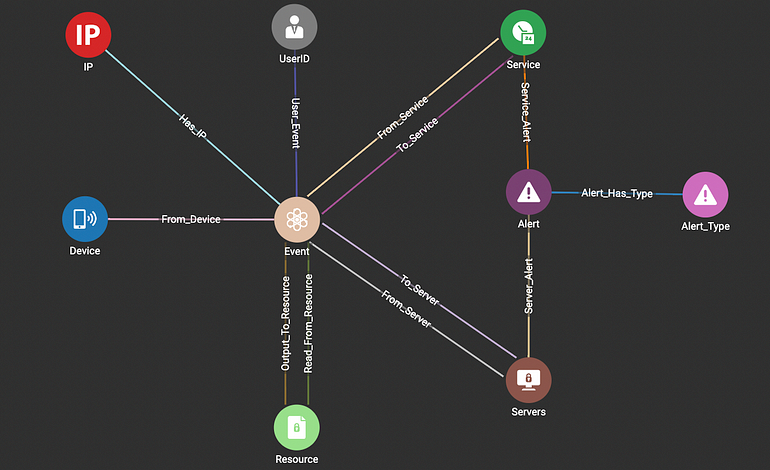
Depending on which level of security analysis is our objective, we should take the central nodes. For example, we should consider hardware or functional components at the embedded level. We usually consider a machine (Windows, Mac, etc.) as an element of IT security, and users and their permissions are the nodes and relationships.

The goal is not only to know who is gaining illegal access to the vehicle but also to design a robust system architecture and security mechanisms against possible attacks. All data communicated between the vehicle and infrastructure or backend can affect the vehicle status from a security point of view. It could also be a negative impact emanating from an attacker in any state. A security mechanism can be modeled as a relationship to make the system stable again after an attack.

Summary

A graph database is a general approach to representing data efficiently. We can benefit more from this approach when the system is very complex, and there is a large amount of system data interacting with each other, and they have complex relationships. A fundamental step in creating a graph database is what part of the data is taken as a node and how relationships relate to those nodes.

When making this decision, we must consider system elements, stakeholders, possible use cases, and scenarios. The goal should be to create a database of the whole system and show all interactions between system elements and stakeholders in different use cases and scenarios from the point of view of the analysis goal. Graph databases allow us to model the entire system and understand all interactions between all stakeholders.

We can reduce the risks of the system by modeling a single risk analysis graph for all possible risks, including safety and security. Graph databases help us visualize the entire system, analyze, detect, and mitigate all potential hazards or threats in real-time, and ultimately recover the system and protect all assets. The application of machine learning is an added value to keep systems up to date against cyber attacks in the next step.

You Might Also Like

Trillion edges benchmark: new world record beyond 100TB by TigerGraph featuring AMD based Amazon EC2 instances

Trillion edges benchmark: new world record...

March 13, 2023
Graph Databases 101: Your Top 5 Questions with Non-Technical Answers

Graph Databases 101: Your Top 5...

February 7, 2023
It’s Time to Harness the Power of Graph Technology [Infographic]

It’s Time to Harness the Power...

January 25, 2023

Introducing TigerGraph 3.0

July 1, 2020

Everything to Know to Pass your TigerGraph Certification Test

June 24, 2020

Neo4j 4.0 Fabric – A Look Behind the Curtain

February 7, 2020

TigerGraph Blog

  • Categories
    • blogs
      • About TigerGraph
      • Benchmark
      • Business
      • Community
      • Compliance
      • Customer
      • Customer 360
      • Cybersecurity
      • Developers
      • Digital Twin
      • eCommerce
      • Emerging Use Cases
      • Entity Resolution
      • Finance
      • Fraud / Anti-Money Laundering
      • GQL
      • Graph Database Market
      • Graph Databases
      • GSQL
      • Healthcare
      • Machine Learning / AI
      • Podcast
      • Supply Chain
      • TigerGraph
      • TigerGraph Cloud
    • Graph AI On Demand
      • Analysts and Research
      • Customer 360 and Entity Resolution
      • Customer Spotlight
      • Development
      • Finance, Banking, Insurance
      • Keynote
      • Session
    • Video
  • Recent Posts

    • Trillion edges benchmark: new world record beyond 100TB by TigerGraph featuring AMD based Amazon EC2 instances
    • Overview of Graph and Machine Learning with TigerGraph | Mar 8 @ 11am PST
    • Gartner Data & Analytics Summit 2023, London
    • Gartner Data and Analytics Summit, Orlando
    • Transaction Surveillance with Maximum Flow Algorithm
    TigerGraph

    Product

    SOLUTIONS

    customers

    RESOURCES

    start for free

    TIGERGRAPH DB
    • Overview
    • Features
    • GSQL Query Language
    GRAPH DATA SCIENCE
    • Graph Data Science Library
    • Machine Learning Workbench
    TIGERGRAPH CLOUD
    • Overview
    • Cloud Starter Kits
    • Login
    • FAQ
    • Pricing
    • Cloud Marketplaces
    USEr TOOLS
    • GraphStudio
    • TigerGraph Insights
    • Application Workbenches
    • Connectors and Drivers
    • Starter Kits
    • openCypher Support
    SOLUTIONS
    • Why Graph?
    industry
    • Advertising, Media & Entertainment
    • Financial Services
    • Healthcare & Life Sciences
    use cases
    • Benefits
    • Product & Service Marketing
    • Entity Resolution
    • Customer 360/MDM
    • Recommendation Engine
    • Anti-Money Laundering
    • Cybersecurity Threat Detection
    • Fraud Detection
    • Risk Assessment & Monitoring
    • Energy Management
    • Network & IT Management
    • Supply Chain Analysis
    • AI & Machine Learning
    • Geospatial Analysis
    • Time Series Analysis
    success stories
    • Customer Success Stories

    Partners

    Partner program
    • Partner Benefits
    • TigerGraph Partners
    • Sign Up
    LIBRARY
    • Resources
    • Benchmark
    • Webinars
    Events
    • Trade Shows
    • Graph + AI Summit
    • Million Dollar Challenge
    EDUCATION
    • Training & Certifications
    Blog
    • TigerGraph Blog
    DEVELOPERS
    • Developers Hub
    • Community Forum
    • Documentation
    • Ecosystem

    COMPANY

    Company
    • Overview
    • Careers
    • News
    • Press Release
    • Awards
    • Legal
    • Patents
    • Security and Compliance
    • Contact
    Get Started
    • Start Free
    • Compare Editions
    • Online Demo - Test Drive
    • Request a Demo

    Product

    • Overview
    • TigerGraph 3.0
    • TIGERGRAPH DB
    • TIGERGRAPH CLOUD
    • GRAPHSTUDIO
    • TRY NOW

    customers

    • success stories

    RESOURCES

    • LIBRARY
    • Events
    • EDUCATION
    • BLOG
    • DEVELOPERS

    SOLUTIONS

    • SOLUTIONS
    • use cases
    • industry

    Partners

    • partner program

    company

    • Overview
    • news
    • Press Release
    • Awards

    start for free

    • Request Demo
    • take a test drive
    • SUPPORT
    • COMMUNITY
    • CONTACT
    • Copyright © 2023 TigerGraph
    • Privacy Policy
    • Linkedin
    • Facebook
    • Twitter

    Copyright © 2020 TigerGraph | Privacy Policy

    Copyright © 2020 TigerGraph Privacy Policy

    • SUPPORT
    • COMMUNITY
    • COMPANY
    • CONTACT
    • Linkedin
    • Facebook
    • Twitter

    Copyright © 2020 TigerGraph

    Privacy Policy

    • Products
    • Solutions
    • Customers
    • Partners
    • Resources
    • Company
    • START FREE
    START FOR FREE
    START FOR FREE
    TigerGraph
    PRODUCT
    PRODUCT
    • Overview
    • GraphStudio UI
    • Graph Data Science Library
    TIGERGRAPH DB
    • Overview
    • Features
    • GSQL Query Language
    TIGERGRAPH CLOUD
    • Overview
    • Cloud Starter Kits
    TRY TIGERGRAPH
    • Get Started for Free
    • Compare Editions
    SOLUTIONS
    SOLUTIONS
    • Why Graph?
    use cases
    • Benefits
    • Product & Service Marketing
    • Entity Resolution
    • Customer Journey/360
    • Recommendation Engine
    • Anti-Money Laundering (AML)
    • Cybersecurity Threat Detection
    • Fraud Detection
    • Risk Assessment & Monitoring
    • Energy Management
    • Network Resources Optimization
    • Supply Chain Analysis
    • AI & Machine Learning
    • Geospatial Analysis
    • Time Series Analysis
    industry
    • Advertising, Media & Entertainment
    • Financial Services
    • Healthcare & Life Sciences
    CUSTOMERS
    read all success stories


    PARTNERS
    Partner program
    • Partner Benefits
    • TigerGraph Partners
    • Sign Up
    RESOURCES
    LIBRARY
    • Resource Library
    • Benchmark
    • Webinars
    Events
    • Trade Shows
    • Graph + AI Summit
    • Graph for All - Million Dollar Challenge
    EDUCATION
    • TigerGraph Academy
    • Certification
    Blog
    • TigerGraph Blog
    DEVELOPERS
    • Developers Hub
    • Community Forum
    • Documentation
    • Ecosystem
    COMPANY
    COMPANY
    • Overview
    • Leadership
    • Careers  
    NEWS
    PRESS RELEASE
    AWARDS
    START FREE
    Start Free
    • Request a Demo
    • SUPPORT
    • COMMUNITY
    • CONTACT
    Dr. Jay Yu

    Dr. Jay Yu | VP of Product and Innovation

    Dr. Jay Yu is the VP of Product and Innovation at TigerGraph, responsible for driving product strategy and roadmap, as well as fostering innovation in graph database engine and graph solutions. He is a proven hands-on full-stack innovator, strategic thinker, leader, and evangelist for new technology and product, with 25+ years of industry experience ranging from highly scalable distributed database engine company (Teradata), B2B e-commerce services startup, to consumer-facing financial applications company (Intuit). He received his PhD from the University of Wisconsin - Madison, where he specialized in large scale parallel database systems

    Todd Blaschka | COO

    Todd Blaschka is a veteran in the enterprise software industry. He is passionate about creating entirely new segments in data, analytics and AI, with the distinction of establishing graph analytics as a Gartner Top 10 Data & Analytics trend two years in a row. By fervently focusing on critical industry and customer challenges, the companies under Todd's leadership have delivered significant quantifiable results to the largest brands in the world through channel and solution sales approach. Prior to TigerGraph, Todd led go to market and customer experience functions at Clustrix (acquired by MariaDB), Dataguise and IBM.