


Why Does This Matter?
Unfortunately, not all data on the Internet comes in nicely packaged CSV files. In fact, frequently, one might want to use data from popular APIs, but how does one load that in a graph?
Agenda
- Look at the PokéAPI Dataset
- Create a Graph
- Load Data from the API to Your Graph
Step 0: Set Up
In this blog, we’ll be using Python 3 (more specifically Python 3.6.9), requests, json, and pyTigerGraph. You can either create a notebook on Colab or run it locally on your computer, but, for the purposes of this lesson, I’d recommend you to use Colab.
If you haven’t already, you’ll need to install pyTigerGraph. If you’re using Colab, here’s how to install it:
!pip install pyTigerGraph
In this blog, we are using version 0.0.9.6.2 of pyTigerGraph.
Next, you’ll want to make sure you have a box ready. If you don’t already have a box ready, do the following:
- Go to http://tgcloud.io/.
- Click My Solution.
- Click Create New Solution.
- Click “Blank Graph.”
- Go through steps 1–4 to get a free box; keep note of your domain name.
- Click “Start Solution.”
Step 1: Explore PokéAPI
To start, I decided to use the PokéAPI. For those of you who don’t know, Pokémon is a popular video game and card game in which players collect animal-like creatures (known as Pokémon) and battle with them.
For purposes of this graph, we’re just going to add:
- Pokémon Name
- Pokémon Type (water, fire, etc.)
Next, we’ll explore the data. The documentation is located here: https://pokeapi.co/docs/v2. More specifically, we’ll be looking at the Pokémon endpoint.

We’re going to be use Python to create our graph. The three libraries we’ll be using are requests (to make the requests), json (to nicely print our data), and pyTigerGraph (to handle everything related to the graph).
import requests
import json
import pyTigerGraph as tg
Next, look at the Pokémon section of the API. In the example, a GET request was made to the link https://pokeapi.co/api/v2/pokemon/12/. Let’s imitate that in our Python code:
URL = "https://pokeapi.co/api/v2/pokemon/12/" # URLres = requests.get(url = URL).json() # Makes the GET Requestprint(json.dumps(res, indent = 2)) # Printing the Results
This should print out a big JSON object. We can look at the species and type with:
print(res["species"])print(res["types"])
Step 2: Create Graph in TigerGraph
First, start a blank solution in TigerGraph Cloud. Keep note of your domain name! Then, in your code, create the connection:
conn = tg.TigerGraphConnection(host="https://DOMAIN.i.tgcloud.io", password="tigergraph", gsqlVersion="3.0.5", useCert=True)
We’re going to use GSQL to create the graph. In this example, we’re going to need two vertices: Pokemon and Type. Those should be connected with an edge (POKEMON_TYPE). Let’s add that to the code:
# Sets up connection with GSQLprint(conn.gsql('ls', options=[]))# Create Edges (POKEMON_TYPE) and Vertices (Pokemon and Type)print(conn.gsql('''CREATE VERTEX Pokemon (PRIMARY_ID name STRING) WITH primary_id_as_attribute="true"CREATE VERTEX Type (PRIMARY_ID type STRING) WITH primary_id_as_attribute="true"CREATE UNDIRECTED EDGE POKEMON_TYPE (FROM Pokemon, TO Type)''', options=[]))
print(conn.gsql('''CREATE GRAPH pokemon(Pokemon, Type, POKEMON_TYPE)''', options=[])) # Create the Graph

You’ve now created the graph! It’s time to load data!
Step 3: Load Data from API
To start, you’ll need to update your connection credentials by updating the graphname and adding a token.
conn.graphname = "pokemon"conn.apiToken = conn.getToken(conn.createSecret())
Now, we’ll try adding just one Pokémon, butterfree, to our graph. This will be using the request we made above.
URL = "https://pokeapi.co/api/v2/pokemon/12/" # URLres = requests.get(url = URL).json() # Makes the GET Requestprint(json.dumps(res, indent = 2)) # Printing the Results
To do this, we are going to “upsert” (which I suppose you can think of as “upload”) the data into TigerGraph. First, we’ll upsert the species to the Pokemon vertex.
conn.upsertVertex("Pokemon", res["species"]["name"], attributes={"name": res["species"]["name"] })
Awesome! Next, we’ll iterate through the types and connect the Pokémon to all its types.
for ty in res["types"]: conn.upsertVertex("Type", ty["type"]["name"], attributes={"type": ty["type"]["name"] }) conn.upsertEdge("Pokemon", res["species"]["name"], "POKEMON_TYPE", "Type", ty["type"]["name"])
If all functioned, congratulations! You’re done! Now you can add many more Pokémon to your graph:
for i in range(1,100): # You can change the number based on how many Pokémon you want to add URL = f"https://pokeapi.co/api/v2/pokemon/{i}/" # URL res = requests.get(url = URL).json() # We don't have any parameters. conn.upsertVertex("Pokemon", res["species"]["name"], attributes={"name": res["species"]["name"] }) for ty in res["types"]: conn.upsertVertex("Type", ty["type"]["name"], attributes={"type": ty["type"]["name"] }) conn.upsertEdge("Pokemon", res["species"]["name"], "POKEMON_TYPE", "Type", ty["type"]["name"]) print("Added " + res["species"]["name"])
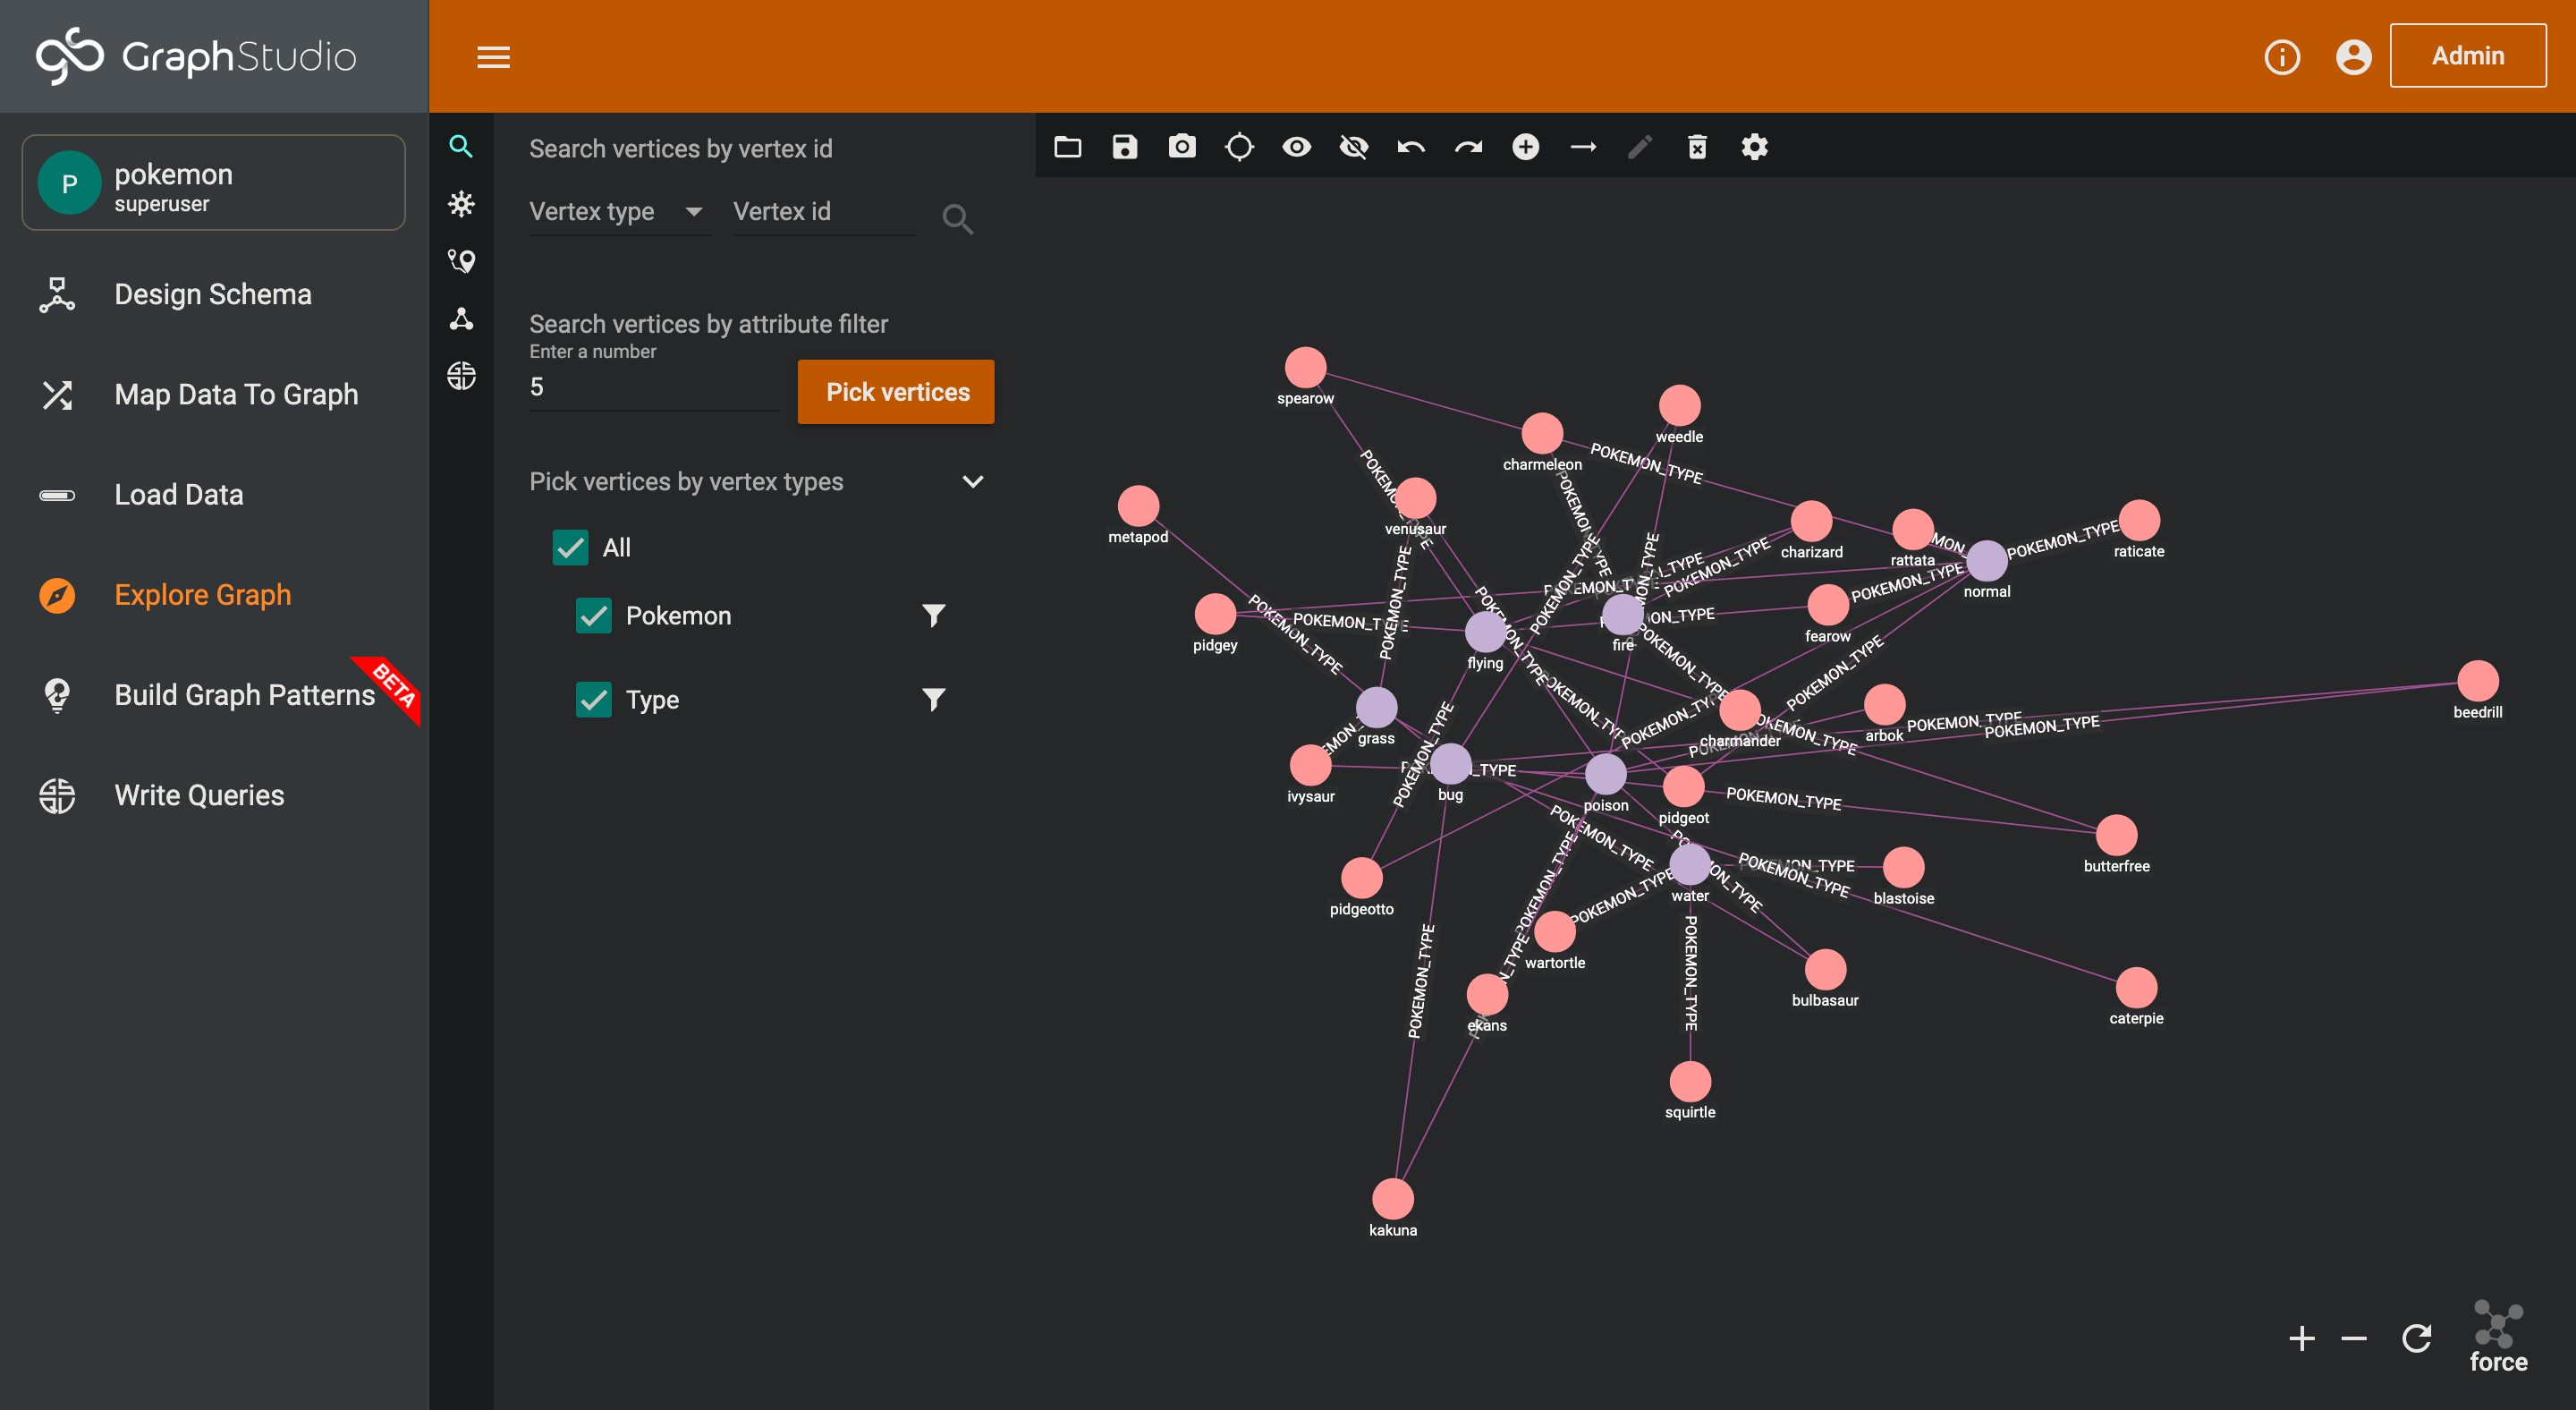
Head over to GraphStudio where you can check out how your graph looks! If everything loaded, then you did it! Congrats!
Step 4: Your Turn!
Now that we have walked through this example, it’s your turn to explore! Pick out any API, then create a graph with it using pyTigerGraph. You could even try calling additional endpoints and continue to enhance the graph! You’ve got this, and I’m excited to see what you’ll develop!
Resources
You can check out the project on Google Colab: https://colab.research.google.com/drive/1eIBETCGq18tvp9_DflGjIWV3EdcUM5hs?usp=sharing


