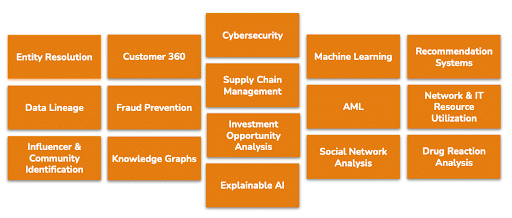
Do any of these apply to you?
For TigerGraph partners, the potential is huge. We’re solving $100 million+ business problems.
Pilot projects run anywhere from three weeks to three months, and a full implementation can extend for another nine to 12 months. TigerGraph Service Partners’ billable fees can be around $1.5 million per year, based on typical day rates—and Returns can be higher if you’re basing your business model on an outcome or value-based approach.
Graph analytics can become the fastest growing line of business in your portfolio within the next year or two—we’ve seen this occur time and again with other partners. So, the service opportunity is significant: high-margin and high-value and leveraging an emerging technology that has unique business outcomes.
In terms of services revenue, from a strategic advisory perspective on down through data strategy and data science perspective, these are large engagements that have a lot of value and can deliver significant returns to the business in very short order.
So, how do we work with our partners and their clients? From the top-down, we look at both setup and design, as well as build and test and deploy. And, from an executive accountability perspective, it’s streamlined in terms of how the integrator is going to be immensely valuable for driving C-level awareness of the challenges and of the outcomes. And then from a project management perspective, that’s bread and butter for every systems integrator.
If you dive further into the business analysis, the data engineering, and the graph setup, we start to see a transition to where we start to work more closely with the partner, and through them, help clients achieve the outcomes they’re looking to drive toward. And then, finally, from the test and go live perspective, and the change management perspective, that’s how we see adoption, moving from one use case to another across the business.
Please feel free to reach out to Michael Shaler to discuss how we can help you establish your next set of initiatives and projects based on graph analytics.
You can listen to the full presentation here.