TigerGraph is The Key to Approving Pharmaceutical Drugs Faster
- Blog >
- TigerGraph is The Key to Approving Pharmaceutical Drugs Faster
Why is there focus on more drugs, faster?
The need for rapid drug discovery and approval has never been more salient as large pharmaceutical companies navigate rising costs¹, substantial price pressure² and record lows in both drug approval rates and phase III pipeline proportions³. Covid has only strengthened the pressure on pharma margins, with sharp reductions in detailing activity⁴, disruptive hesitation from trial participants⁵, widespread deferral of treatments⁶ and unexpected setup costs of remote working⁷.
Large pharmaceutical companies are battling on two fronts to both reduce the ~10 year average drug development timeline and also increase the number of drugs that make it to approval – which is currently sitting at only 12%⁸.
Speeding up drug development timelines and increasing the number of drugs that get approved is the only way for large pharmaceutical companies to survive in an increasingly commoditized and competitive market.
In short: we need more drugs, and faster.
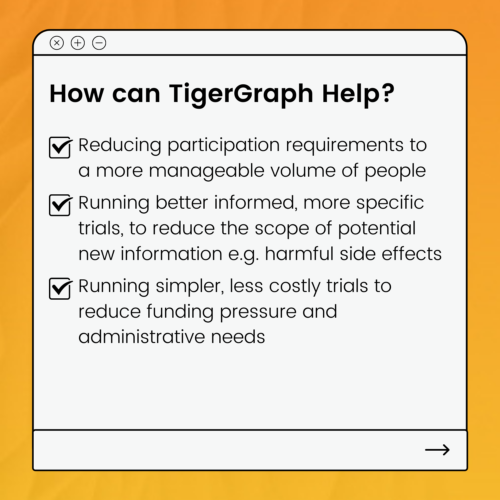
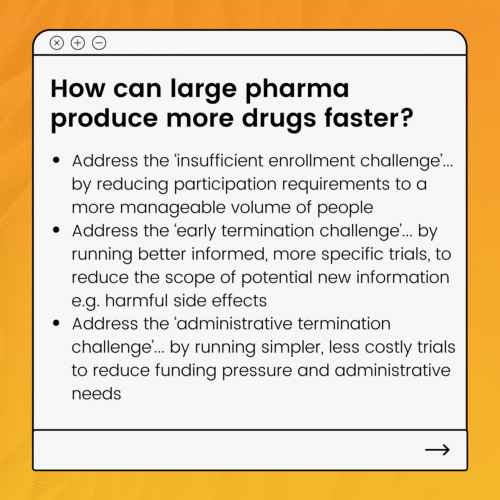
So the solution is fewer participants, in more specific and less costly trials. That is, trials must be more targeted. And how can trials be more targeted?
Trials can be more targeted if clinical research teams are able to utilise more of the existing information already available across the world to aid discovery, research and prep – building on what already exists and trialling only the specific gaps in information. Meaning less duplication, less cost and less waste – and much faster results.
If it’s that simple, what’s the problem?
The sheer quantity of information available globally commands very lengthy synthesis processes – where teams of people must spend months, or even years, combing through everything to find, analyse and organise the relevant information from all possible sources. For example, to make use of historical trial data, the team must find studies that meet research criteria, annotate them, and perform statistical analyses to summarise the findings.11 And clinical trial data isn’t the only data source the team must comb through. Other data sources could include for example genomics databases, medical journals, medical databases, patents databases or published competitor data.
Why is all of this information synthesis done manually and not automatically?
In theory, everything can be automated – and this seems like a perfect example. But there are a few things that make automating this synthesis process hard.
First – the information is in different databases, in varying formats and it’s mostly unstructured. That means generally a single computer application can’t meaningfully search through it all at once.
Next – often the relevant information to be extracted is actually found through inference. Clinical research teams can combine learnings from two different sources into a third piece of inferred information that is relevant for the new scenario. Most computer applications can’t infer information very easily – especially not from multiple sources and in multiple formats.
And Then – even when all information has been transformed and combined into a single data store or lake of some sort, often the information has differing levels of confidentiality which must be respected in the access permissions given to users. Balancing the ability to search all of the data holistically with the ability to construct privacy walls throughout the data is a complex technical challenge for most technologies.
And Finally (as if all of that wasn’t complex enough!) – the superset of information that needs to be synthesized for this process is not a static, finished library. There are new trials, new discoveries, new patents, new learnings that are being created and published all the time, all over the world – and all of these must be factored into the process. The ability to constantly add new data into the process can create major automation headaches – especially when the automation rests on some pre-defined or hard-coded rules.
So how does TigerGraph address these challenges and make it possible to automate synthesis?
TigerGraph connects all of your data within its own database and then enables you to use its native and customisable algorithms to search all or any part of that data at once. You could load for example trial data, medical data, patent data, drug or patient data all into the same graph database and then ask any question you need of that connected data. It presents to you the results of your search both as visualised insight and as machine-readable output that can serve as an input to another automated process or visualisation tool.
So what sort of insight could I get from my data using TigerGraph
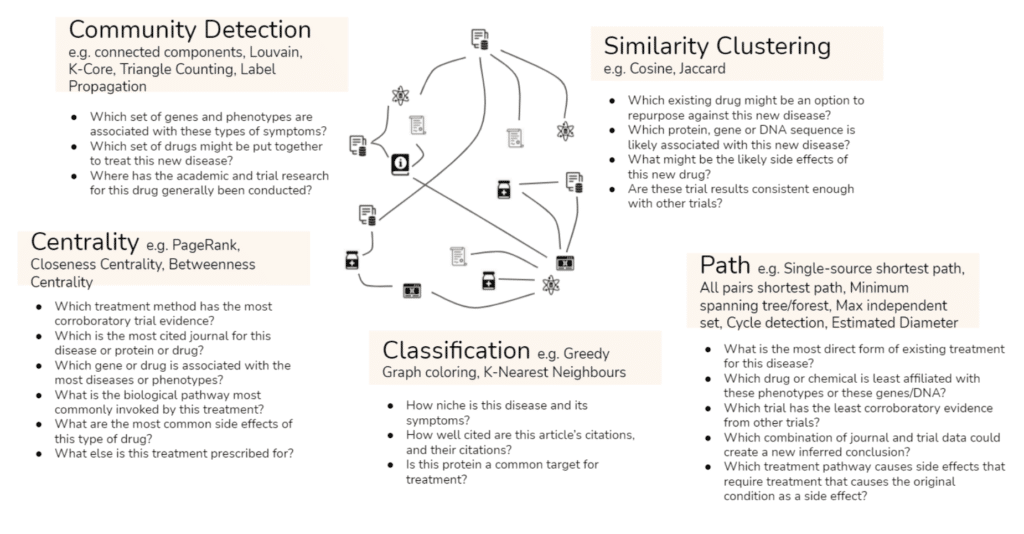
There are so many different questions you can ask of your connected data that we find it easiest to group them into categories of questions – or in other words types of algorithms. For example, you could identify whether there are specific genes or phenotypes associated with specific symptoms using community detection algorithms, or you could understand how well-cited an article is, and how well-cited its own citations are, using our classification algorithms.
Put simply, with TigerGraph you can automate information synthesis at scale, all in real time. And we know that automated information synthesis is what will drive accelerated drug discovery timelines and enable much more targeted less costly trials.
Does TigerGraph replace anything in my existing architecture?
TigerGraph is additive to your architecture – and is really two technologies for the price of one: a graph database and a relationship analytics engine. Its primary contribution to your business is its unique analytical insight – derived from a combination of its ability to connect your data together and at the same time perform sophisticated analytical queries on that connected data.
It runs on top of your strategic cloud provider, compressing the data it stores – meaning lower storage and compute costs than alternative cloud based approaches. It does not replace your cloud architecture.
It then outputs insight into your strategic AI/ML or data visualisation tools – and it can make that insight available to you in whichever format is most appropriate – whether through the native visualisation UI, or whether in a machine readable output such as CSV or JSON. Again, TigerGraph is additive to your data architecture – and is intended to enhance and not to replace your AI or visualisation stack.
The Database
- Compatible with and underpinned by any major cloud server (AWS, GCP, Azure), whether private or public – as well as being available on premise
- Consumes data in multiple input formats – e.g. CSV, JSON – in batch or via realtime API
- Scales horizontally – meaning the user experiences a single database even if underneath it’s spread across multiple servers
- Produces query results in real-time (TigerGraph can query more than the population of Greece every second, per server)
- 100,000 updates to the data per second, per server (equivalent to the population of the Seychelles!)
The Analytics Engine on top of the Database
- Get insight from day one with inbuilt native algorithms such as Community Detection and Classification
- De-duplicate and match data using native entity resolution algorithms even if there is no easy matching ID – enhancing the quality of your data from day one
- Infer information using native algorithms such as Cosine or Jaccard similarity
- Write any query you can possibly think of using our query language, GSQL, which is a fully customisable, Turing-complete query language that is very similar to SQL
- Use queries to print results back into your database – enabling a deep learning, iterative insight mechanism
- Control user access to subsets of data by setting permissions to use specific queries
Note: TigerGraph does not run NLP algorithms to extract structured data from unstructured text, but it will consume the structured outputs of any cloud NLP module that is able to run that extraction process.
Are there any limits I should be aware of?
Types of data. With TigerGraph, there are no limits to the number of types of data you want to include in the graph – whether it’s trial data, medical data, patent data, drug or patient data. All of your data types and how they relate together are mastered in the schema you can create manually within the TigerGraph Graph Studio UI. You can choose to include any new data type at any time by just updating your schema and loading the data.
Scale. TigerGraph is built for scale – and whilst it doesn’t provision cloud servers automatically (because we believe that is a cost and technical design that you should be able to control), it does distribute and partition data across your provisioned servers automatically. This means that the TigerGraph user experience feels like there is only one server – and the user is never asked to do anything more than once, like being asked to create queries or schema for every additional server.
Complexity of analytics. TigerGraph’s analytics engine is built for depth and breadth of query – meaning there is no limit to the number of data types or points you can include in a single query. We know that some of the most important insight comes from combining a significant number of data types and data points together at once – so we built the analytics engine to support you in whatever you need to ask of your data. We also recognise that native algorithms don’t always garner the details of the answer you need – and so we made our query language fully customisable – catering not just to any number of ifs, buts and whens, but also enabling you to print results back into your database as new or overlaid data to be included in future queries.
Speed. It’s important to note that where other technologies purport to be able to support the flexibility, scale and analytical power above, usually it is to the detriment of speed. This is because in effect the technology isn’t built natively to operate like that, and instead there are technical workarounds that make it possible, if given the time to run. By contrast, TigerGraph was built natively for all of the above – which means it really does deliver insight in realtime speeds – and this is of paramount importance for user experience if you’re wanting to investigate your data in an iterative research process during clinical discovery phases.
So how do I get started with TigerGraph?
You can download our free product here if you’d like to get your hands on it straight away. Or you can reach out directly to our sales team here if you’d like to see a demo, and talk about how we could run a proof of concept with you using some of your data.
———————————————————————-
References
1 McKinsey, Jan 2021, Link
2 DCAT Value Chain Insights, Jul 2020, Link
3 PM Live, Jan 2021, Link
4 DCAT Value Chain Insights, Jul 2020, Link
5 DCAT Value Chain Insights, Jul 2020, Link
6 DCAT Value Chain Insights, Jul 2020, Link
7 McKinsey, Jan 2021, Link
8 CBO, Apr 2021, Link
9 PLOSONE journal, May 2015, Link
10 PLOSONE journal, May 2015, Link
11 Semantic Web Conference Paper, May 2020, Link