


Apache Spark is a popular general-purpose cluster-computing framework. An important addition to that framework is graph technology, which is rapidly growing in popularity as it proves its value across an increasing array of use cases. GraphX is Apache Spark’s API for graphs and graph-parallel computation.
After being asked a few times to explain how GraphX compares to TigerGraph, I decided to implement a thorough evaluation of GraphX. This document presents the results of that assessment.
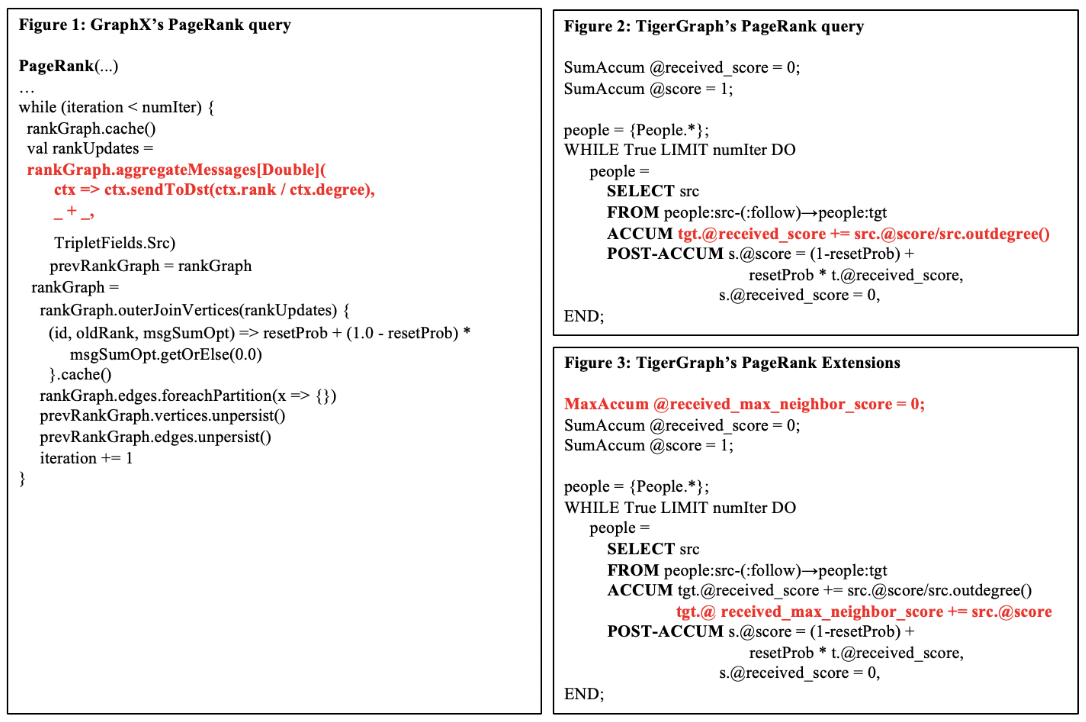 Figure 1 and 2 depicts the PageRank query written in GraphX and TigerGraph respectively. One of the core components in PageRank algorithm is to compute the rank of each vertex from its neighbors. In GraphX, you need to define messages, and how the messages flow (e.g., from source to target vertex, or vice versa), and how to combine messages (highlighted in red in Figure 1), while in TigerGraph, you can declaratively define what you want to compute (also highlighted in red in Figure 2) and TigerGraph engine automatically figures out all the implementation / optimization details underneath.
Such declarative nature makes a lot easier to write complex algorithms. For example, in Figure 3, we can easily extend the original PageRank algorithm by adding one additional metrics (highlighted in red) that computes max rank among neighbors during the same computations. In GraphX, it will be up to users to figure out how to create / optimize messages among different computations.
Figure 1 and 2 depicts the PageRank query written in GraphX and TigerGraph respectively. One of the core components in PageRank algorithm is to compute the rank of each vertex from its neighbors. In GraphX, you need to define messages, and how the messages flow (e.g., from source to target vertex, or vice versa), and how to combine messages (highlighted in red in Figure 1), while in TigerGraph, you can declaratively define what you want to compute (also highlighted in red in Figure 2) and TigerGraph engine automatically figures out all the implementation / optimization details underneath.
Such declarative nature makes a lot easier to write complex algorithms. For example, in Figure 3, we can easily extend the original PageRank algorithm by adding one additional metrics (highlighted in red) that computes max rank among neighbors during the same computations. In GraphX, it will be up to users to figure out how to create / optimize messages among different computations.
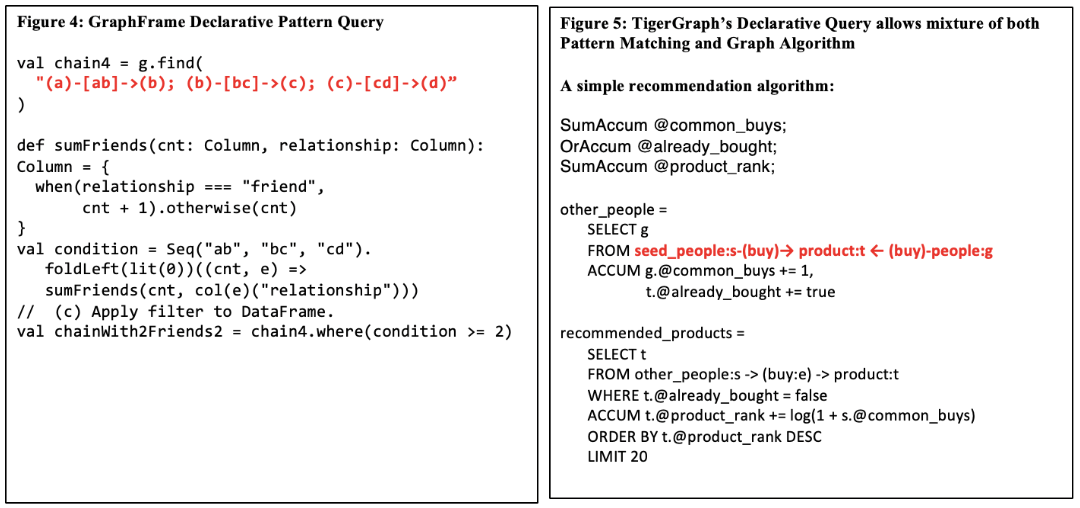 Besides graph algorithms, the other important aspect of graph analysis is pattern matching. GraphX’s sister project GraphFrame allows declarative pattern queries, and is a powerful enhancement when used in conjunction with GraphX. One example query is depicted in Figure 4.
In GSQL, user can write declarative queries that allow a mixture of both graph algorithms and pattern matching. Figure 5 depicts a simple recommendation algorithm. The statement highlighted in red in the figure is a pattern query that finds the users that bought the same products as the seed user. The rest of the query is an algorithm that further computes the ranked products from those users.
In summary, while both GraphX/GraphFrame and GSQL provide powerful graph analytics capabilities, it is easier to write complex algorithms using GSQL in general due to its declarative nature.
3. Supported workloads
We evaluated GraphX in three areas to assess supported workloads: running a large query on a large dataset, real-time transactional updates such as inserting, updating and deleting vertices and/or edges, and support sub-second queries at high QPS (queries per second).
Besides graph algorithms, the other important aspect of graph analysis is pattern matching. GraphX’s sister project GraphFrame allows declarative pattern queries, and is a powerful enhancement when used in conjunction with GraphX. One example query is depicted in Figure 4.
In GSQL, user can write declarative queries that allow a mixture of both graph algorithms and pattern matching. Figure 5 depicts a simple recommendation algorithm. The statement highlighted in red in the figure is a pattern query that finds the users that bought the same products as the seed user. The rest of the query is an algorithm that further computes the ranked products from those users.
In summary, while both GraphX/GraphFrame and GSQL provide powerful graph analytics capabilities, it is easier to write complex algorithms using GSQL in general due to its declarative nature.
3. Supported workloads
We evaluated GraphX in three areas to assess supported workloads: running a large query on a large dataset, real-time transactional updates such as inserting, updating and deleting vertices and/or edges, and support sub-second queries at high QPS (queries per second).
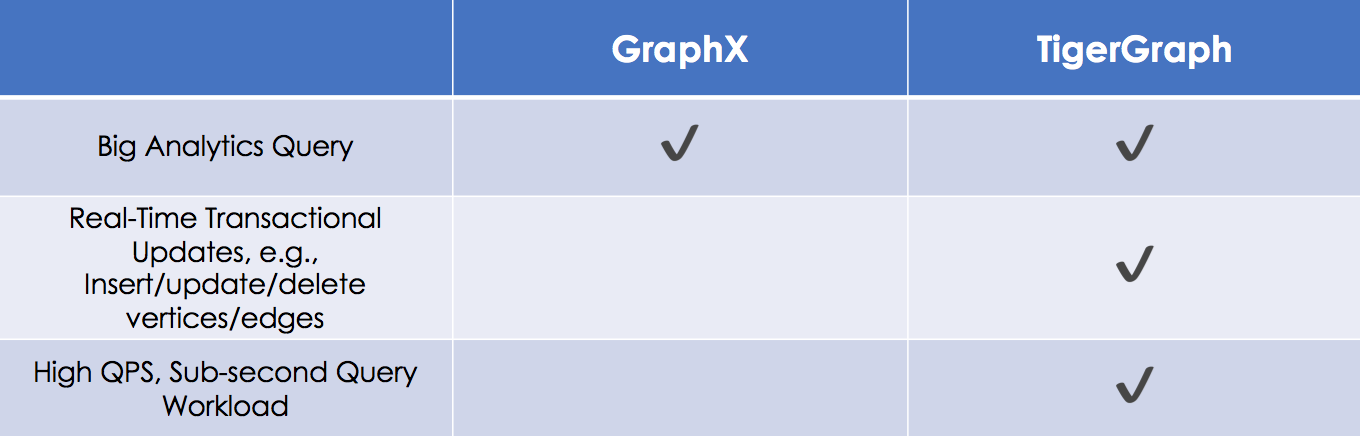
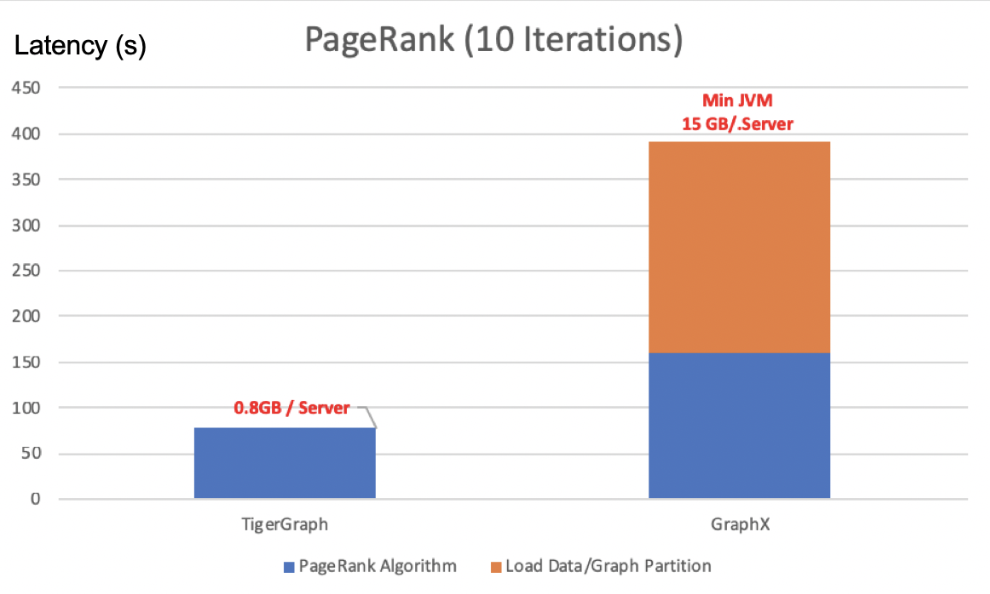
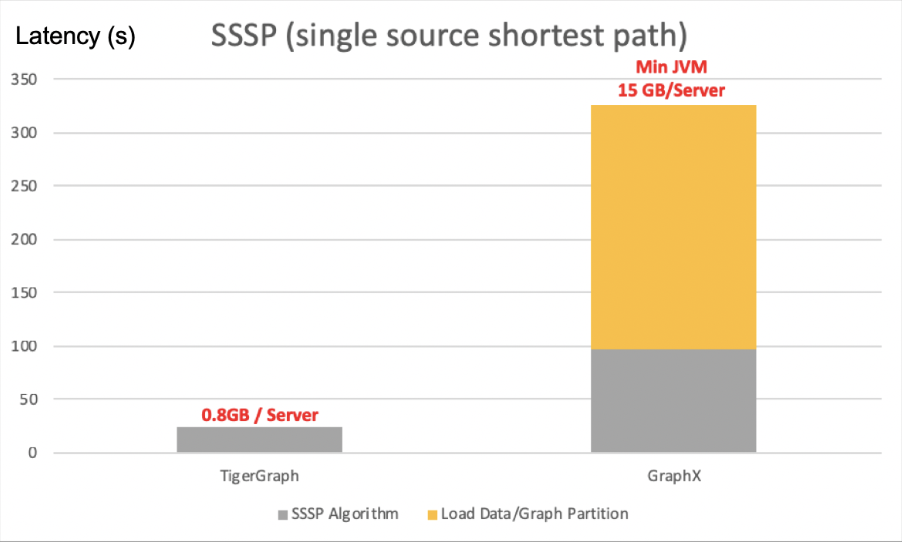 Figure 8 depicts the performance results on SSSP (single source shortest path) algorithm, where similar observations can be made.
So here is a summary of our comparison of GraphX and TigerGraph:
– GraphX’s strength is quick-to-result exploratory analysis that doesn’t require preloading the graph data.
– TigerGraph’s strengths are high performance graph analytics, real time transactional updates and supporting high QPS sub-second query workloads.
Figure 8 depicts the performance results on SSSP (single source shortest path) algorithm, where similar observations can be made.
So here is a summary of our comparison of GraphX and TigerGraph:
– GraphX’s strength is quick-to-result exploratory analysis that doesn’t require preloading the graph data.
– TigerGraph’s strengths are high performance graph analytics, real time transactional updates and supporting high QPS sub-second query workloads.
Comparing GraphX and TigerGraph
GraphX, for those of you who may be unfamiliar with it, is a graph-processing framework that sits atop Apache Spark. In particular, it provides a Pregel API for implementing complex graph algorithms. Like Apache Spark, GraphX began as a research project at UC Berkeley’s AMPLab and Databricks, and was later donated to the Apache Software Foundation and the Spark project. We looked at four areas in our comparison of GraphX and TigerGraph, and I’ll review our findings here: 1. Graph data storage All data that is analyzed by GraphX are stored elsewhere and loaded on the fly for query. In comparison, TigerGraph manages an optimized graph data store where data can be preloaded by some ETL process and/or updated by real-time transactions. This is an important difference and means that, for analysis where data is to be loaded once and is static, GraphX is a better option (minimal initial cost; good for initial exploratory analysis) while, for analysis where data is loaded many times and may be dynamic, TigerGraph is a better option (some initial cost; good for repeated analysis). 2. Query expressiveness We used the well-known PageRank algorithm as the basis for comparing the expressiveness of GraphX queries and GSQL queries (GSQL is TigerGraph’s SQL-procedure like query language).
Figure 1 and 2 depicts the PageRank query written in GraphX and TigerGraph respectively. One of the core components in PageRank algorithm is to compute the rank of each vertex from its neighbors. In GraphX, you need to define messages, and how the messages flow (e.g., from source to target vertex, or vice versa), and how to combine messages (highlighted in red in Figure 1), while in TigerGraph, you can declaratively define what you want to compute (also highlighted in red in Figure 2) and TigerGraph engine automatically figures out all the implementation / optimization details underneath.
Such declarative nature makes a lot easier to write complex algorithms. For example, in Figure 3, we can easily extend the original PageRank algorithm by adding one additional metrics (highlighted in red) that computes max rank among neighbors during the same computations. In GraphX, it will be up to users to figure out how to create / optimize messages among different computations.
Besides graph algorithms, the other important aspect of graph analysis is pattern matching. GraphX’s sister project GraphFrame allows declarative pattern queries, and is a powerful enhancement when used in conjunction with GraphX. One example query is depicted in Figure 4.
In GSQL, user can write declarative queries that allow a mixture of both graph algorithms and pattern matching. Figure 5 depicts a simple recommendation algorithm. The statement highlighted in red in the figure is a pattern query that finds the users that bought the same products as the seed user. The rest of the query is an algorithm that further computes the ranked products from those users.
In summary, while both GraphX/GraphFrame and GSQL provide powerful graph analytics capabilities, it is easier to write complex algorithms using GSQL in general due to its declarative nature.
3. Supported workloads
We evaluated GraphX in three areas to assess supported workloads: running a large query on a large dataset, real-time transactional updates such as inserting, updating and deleting vertices and/or edges, and support sub-second queries at high QPS (queries per second).
Figure 6: Comparison of query workloads supported on GraphX and TigerGraph
In general, as Figure 6 shows, GraphX is designed for supporting OLAP workloads while TigerGraph supports hybrid transactional/analytical processing (HTAP). 4. Scalability and performance Both GraphX and TigerGraph are horizontally scalable to handle very large data sets. In this section, we compare their performance on two popular graph algorithms, namely, PageRank and Single Source Shortest Path. We used EdgePartition2D partition scheme for GraphX, which is the best partition strategy for these algorithms. The datasets we used is the popular Twitter dataset consisting of 41M vertices and 1.4B edges. Both GraphX and TigerGraph are running on 16 r5.2xlarge servers (8 cores, 64GB memory) on AWS.
Figure 7: Performance comparison of TigerGraph and GraphX on PageRank
Figure 7 depicts the performance of GraphX and TigerGraph on PageRank algorithm. I’d like to make three observations here: – The data loading and graph partition cost is non-trivial for GraphX. So if repeated analysis is necessary, it will be better to preload the data to a graph database such as TigerGraph. – GraphX requires quite a lot of memory to run compared to TigerGraph (15GB per server vs 0.8GB per server). – In terms of the algorithm execution time itself, TigerGraph is about twice as fast as GraphX.
Figure 8 depicts the performance results on SSSP (single source shortest path) algorithm, where similar observations can be made.
So here is a summary of our comparison of GraphX and TigerGraph:
– GraphX’s strength is quick-to-result exploratory analysis that doesn’t require preloading the graph data.
– TigerGraph’s strengths are high performance graph analytics, real time transactional updates and supporting high QPS sub-second query workloads.


