Skip to content
START FOR FREE
START FOR FREE
  • SUPPORT
  • COMMUNITY
Menu
  • SUPPORT
  • COMMUNITY
MENUMENU
  • Products
    • The World’s Fastest and Most Scalable Graph Platform

      LEARN MORE

      Watch a TigerGraph Demo

      TIGERGRAPH CLOUD

      • Overview
      • TigerGraph Cloud Suite
      • FAQ
      • Pricing

      USER TOOLS

      • GraphStudio
      • Insights
      • Application Workbenches
      • Connectors and Drivers
      • Starter Kits
      • openCypher Support

      TIGERGRAPH DB

      • Overview
      • GSQL Query Language
      • Compare Editions

      GRAPH DATA SCIENCE

      • Graph Data Science Library
      • Machine Learning Workbench
  • Solutions
    • The World’s Fastest and Most Scalable Graph Platform

      LEARN MORE

      Watch a TigerGraph Demo

      Solutions

      • Solutions Overview

      INCREASE REVENUE

      • Customer Journey/360
      • Product Marketing
      • Entity Resolution
      • Recommendation Engine

      MANAGE RISK

      • Fraud Detection
      • Anti-Money Laundering
      • Threat Detection
      • Risk Monitoring

      IMPROVE OPERATIONS

      • Supply Chain Analysis
      • Energy Management
      • Network Optimization

      By Industry

      • Advertising, Media & Entertainment
      • Financial Services
      • Healthcare & Life Sciences

      FOUNDATIONAL

      • AI & Machine Learning
      • Time Series Analysis
      • Geospatial Analysis
  • Customers
    • The World’s Fastest and Most Scalable Graph Platform

      LEARN MORE

      CUSTOMER SUCCESS STORIES

      • Ford
      • Intuit
      • JPMorgan Chase
      • READ MORE SUCCESS STORIES
      • Jaguar Land Rover
      • United Health Group
      • Xbox
  • Partners
    • The World’s Fastest and Most Scalable Graph Platform

      LEARN MORE

      PARTNER PROGRAM

      • Partner Benefits
      • TigerGraph Partners
      • Sign Up
      TigerGraph partners with organizations that offer complementary technology solutions and services.​
  • Resources
    • The World’s Fastest and Most Scalable Graph Platform

      LEARN MORE

      BLOG

      • TigerGraph Blog

      RESOURCES

      • Resource Library
      • Benchmarks
      • Demos
      • O'Reilly Graph + ML Book

      EVENTS & WEBINARS

      • Graph+AI Summit
      • Graph for All - Million Dollar Challenge
      • Events &Trade Shows
      • Webinars

      DEVELOPERS

      • Documentation
      • Ecosystem
      • Developers Hub
      • Community Forum

      SUPPORT

      • Contact Support
      • Production Guidelines

      EDUCATION

      • Training & Certifications
  • Company
    • Join the World’s Fastest and Most Scalable Graph Platform

      WE ARE HIRING

      COMPANY

      • Company Overview
      • Leadership
      • Legal Terms
      • Patents
      • Security and Compliance

      CAREERS

      • Join Us
      • Open Positions

      AWARDS

      • Awards and Recognition
      • Leader in Forrester Wave
      • Gartner Research

      PRESS RELEASE

      • Read All Press Releases
      TigerGraph Recognized in 2022 Gartner® Critical Capabilities for Cloud Database Management Systems for Analytical Use Cases
      January 12, 2023
      Read More »

      NEWS

      • Read All News

      A Shock to the System: ShockNet Predicts How Economic Shocks Could Affect the World Economy

      TigerGraph Recognized for the First Time in the 2022 Gartner® Magic Quadrant™ for Cloud Database Management Systems

  • START FREE
    • The World’s Fastest and Most Scalable Graph Platform

      GET STARTED

      • Request a Demo
      • CONTACT US
      • Try TigerGraph
      • START FREE
      • TRY AN ONLINE DEMO

Customer 360 for the Banking Industry

  • TigerGraph
  • February 28, 2022
  • blog, Community, Customer, Finance
  • Blog >
  • Customer 360 for the Banking Industry

This is an abbreviated version of a presentation by Deepak Juneja, Vice President – Head of Global Data Management at Capgemini, and Alok Benjwal, Vice President at Capgemini, during the Fall 2021 Graph + AI Fall Summit conference.

Watch the full session from Graph + AI Summit Fall

Better Banking and Insurance Experiences

In today’s session, we’ll talk about how customer 360 is enabling the banking and insurance industries to provide better client experiences and lifelong engagement. We’ve been working with multiple clients in investment banking and property and casualty insurance, and we’ll share some of the trends we’re seeing with them.

So, let’s introduce ourselves before getting started on this interesting topic: 

  • I’m Deepak Juneja, responsible for data management and data fabric capability for Capgemini, Financial Services Globally, where we work with the clients to help with the solution definition, operationalize and implement it. Alok has joined me today to cover this session.
  • I’m Alok Bejwal, Vice President of Banking Analytics here at Capgemini. I have 20 plus years of experience, working with major FIS like Citi, JP Morgan Chase, Lincoln Financial, and across my career, I’ve seen customer 360 growing. It is a very important subject within the banks, and I think it also augments customer experience. I’m really looking forward to the discussion. Back to you, Deepak.

Before we start diving into how we have seen customer 360 providing value and how our clients have been leveraging them, let’s start with some of the key drivers. As we have seen in the last few years, customer interaction through the digital channel has tremendously increased, driven also by the pandemic.

Customer 360 Recap Figure 1

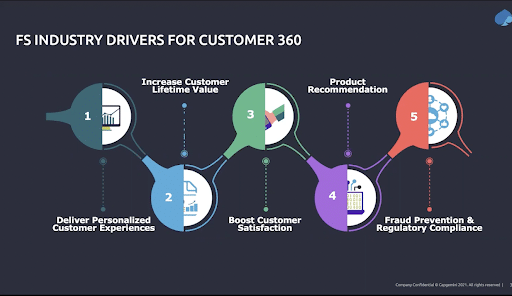
Figure 1: Financial services industry drivers for customer 360

All these increased interactions are driving the need for all our banking and insurance clients to deliver a more personalized customer experience, which means we should be able to offer them the right experience and help them better improve their relationship with their clients. That’s why boosting customer satisfaction becomes a very key driver. It’s also important to identify the right product they should recommend at the right time and when there is a need for that product. 

This will actually drive an overall increase in customer lifetime value because, at the end of the day, it’s not about just selling services, but making sure there’s a value that clients are achieving through the product they’re offered. The banking and insurance industry needs to make sure they’re complying with regulations. They need to make sure when they are onboarding new products or having interaction and activities, they make sure they have good control on checking the fraud, interaction, or any of the required activities. 

Next, we have been working with the client, providing them operational capability around master data management for the customer. Now, the demand is moving from operational activities to more analytical, where they can get better insights about the customer, their desires, their demands, and their requirements. 

Customer 360 Recap Figure 2

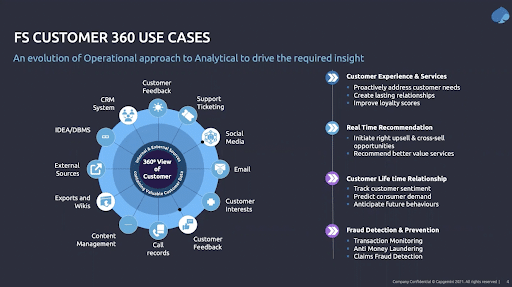
Figure 2: Financial services customer 360 use cases

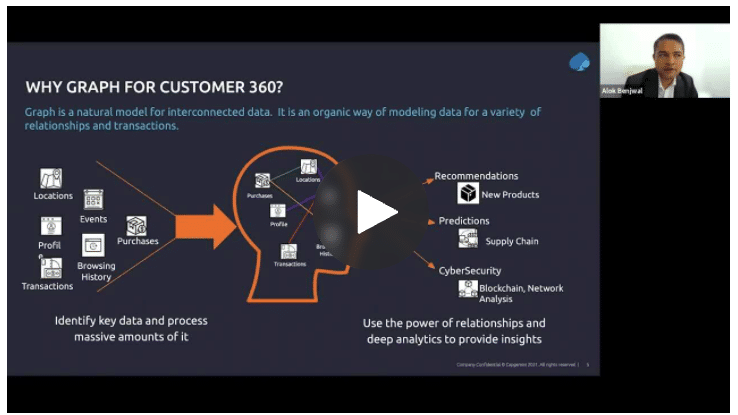
Bringing Customer Info Together with Customer 360

Customer 360 brings together all the relevant information about a customer, whether internal within the organization or external. You can detect what their desires are, what are their future lifetime events, how they can use the services the best, what could be the new services we should offer, or bring in some refined and revised personalized offers for them. 

We want to make sure we’re providing real-time recommendations on the product and services they are looking for. It’s always easy to upsell and cross-sell new products and services compared to bringing in a new client. It becomes critical to provide use cases and support the use cases regarding transaction monitoring, anti-money laundering, and also in the insurance industry, about the claims and fraud detection. These are some of the key use cases which we are seeing for financial services clients and it continues to grow, and we are looking for graph as a technology to help support some of those because of the value it can bring. 

I think if we take it back to the graph discussion, this becomes a huge data problem because what we’re talking about here is data coming at a speed, which could be in real-time or near real-time. It could be data coming from different aspects of the customer lifecycle, all the way from marketing, to customer onboarding, to even you know, lifecycle management and spend. When you bring all this data together in one place, just to query that data and get meaningful insights out of it, it becomes a huge task. I think something like graph databases can really augment some of the use cases that we see.                                                 

The financial service industry is very regulated. You need to make sure the data is accurate, and we’re talking about trying to build this concept, which has really formalized over the years, the concept of data as a shared asset. Data does not belong to marketing, or to finance, or to operations — it’s the same data that is shared across functions, and then it’s the data about the same individual or the customer. The data doesn’t really need to be just accurate, it needs to be the same version of truth, across functions across touchpoints, and the customer should feel that they are being recognized when they go from one touchpoint to another across channels, or across functional touchpoints.

Oftentimes you think, apply the 80/20 rule: 20% of your data gets you 80% of the insight so that’s why you have the querying capability. Being able to traverse through this complex data ecosystem becomes very important. Things like a graph database are definitely going to help with that in separating that signal from the noise. And last, but not least, we are in the financial services industry and everything needs to be compliant. There are so many privacy laws that have come up in the last, three or four years.

Customer 360 Recap Figure 3

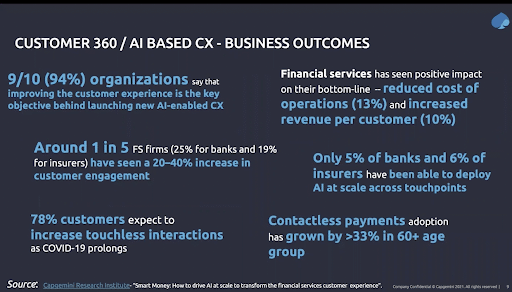
Figure 3: Customer 360 / AI-based CX-business outcomes

Customer 360 and AI-based customer experience are becoming increasingly important in the banking and the financial services space. Over the last two to five years, companies have come to realize that if they really want to compete, they cannot be just one product and pricing. There has to be customer experience, stickiness, engagement, and all those good things that we’ve talked about in this session.

So, to conclude, all the banking and insurance clients see their key business priority is to provide clients as a first experience and give them a full comprehensive experience across all channels. What we see working with some of the key clients, which we are engaged with today, and we have helped them implement some of the customer 360 using graph technology and more as the overall paradigm, has helped them to achieve their goals faster, quicker, and more comprehensively. 

We see this being your value all our clients can leverage, and take that to the next level of the digital transformation journey, and supporting client-first thinking. Thanks for joining us today. We had a good time covering some of the key points and look forward to future interaction on this topic.

Spring 2022 Graph + AI Summit

The Spring 2022 Graph + AI Summit is right around the corner! This global virtual conference will bring together our community to advance graph analytics, artificial intelligence, and machine learning knowledge.

Conference details and registration information will be available here soon.

You Might Also Like

TigerGraph Showcases Unrivaled Performance at Scale

TigerGraph Showcases Unrivaled Performance at Scale

January 12, 2023
How to Create a Visual Graph Analytics Application Using TigerGraph Insights in 30 mins

How to Create a Visual Graph...

November 14, 2022
Turbocharge your business intelligence with TigerGraph’s ML Workbench on TigerGraph Cloud

Turbocharge your business intelligence with TigerGraph’s...

November 14, 2022

Introducing TigerGraph 3.0

July 1, 2020

Everything to Know to Pass your TigerGraph Certification Test

June 24, 2020

Neo4j 4.0 Fabric – A Look Behind the Curtain

February 7, 2020

TigerGraph Blog

  • Categories
    • blogs
      • About TigerGraph
      • Benchmark
      • Business
      • Community
      • Compliance
      • Customer
      • Customer 360
      • Cybersecurity
      • Developers
      • Digital Twin
      • eCommerce
      • Emerging Use Cases
      • Entity Resolution
      • Finance
      • Fraud / Anti-Money Laundering
      • GQL
      • Graph Database Market
      • Graph Databases
      • GSQL
      • Healthcare
      • Machine Learning / AI
      • Podcast
      • Supply Chain
      • TigerGraph
      • TigerGraph Cloud
    • Graph AI On Demand
      • Analysts and Research
      • Customer 360 and Entity Resolution
      • Customer Spotlight
      • Development
      • Finance, Banking, Insurance
      • Keynote
      • Session
    • Video
  • Recent Posts

    • It’s Time to Harness the Power of Graph Technology [Infographic]
    • TigerGraph Showcases Unrivaled Performance at Scale
    • TigerGraph 101 An Introduction to Graph | Jan 26th @ 9am PST
    • Data Science Salon New York
    • Tech For Retail
    TigerGraph

    Product

    SOLUTIONS

    customers

    RESOURCES

    start for free

    TIGERGRAPH DB
    • Overview
    • Features
    • GSQL Query Language
    GRAPH DATA SCIENCE
    • Graph Data Science Library
    • Machine Learning Workbench
    TIGERGRAPH CLOUD
    • Overview
    • Cloud Starter Kits
    • Login
    • FAQ
    • Pricing
    • Cloud Marketplaces
    USEr TOOLS
    • GraphStudio
    • TigerGraph Insights
    • Application Workbenches
    • Connectors and Drivers
    • Starter Kits
    • openCypher Support
    SOLUTIONS
    • Why Graph?
    industry
    • Advertising, Media & Entertainment
    • Financial Services
    • Healthcare & Life Sciences
    use cases
    • Benefits
    • Product & Service Marketing
    • Entity Resolution
    • Customer 360/MDM
    • Recommendation Engine
    • Anti-Money Laundering
    • Cybersecurity Threat Detection
    • Fraud Detection
    • Risk Assessment & Monitoring
    • Energy Management
    • Network & IT Management
    • Supply Chain Analysis
    • AI & Machine Learning
    • Geospatial Analysis
    • Time Series Analysis
    success stories
    • Customer Success Stories

    Partners

    Partner program
    • Partner Benefits
    • TigerGraph Partners
    • Sign Up
    LIBRARY
    • Resources
    • Benchmark
    • Webinars
    Events
    • Trade Shows
    • Graph + AI Summit
    • Million Dollar Challenge
    EDUCATION
    • Training & Certifications
    Blog
    • TigerGraph Blog
    DEVELOPERS
    • Developers Hub
    • Community Forum
    • Documentation
    • Ecosystem

    COMPANY

    Company
    • Overview
    • Careers
    • News
    • Press Release
    • Awards
    • Legal
    • Patents
    • Security and Compliance
    • Contact
    Get Started
    • Start Free
    • Compare Editions
    • Online Demo - Test Drive
    • Request a Demo

    Product

    • Overview
    • TigerGraph 3.0
    • TIGERGRAPH DB
    • TIGERGRAPH CLOUD
    • GRAPHSTUDIO
    • TRY NOW

    customers

    • success stories

    RESOURCES

    • LIBRARY
    • Events
    • EDUCATION
    • BLOG
    • DEVELOPERS

    SOLUTIONS

    • SOLUTIONS
    • use cases
    • industry

    Partners

    • partner program

    company

    • Overview
    • news
    • Press Release
    • Awards

    start for free

    • Request Demo
    • take a test drive
    • SUPPORT
    • COMMUNITY
    • CONTACT
    • Copyright © 2023 TigerGraph
    • Privacy Policy
    • Linkedin
    • Facebook
    • Twitter

    Copyright © 2020 TigerGraph | Privacy Policy

    Copyright © 2020 TigerGraph Privacy Policy

    • SUPPORT
    • COMMUNITY
    • COMPANY
    • CONTACT
    • Linkedin
    • Facebook
    • Twitter

    Copyright © 2020 TigerGraph

    Privacy Policy

    • Products
    • Solutions
    • Customers
    • Partners
    • Resources
    • Company
    • START FREE
    START FOR FREE
    START FOR FREE
    TigerGraph
    PRODUCT
    PRODUCT
    • Overview
    • GraphStudio UI
    • Graph Data Science Library
    TIGERGRAPH DB
    • Overview
    • Features
    • GSQL Query Language
    TIGERGRAPH CLOUD
    • Overview
    • Cloud Starter Kits
    TRY TIGERGRAPH
    • Get Started for Free
    • Compare Editions
    SOLUTIONS
    SOLUTIONS
    • Why Graph?
    use cases
    • Benefits
    • Product & Service Marketing
    • Entity Resolution
    • Customer Journey/360
    • Recommendation Engine
    • Anti-Money Laundering (AML)
    • Cybersecurity Threat Detection
    • Fraud Detection
    • Risk Assessment & Monitoring
    • Energy Management
    • Network Resources Optimization
    • Supply Chain Analysis
    • AI & Machine Learning
    • Geospatial Analysis
    • Time Series Analysis
    industry
    • Advertising, Media & Entertainment
    • Financial Services
    • Healthcare & Life Sciences
    CUSTOMERS
    read all success stories


    PARTNERS
    Partner program
    • Partner Benefits
    • TigerGraph Partners
    • Sign Up
    RESOURCES
    LIBRARY
    • Resource Library
    • Benchmark
    • Webinars
    Events
    • Trade Shows
    • Graph + AI Summit
    • Graph for All - Million Dollar Challenge
    EDUCATION
    • TigerGraph Academy
    • Certification
    Blog
    • TigerGraph Blog
    DEVELOPERS
    • Developers Hub
    • Community Forum
    • Documentation
    • Ecosystem
    COMPANY
    COMPANY
    • Overview
    • Leadership
    • Careers  
    NEWS
    PRESS RELEASE
    AWARDS
    START FREE
    Start Free
    • Request a Demo
    • SUPPORT
    • COMMUNITY
    • CONTACT
    Dr. Jay Yu

    Dr. Jay Yu | VP of Product and Innovation

    Dr. Jay Yu is the VP of Product and Innovation at TigerGraph, responsible for driving product strategy and roadmap, as well as fostering innovation in graph database engine and graph solutions. He is a proven hands-on full-stack innovator, strategic thinker, leader, and evangelist for new technology and product, with 25+ years of industry experience ranging from highly scalable distributed database engine company (Teradata), B2B e-commerce services startup, to consumer-facing financial applications company (Intuit). He received his PhD from the University of Wisconsin - Madison, where he specialized in large scale parallel database systems

    Todd Blaschka | COO

    Todd Blaschka is a veteran in the enterprise software industry. He is passionate about creating entirely new segments in data, analytics and AI, with the distinction of establishing graph analytics as a Gartner Top 10 Data & Analytics trend two years in a row. By fervently focusing on critical industry and customer challenges, the companies under Todd's leadership have delivered significant quantifiable results to the largest brands in the world through channel and solution sales approach. Prior to TigerGraph, Todd led go to market and customer experience functions at Clustrix (acquired by MariaDB), Dataguise and IBM.