This blog is a reprint of an article published by the author on Medium.com on March 15, 2022.
Do you know how to construct a biomedical knowledge graph using TigerGraph and BERN2? Let’s learn together!
Why representing biomedical data as a semantic knowledge graph is value-adding?
One can imagine biomedical data as an interconnected network of biomedical entities like diseases, drugs, genes, proteins, etc. Representing biomedical data as a knowledge graph has the following advantages:
- Biomedical data is dynamic, not fully integrated, and requires a flexible schema to represent the entities and interactions. A graph-based data model is more flexible for dynamic data integration and handling evolving schema.
- An enormous collection of biomedical ontologies and vocabularies are available online, which model the concepts of a biomedical domain. The amount of biomedical data in research works and papers are exploding. But, there are significantly fewer ways of integrating and connecting related information from different sources to gain valuable medical insights. So, representing biomedical data as a semantic knowledge graph will provide an integrated source to perform complex queries faster with appropriate reasoning.
- A graph database like TigerGraph can unleash the power of biomedical data by representing them as distributed semantic knowledge graphs and applying real-time machine learning to solve problems in the biomedical domain.
- A biomedical knowledge graph implemented as a distributed TigerGraph can perform real-time disease analytics and used to develop real-life applications like drug discovery, drug-to-drug interactions, drug side-effects, drug repurposing, genomics, and safe drug recommendations, patient diagnosis, rare disease identification.
This article will discuss how to build a biomedical knowledge graph using TigerGraph from scratch and traverse the graph with some sample gsql queries.
1. Understanding a biomedical graph
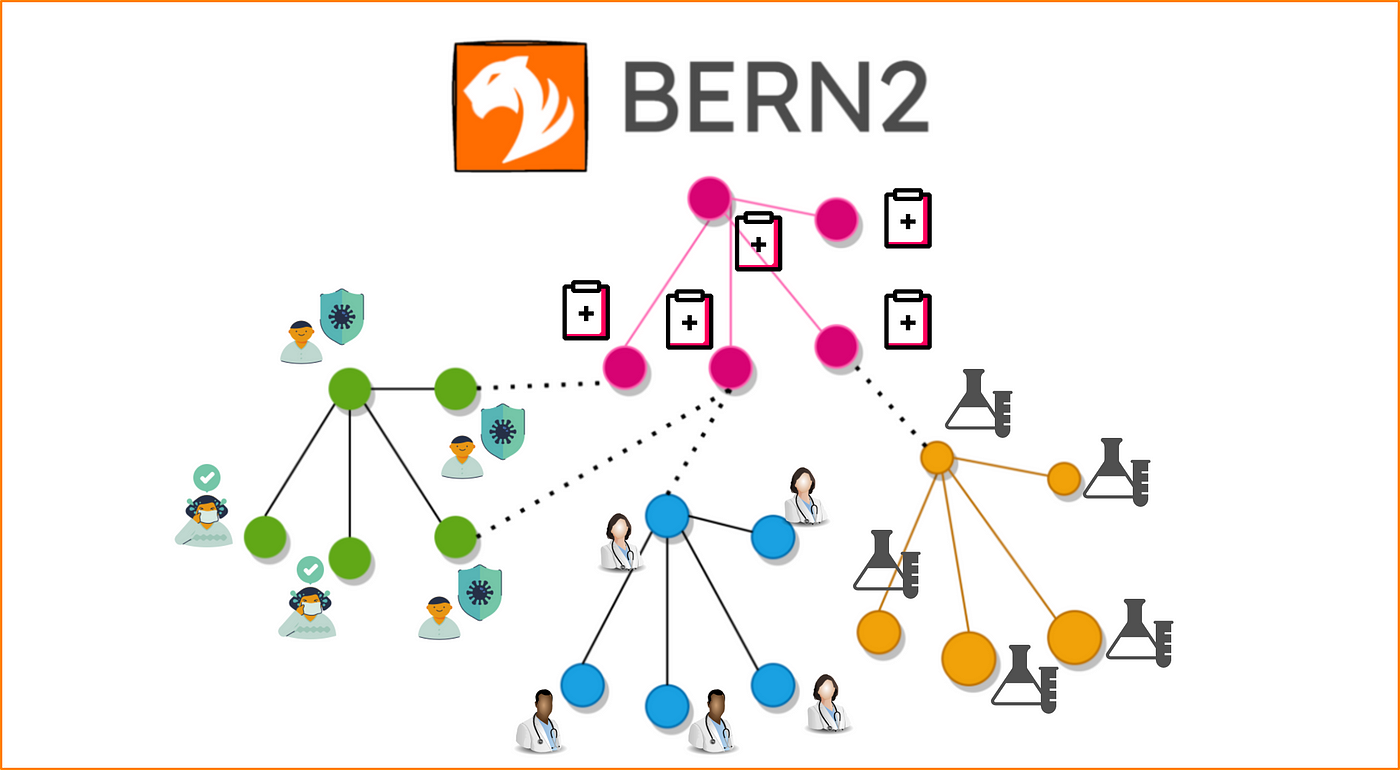
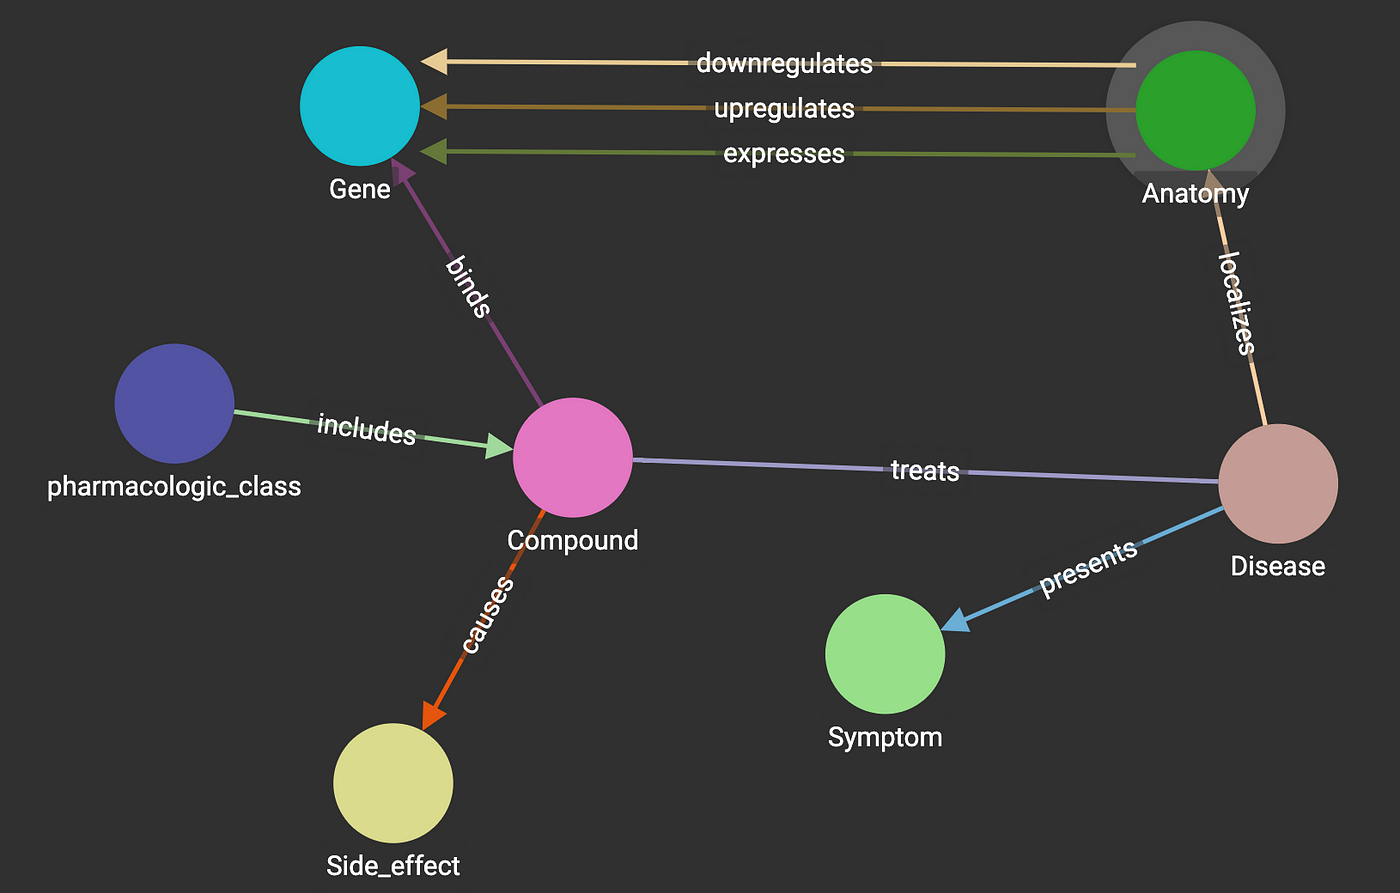
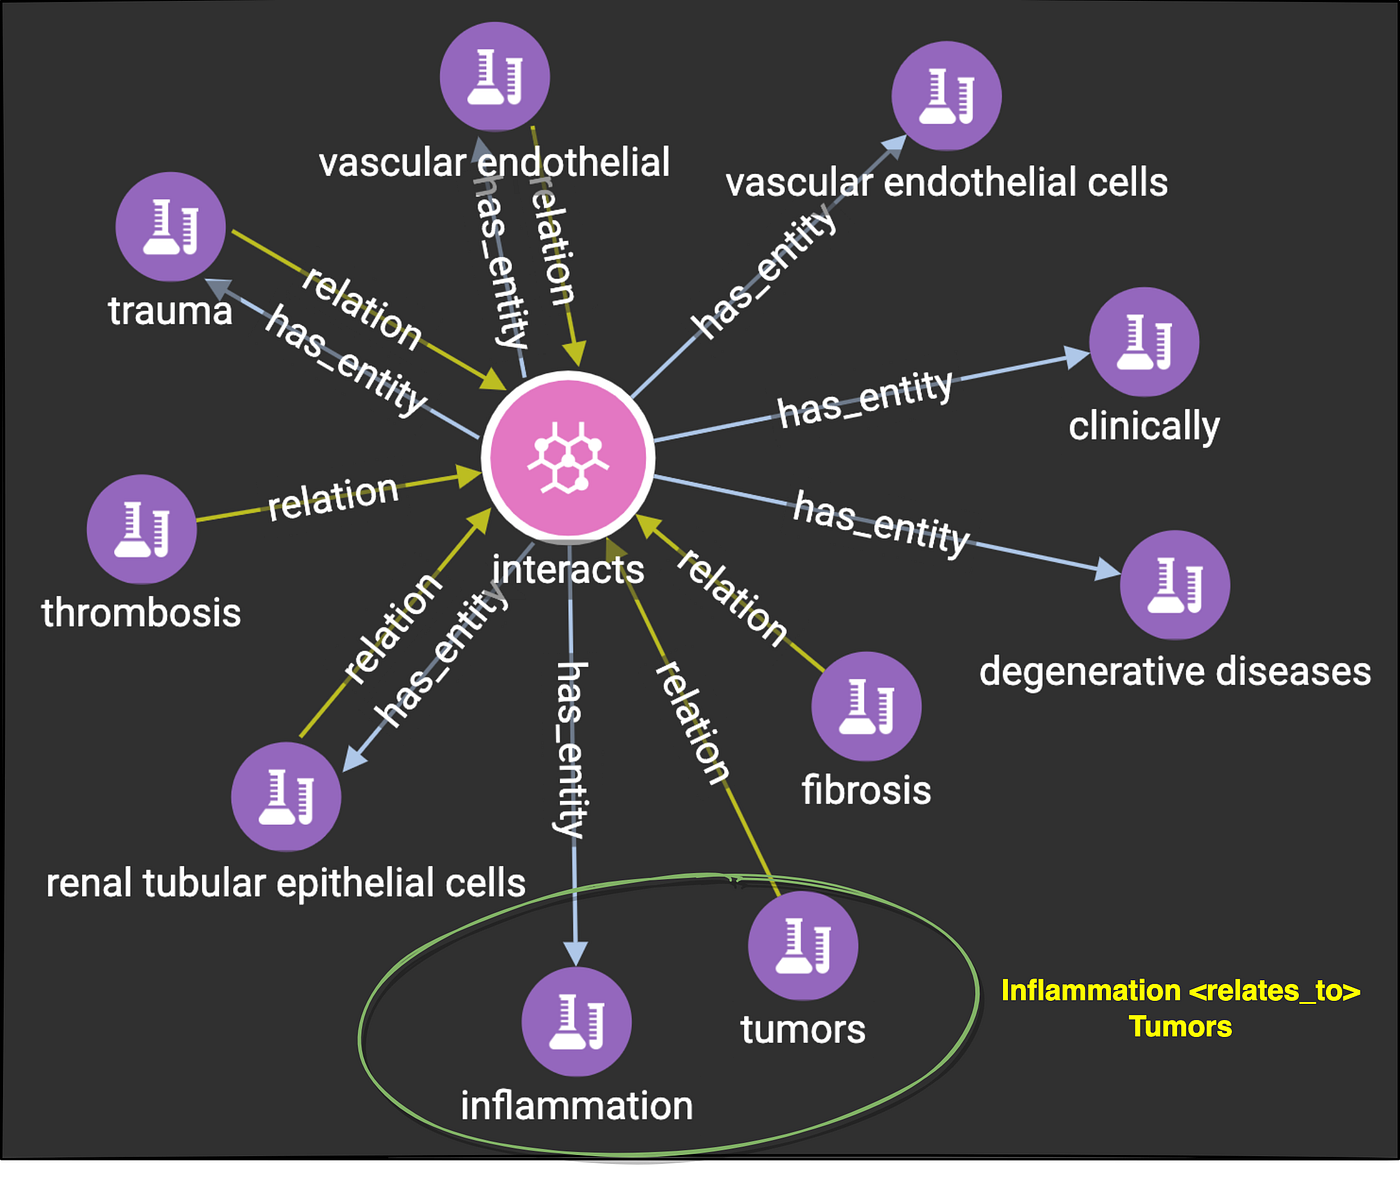
A biomedical knowledge graph is a systematic way to connect biomedical entities and can act as a critical asset to search biomedical data semantically, helping to make fast clinical decisions and also helping to drive biomedical research towards life-saving applications. The below is a simple construct of a biomedical graph.
2. Understanding BERN2
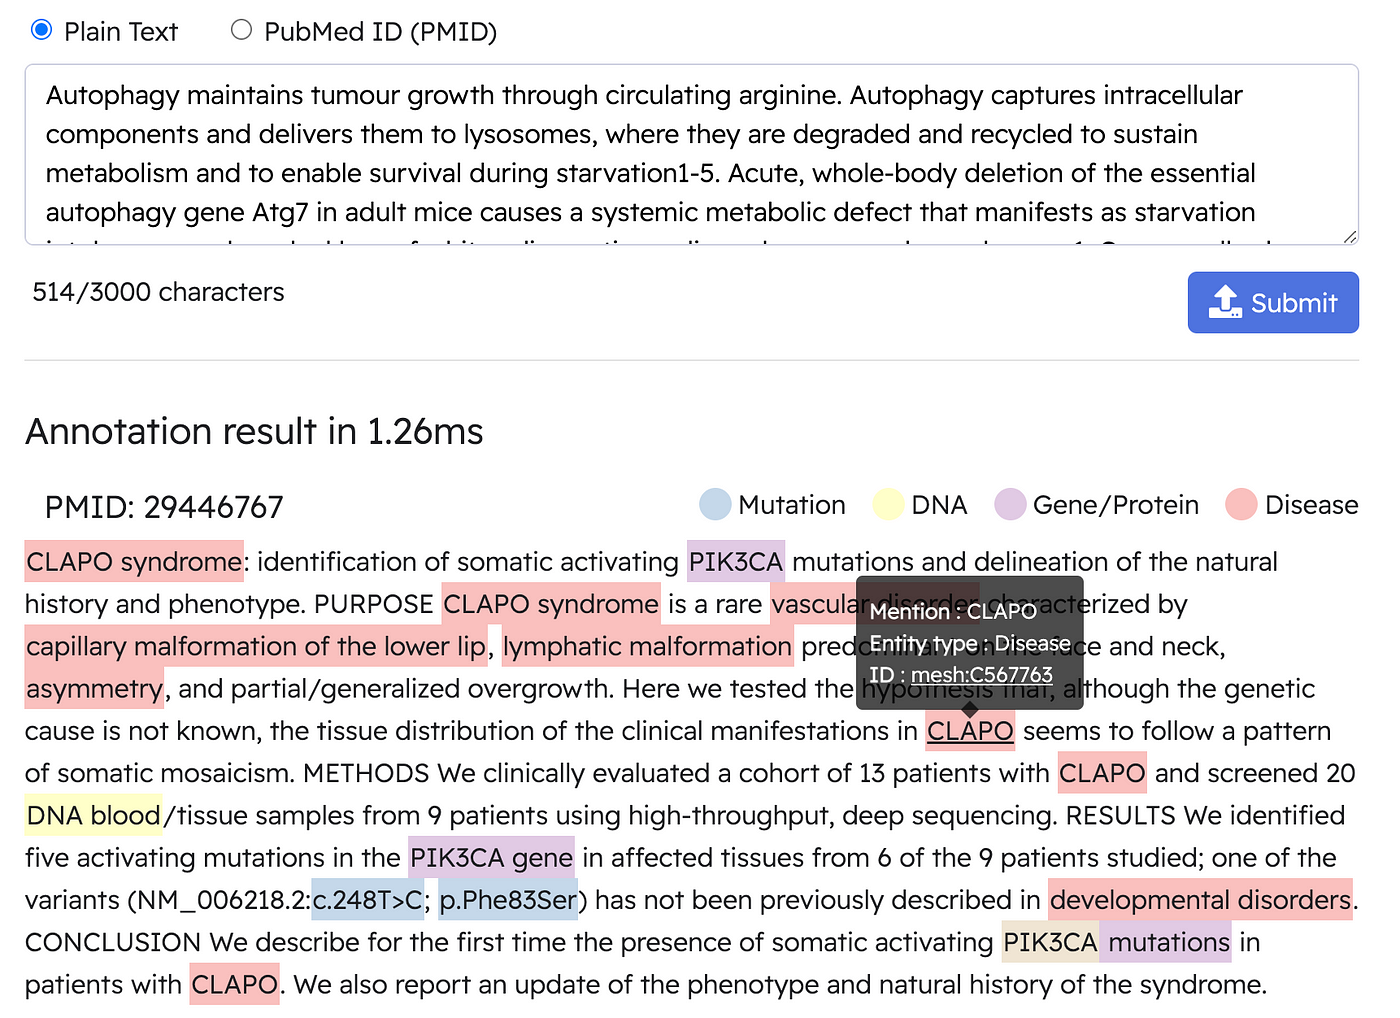
BERN2 is an ‘Advanced neural Biomedical Named Entity Recognition and Normalization Tool’ implemented by DMIS Lab at Korea University.
BERN2 can,
- Recognize nine different biomedical entity types by their normalized identifiers. Identifiers include genes, diseases, DNA, RNA, etc.
- Annotate in real-time when provided a plain text or PubMed ID.
- Provide access via RESTful API and also support stand-alone installation.
- Merge the entities derived into target knowledge bases.
The below is an example of a real-time annotation by BERN2,
Alright, now we have a basic understanding of biomedical knowledge graphs and their potential application use cases.
3. Biomedical Knowledge Graph solution using TigerGraph
4. HANDS-ON
Step-0: Create a tgcloud solution
Reference link: https://docs.tigergraph.com/cloud/solutions/create
Python Scripts
Below are the 3-steps to load biomedical data into TigerGraph using python scripts,
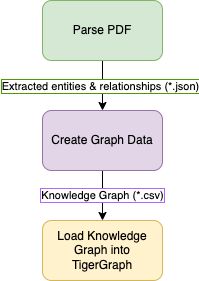
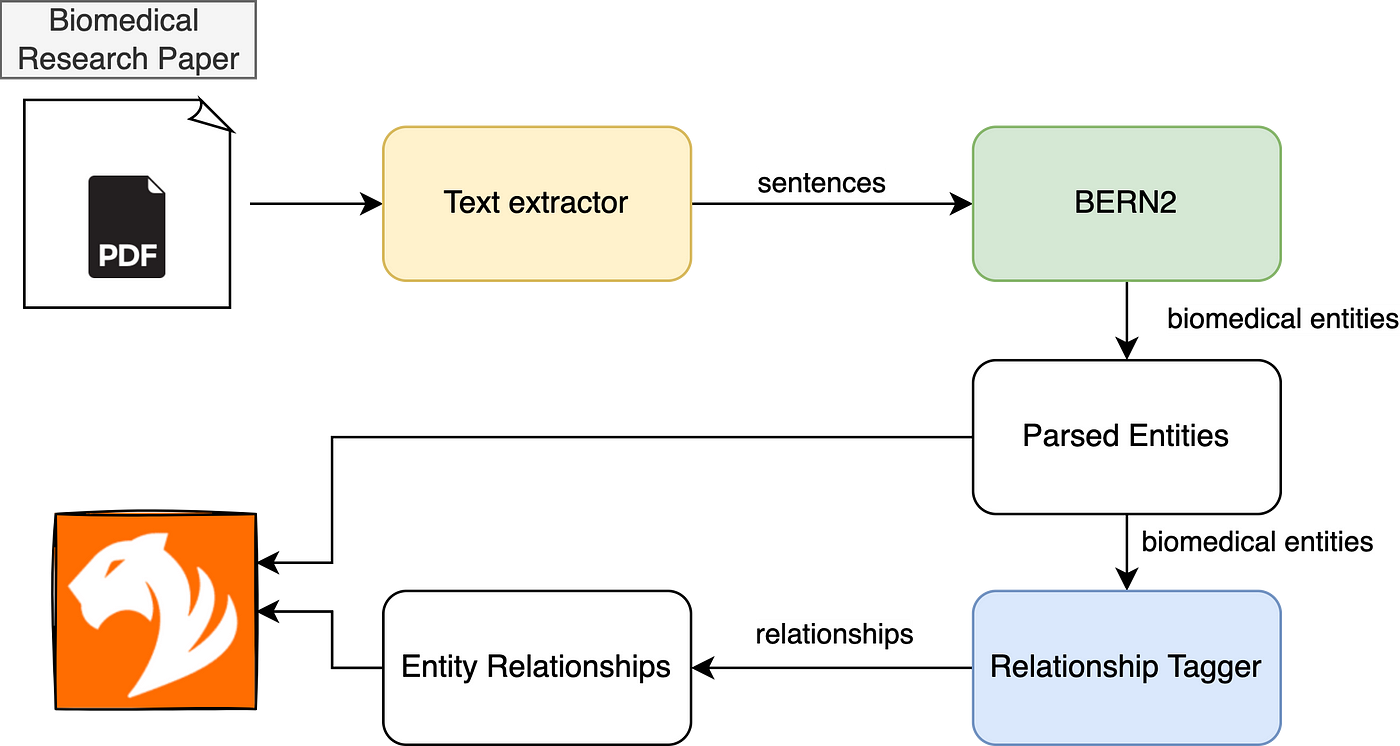
Step-1: Pulling data and entity/ relationship extraction.
The below research paper titled ‘Developmental Status and Perspectives for Tissue Engineering in Urology’ will be the biomedical data source for this project.
Download source pdf: https://arxiv.org/abs/2111.09414
Run this Google colab notebook to extract entities and relationships from the biomedical research paper.
Step-2: Data transformation
Run this Google colab notebook to convert extracted into a graph schema.
Step-3: Getting data into TigerGraph
Run this Google colab notebook to load the data into TigerGraph cloud.
After the execution of the above load script, the following graph is created with the respective data mappings as follows,
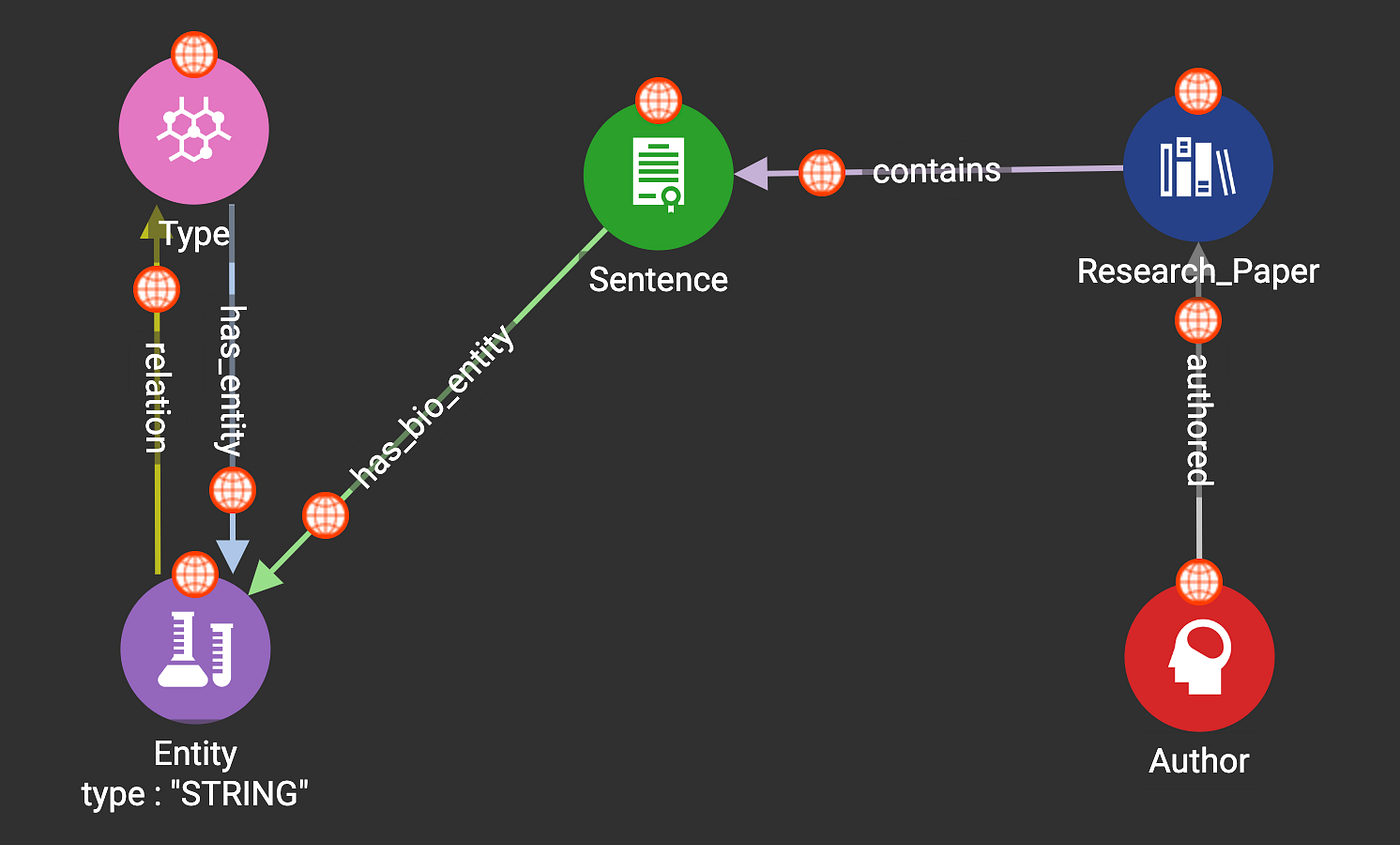
3.1 Global Schema
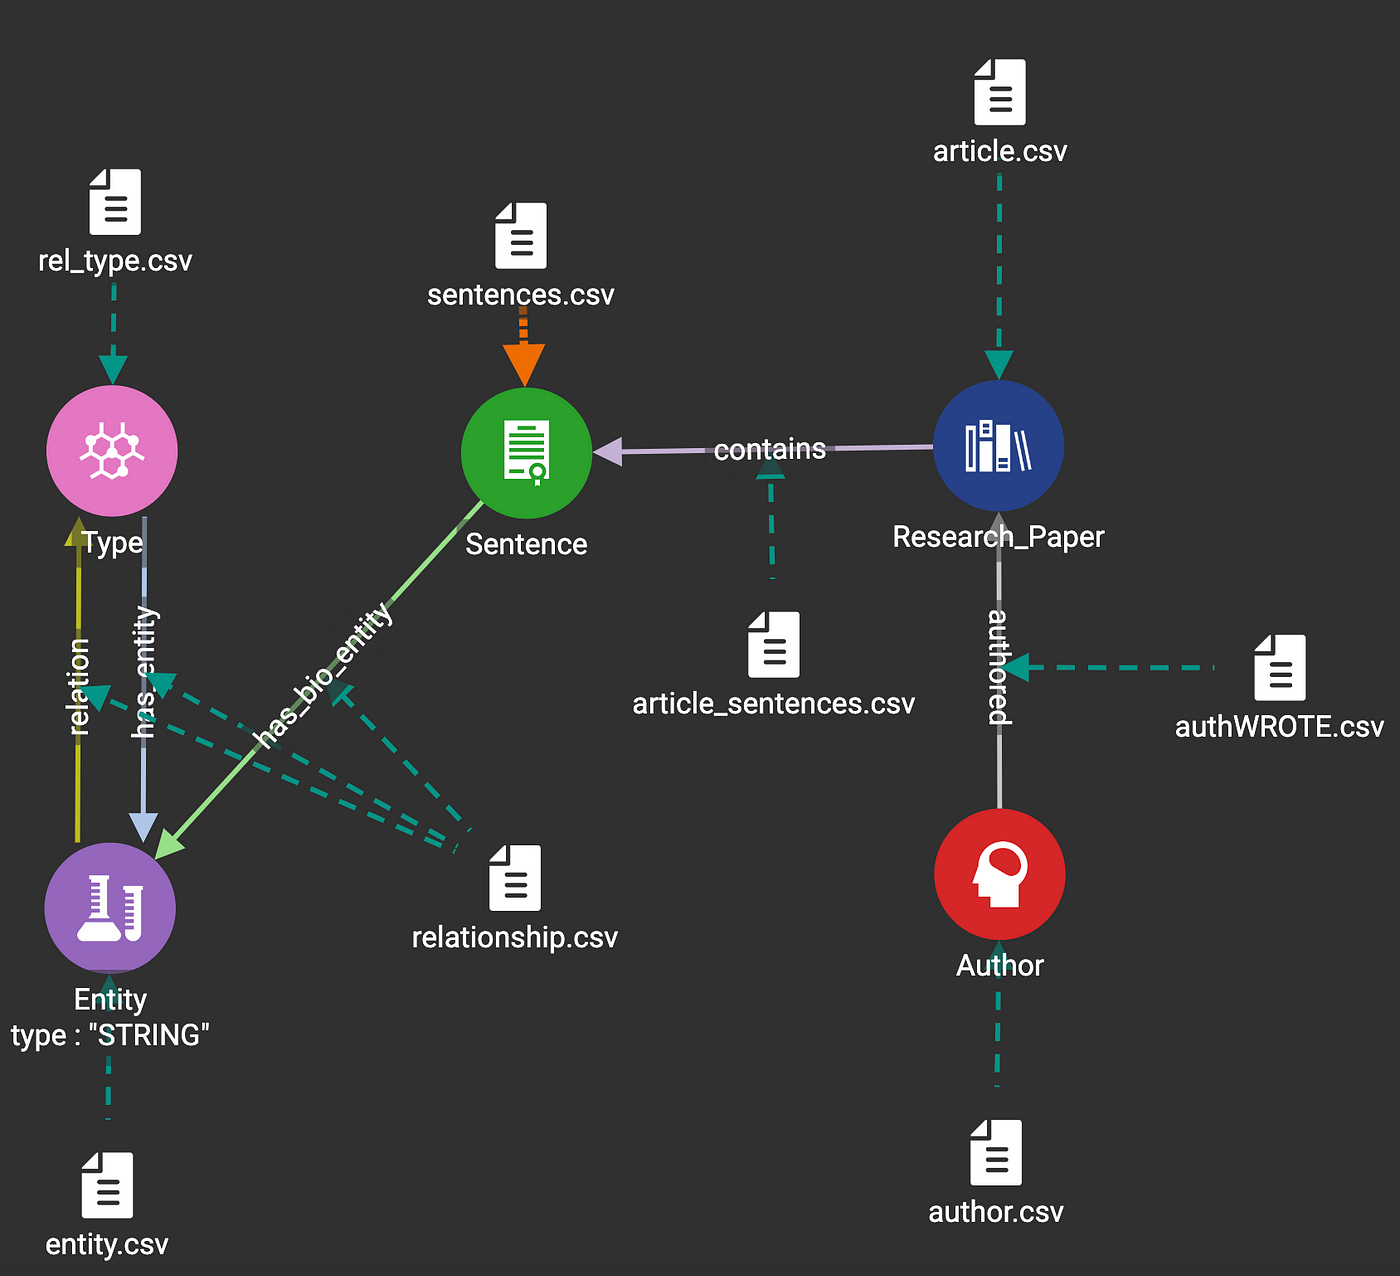
3.2 Data Mapping
3.3 Sample semantic relationship
Step-4: Sample gsql query
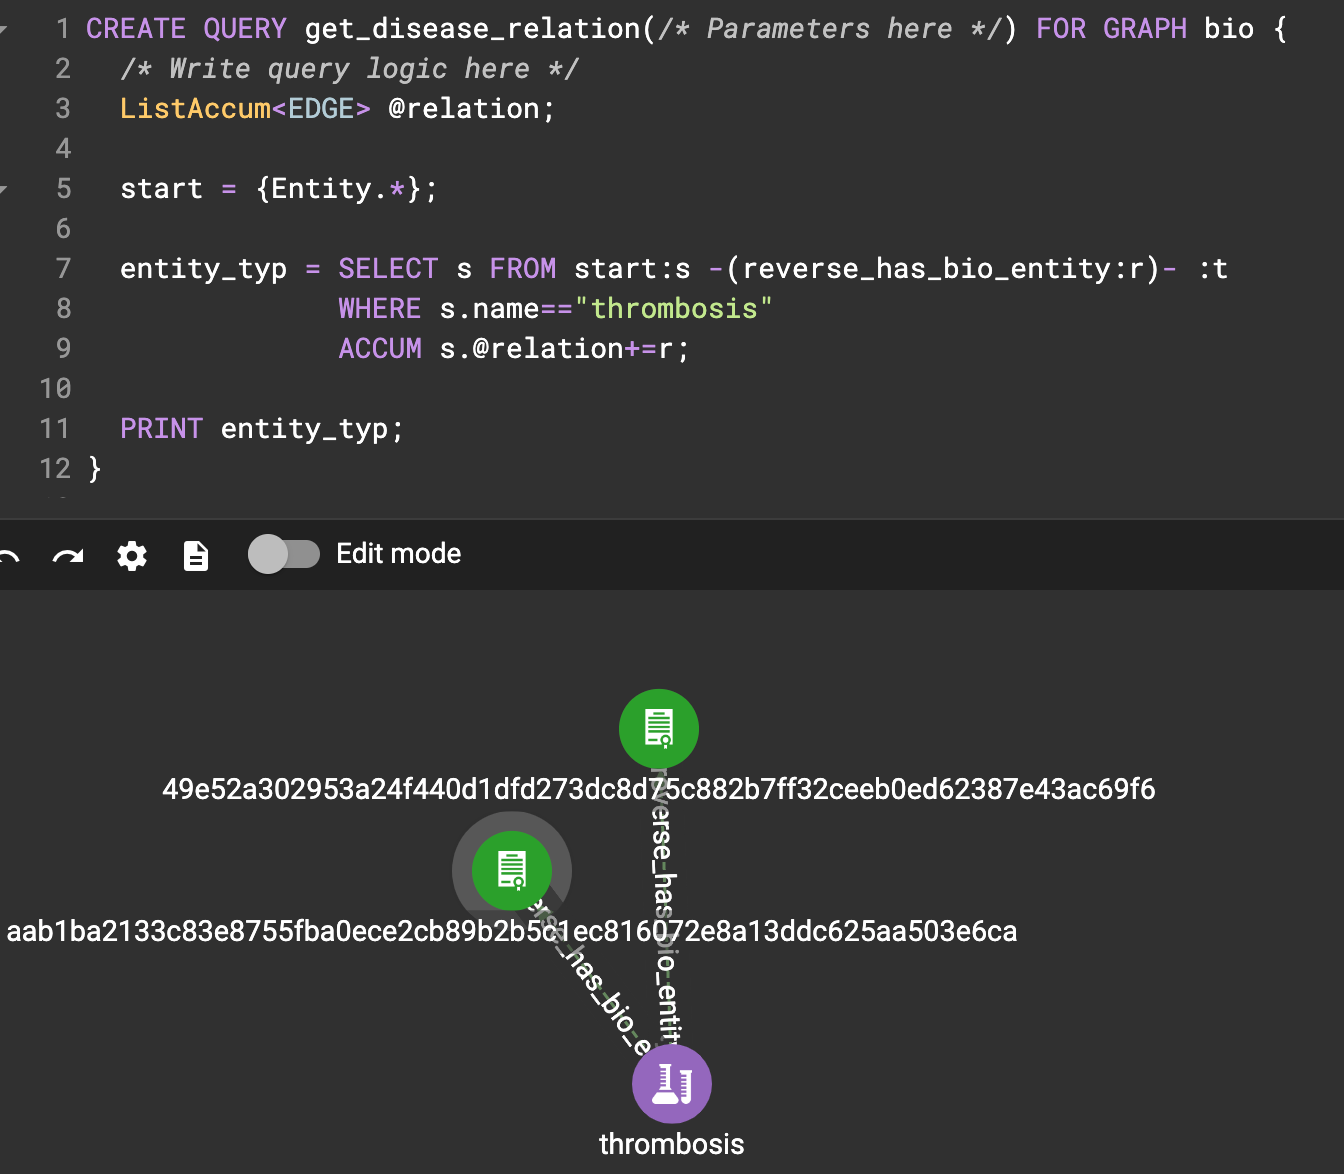
Ask the knowledge graph: Find all the source which mentions ‘thrombosis’.
CREATE QUERY get_disease_relation(/* Parameters here */) FOR GRAPH bio {
  /* Write query logic here */
  ListAccum @relation;start = {Entity.*};entity_typ = SELECT s FROM start:s -(reverse_has_bio_entity:r)- :t
               WHERE s.name=="thrombosis"
               ACCUM s.@relation+=r;PRINT entity_typ;
}
5. Conclusion
This article demonstrated how biomedical knowledge graphs could be constructed from scientific text using biomedical entity recognition and linking services like BERN2 and TigerGraph. Representing biomedical data as a semantic knowledge graph can accelerate clinical trials, pave way for hidden knowledge discovery, real-time biomedical analytics, diagnosis, clinical predications, etc., and instigate further research in the domain. I hope this can be a starter project for many such biomedical applications using TigerGraph.
6. Takeaway
A biomedical knowledge graph built using the highly scalable and super-fast TigerGraph can unwrap valuable yet hidden medical knowledge quickly setting a space for real-time machine learning and could lead to many life-saver applications!
Source Code
Please check out the Git Repo for detailed run instructions.
For any questions and clarifications, please reach out to me @ TigerGraph Developer Community Forum.
WATCH OUT FOR 👀
Stay tuned for a project on implementing a giant biomedical graph using the TigerGraph database where we will implement the biomedical knowledge graph on a bigger scale and learn some complex real-time queries.
References
https://bmcmedinformdecismak.biomedcentral.com/articles/10.1186/s12911-020-01341-5
https://het.io/about/#whats-in-hetionet
https://githubhelp.com/fractalego/zero-shot-relation-extractor