


In the banking, payment platforms, and cryptocurrency industries, graph analytic approaches such as PageRank, Label Propagation, and Cycle Detection have proven to be valuable for tracking abnormal transaction patterns, conducting anti-money laundering (AML) measures, and for transaction surveillance purposes.
Additionally, it is crucial to be able to trace the origin and destination of money transfers for effective transaction surveillance. This involves identifying abnormal transaction patterns, such as diverging from a set of accounts, transferring through mule accounts for multiple hops, and then converging into another set of accounts. Detecting these patterns enables the tracking of money transfers and tracing the source of funds for a given account.
Considering the nature of transactional networks or graphs, the transfer of money between accounts can be interpreted as the flow of a network. Maximum flow problems involve finding the highest possible flow rate through a flow network, based on its feasibility. This makes the Maximum Flow algorithm an ideal solution for answering such questions. By using this algorithm, we can determine the maximum amount of money that can be transferred from the source account to the target account. In cases where the money is split into multiple mule accounts before being converged into another account a few hops away, the account in question will have a high maximum flow number.
In this blog, we will introduce an efficient Maximum Flow implementation that can give real time performance and is able to handle massive amounts of data.

Edmonds-Karp
The Edmonds–Karp algorithm is an implementation of the Ford–Fulkerson method for computing the maximum flow in a flow network. It uses BFS to keep finding the shortest paths from the source to the sink which is called an augment path. And each time an augment path is found, at least one edge will be saturated. The algorithm keeps finding new augmented paths on the residual graph until no more augmented paths can be found. This guarantees the augment path that is found later always has an equal or longer distance than the previous one. The features of BFS traversal and monotonically increasing augment path length make the Edmonds-Karp algorithm very suitable to be implemented in the TigerGraph architecture.
A lot of very good resources explaining Edmonds-Karp can be found on the internet. For example, Edmonds Karp Algorithm, Network Flow, and Graph Theory.
Challenges
- Hard to be applied to pattern detection
The original Maximum Flow algorithm is designed to take a pair of accounts as input. However, for the purpose of pattern detection, it is necessary to identify the account pairs with a high maximum flow number across the entire neighboring subgraph. Calculating the maximum flow between every pair of accounts within the k-hop neighborhood would result in a significantly high complexity. - High complexity for applying restrictions
In the vast majority of real-life use cases, cycles are subject to certain restrictions, such as the maximum time gap between one transaction and the following one within each cycle, or the requirement for the subsequent transactions to have similar amounts to the previous transaction.
For each account, a restriction check must be performed with a complexity of O(dout*p), where dout represents the number of outgoing transactions, and p represents the number of paths that go through the vertex. This means that for each incoming path of an account, it must verify if every outgoing transaction can be considered as a subsequent transaction in the candidate cycle path. The number of paths going through an account is generally much larger than the number of incoming transactions, as each incoming transaction may initiate one candidate cycle path, while any upper-stream transactions of the incoming transactions can initiate a new candidate cycle path that goes through the downstream accounts.
- High complexity to calculate shortest paths in multiple passes
The original implementation requires the calculation of a new shortest path based on the current residual graph, which necessitates multiple scans of the k-hop residual graph.
Innovation
In this blog, we will introduce an efficient method for calculating the Edmonds-Karp maximum flow with the following features:
- Vertex capacity-based approach where each vertex represents a transaction, and the capacity is the transaction amount
- Scalable to handle massive amounts of data and provides real-time results
- Calculates the maximum flow for all k-hop neighborhoods within limited number of hops
Implementation
In this session, we will begin with a basic version of the Edmonds-Karp implementation on TigerGraph. Then, we will explore how to apply it to a transactional graph and how to implement the vertex capacity variant. Finally, we will discuss the approach for calculating the maximum flow for all k-hop neighbors.
The Schema
In this blog, we will present a solution and experiments within the context of the TigerGraph implementation, which is an MPP (Massive Parallel Processing) graph analytical platform.
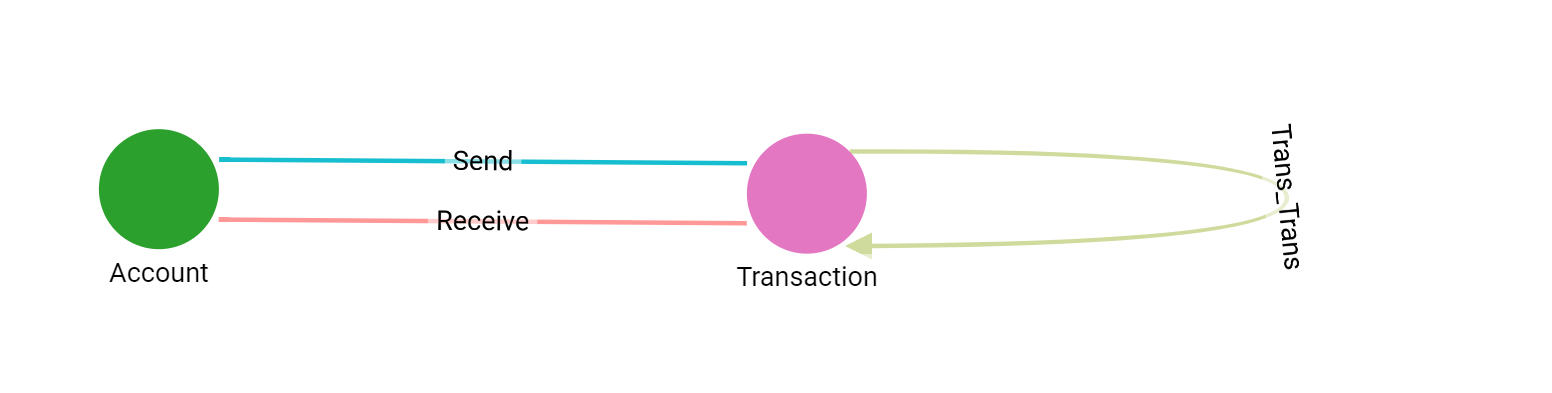
The graph schema visualization below displays Account and Transaction vertices. An account can either receive money via a transaction or send money via a transaction. Each transaction will have a sender and receiver, and the Trans_Trans edge, which connects transaction vertices, is a directed edge created through an optional preprocessing process.
Preprocessing (Optional)
Intuition: Establish a direct connection between transaction vertices to solve the second challenge. By connecting transaction vertices, we can follow the order of time and fulfill other restrictions. This reduces the complexity of each account from O(dout*p) to O(dout*din) since the checking of restrictions is done only once during this step. Here, din is the number of incoming transactions.
Implementation: Connecting incoming transactions of an account to outgoing transactions if they follow the order of time and have a similar amount. Once the connections are established, the following steps can traverse the Trans_Trans edges without having to perform constraint checking again.
Path Propagation
Intuition: The Edmonds-Karp algorithm evaluates the shortest augment path in every iteration, with the length of the augment paths monotonically increasing. Similarly, we start from all the outgoing transactions of the source account and propagate all paths with lengths from 1 to k to all the k-hop neighboring transactions, evaluating the paths received by the receiver accounts of the transactions.
This approach allows the algorithm to calculate the maximum flow for all k-hop neighborhoods. The path that has exhausted the capacity for one receiver account can be a valid augment path for another receiver account. Moreover, the current paths with length d can be reused for the next iteration to calculate the paths with length d+1. Thus, this approach solves the challenges #1 and #3.
Implementation: During the path propagation, in each iteration, all the possible paths with distance 1 to k are generated from all the outgoing transactions of the source account to all the k-hop neighboring transactions. The generated paths are then evaluated by the receiver accounts of the transactions.
After each iteration, the current maximum flow and capacity information stored on account vertices’ local data structures are updated based on the evaluated paths received. For each path received, if all the transactions’ remaining capacity is larger than 0, the minimum remaining amount is taken as the incremental flow amount to add to the total. Also, this value is reduced from the remaining amount of each transaction on the path.
For example, if we consider Account 1 as the source and Account 2 and 3 as sinks, in each iteration, all possible paths from Account 1 to all k-hop neighboring transactions are generated and evaluated by Account 2 and 3. After each iteration, the maximum flow and capacity information of Account 2 and 3 are updated based on the evaluated paths received.

Traverse Reversed Edge on Residual Graph
In the maximum flow algorithm, it is required to traverse in the reversed direction when calculating the residual graph. The residual graph represents the remaining flow that can be pushed from a given vertex to its adjacent vertices.
When calculating the residual graph, we subtract the current flow from the capacity of the edges that have flow in the forward direction. But we also need to consider the possibility of pushing flow in the opposite direction, which means we need to consider the capacity of the edges in the reverse direction when calculating the residual graph. Therefore, we need to traverse the graph in the reverse direction to find the edges that can potentially carry flow in the reverse direction.
Intuition: To handle the vertex capacity variant of the maximum flow calculation, each vertex is considered as two vertices connected by a directed edge. The incoming vertex represents the capacity entering the vertex, while the outgoing vertex represents the capacity leaving the vertex. The directed edge is created from the incoming vertex to the outgoing vertex to represent the capacity of the vertex.

Implementation: It is not necessary to convert the graph into format above. We will simulate the logic discussed above on the transaction vertices without creating the actual incoming and outgoing vertices for space saving and simplicity.
When propagating the path, both directed edges and their reverse edges are traversed. When traverse the reversed edges, it is considered to be traversing the residual edge.
When evaluating the paths, for any edges in the original direction, store the incremental flow amount in a local map on the account vertexes to indicate that between a pair of transactions what is the used amount. Later when we have to traverse in an reversed order for residual graph traversal, the amount accumulated previously will be used to judge if the reversed/residual edge has sufficient flow.
Here is an example:
If we previously traversed path A->C->E, and got minimum flow of 200.

The residual amount on E->C and C->A also become 200.

Later if we traverse the path of C->A->D, since C->A is in reversed order therefore the residual amount will be used. The flow we get from path C->A->D is 100. Note, even A’s amount is used up, but because the residual path doesn’t go through the edge between Incoming A and Outgoing A, therefore it is still a valid path.

Below is the value after reducing 100 from the residual edge and incremented the original transaction capacity amount of C.

Conclusion
In conclusion, Maximum Flow algorithms are being used to determine the highest possible flow rate through a flow network, based on its feasibility, making it an ideal solution for transaction surveillance. However, the original Maximum Flow algorithm is designed to take a pair of accounts as input, and applying it to pattern detection poses several challenges, including high complexity for applying restrictions, calculating shortest paths in multiple passes, and identifying account pairs with high maximum flow numbers across the entire neighboring subgraph. Nevertheless, this blog proposes an innovative and efficient approach to calculate the maximum flow with a vertex capacity-based approach, scalable to handle massive amounts of data, providing real-time results, and calculating the maximum flow for all k-hop neighborhoods within a limited number of hops.


