


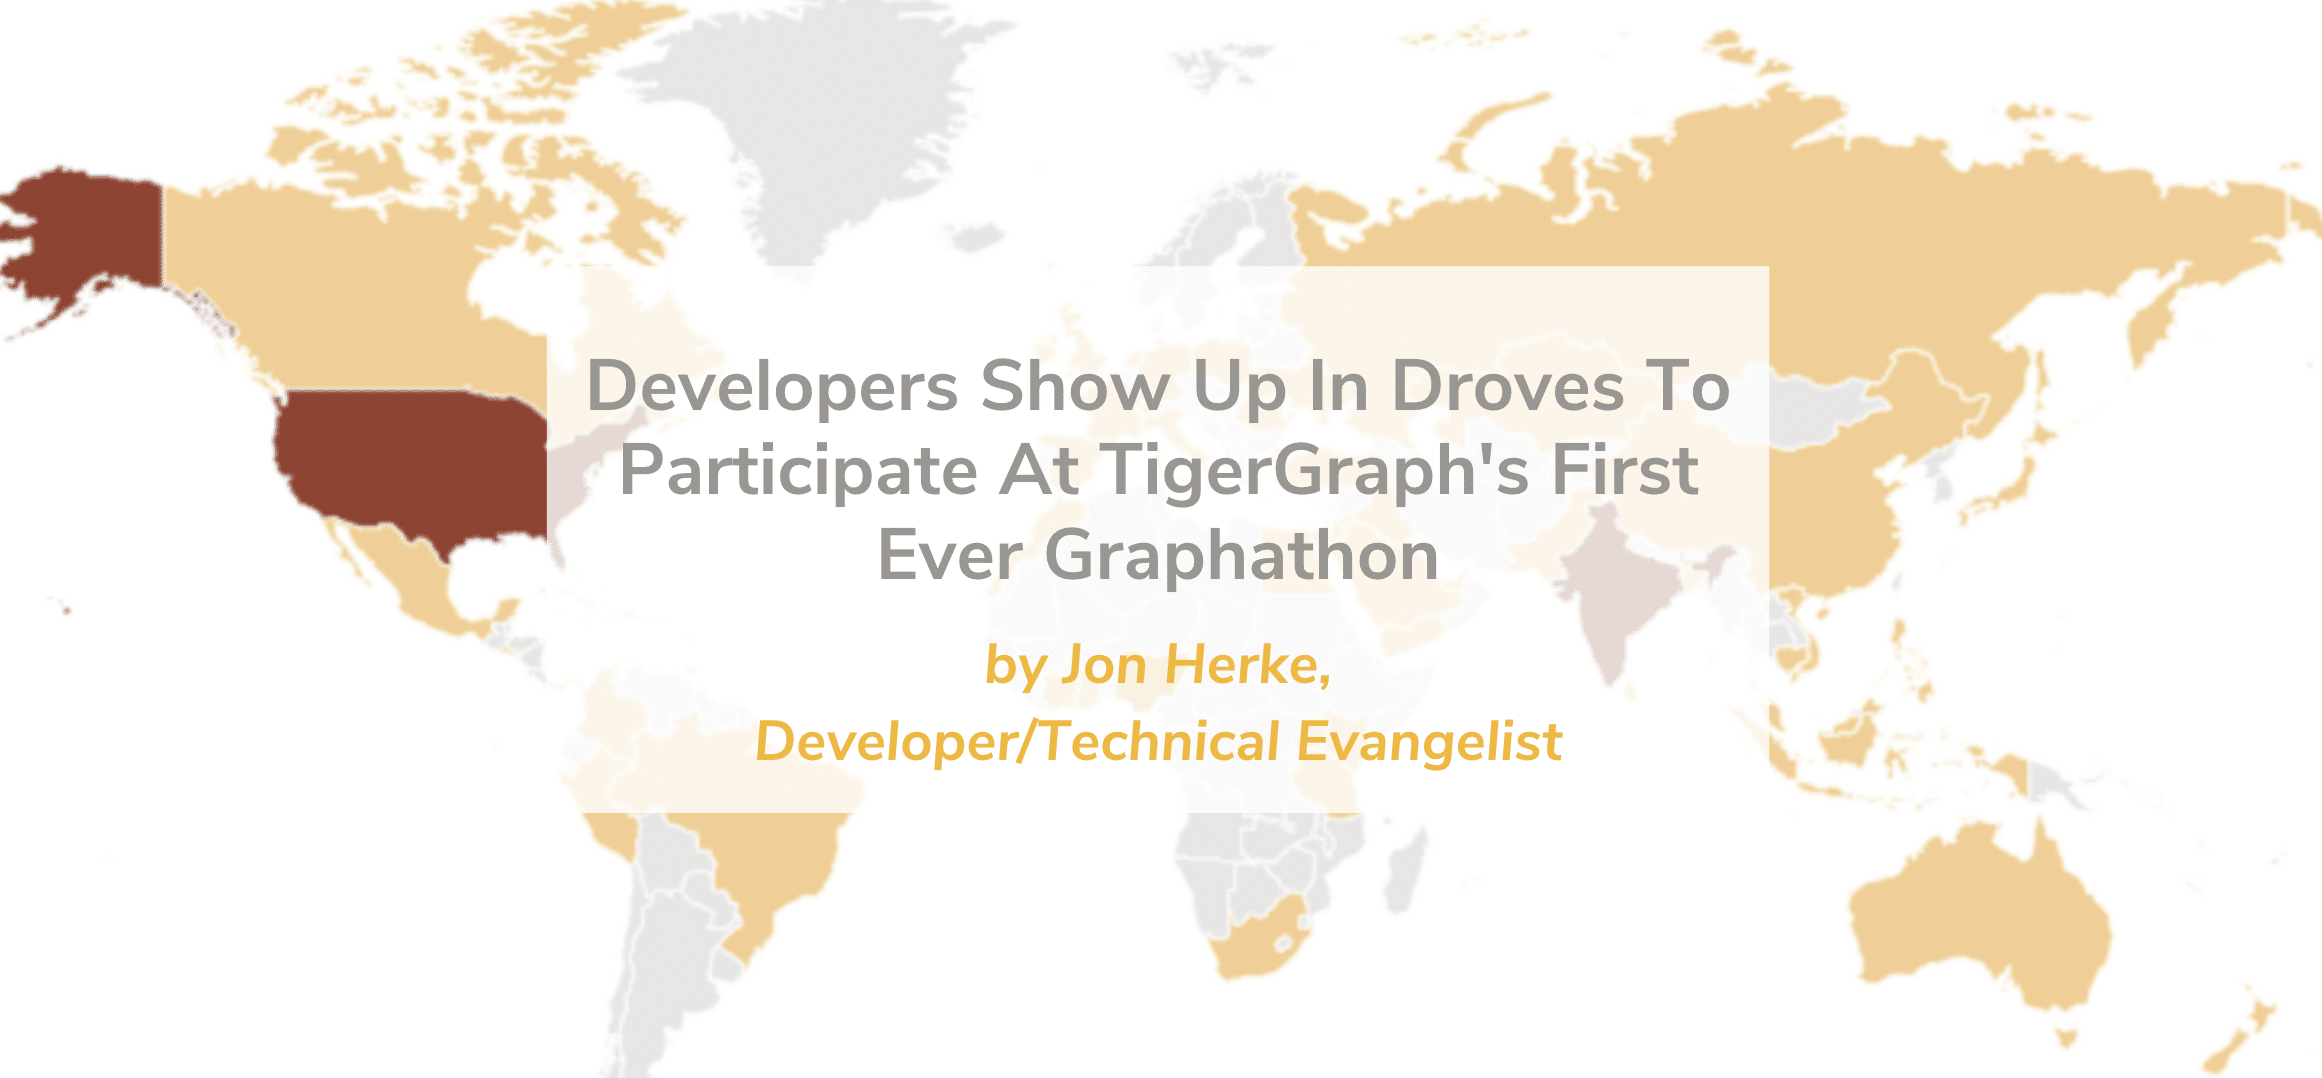
Developers Show Up In Droves to Participate at TigerGraph’s First Ever Graphathon
Developers from around the world (52 Countries) flocked to the TigerGraph Graphathon with many submissions that blew TigerGraph staff away. Check out a few of the statistics and winning projects…
Deploy a Full Stack Application With No Code
Launching a dashboard to visualize South Korea Covid-19 Data using TigerGraph, Streamlit, and Google Colab Originally posted on Medium by Akash Kaul and Rohan Shiva Introduction Creating a nice, clean,…
Analytical Transaction Processing (ATP): Real-Time, Graph Decision-Making Made Easy
Originally posted on ITProPortal There are two “must have” ingredients to making effective business decisions: a complete contextual view of the situation and real-time data. Carl Olofson, Research Vice President…
User-defined Indexes In TigerGraph 3.0
Introduction User-defined Indexes or Secondary Indexes (as they are commonly called in Database Industry) are a critical feature that enhance the performance of a database system. Indexes allow users to…

Designing a 3D Healthcare Network Graph
Originally posted on Towards Data Science by Akash Kaul. Introduction Graph databases have been revolutionizing the world as we know it. In the past decade, they have proven their usefulness in tons…
Building the Next-Generation Agile Catalog for Retail eCommerce with Graph Database & Analytics
Introduction Product catalog and inventory management is the foundation and is crucial to the success of any eCommerce or traditional retailer. Selling products through multiple sales channels could easily cause…

Create a Graph Data Pipeline Using Python, Kafka and TigerGraph Kafka Loader
Originally posted on Medium by Kelley Brigman. Follow Kelley on Medium and Linkedin. This article will discuss an efficient method for programmatically consuming datasets via REST API and loading them into TigerGraph using Kafka and…
- Go to the previous page
- 1
- …
- 19
- 20
- 21
- 22
- 23
- 24
- 25
- …
- 34
- Go to the next page

