
Summary
RepoLinks is a graph for better collaboration. It connects developers and provides a window into an organization’s technology stack.
Overview
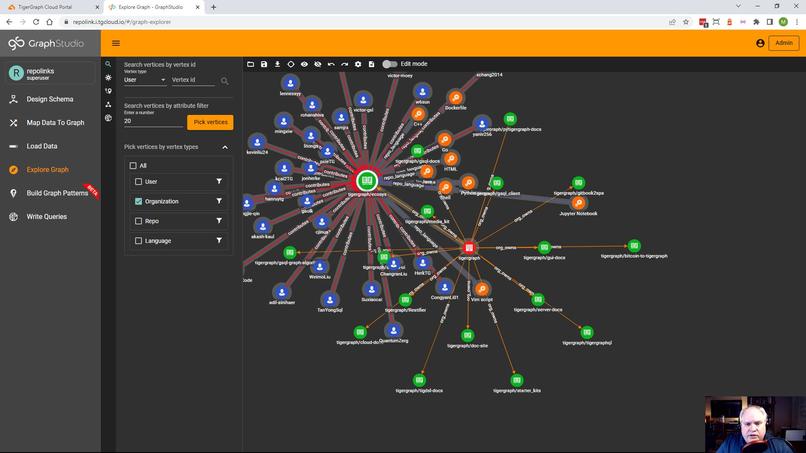
A graph that shows the dense, complex interconnections between software developers, programming languages, and software projects, to better understand factors such as skill sets, productivity, and technology evolution within organizations.
Inspiration
The contestant works in an organization with several hundred repos. It can be difficult to get a big picture view of the technologies we use and the people that use them. Leveraging Git repo data in a graph database is a natural fit to grasp the bigger picture.
What it does
Repolinks starts with a Node.js script that takes in a GitHub organization name that it uses to export all the connected repos, contributors, and languages to a CSV file. A TG graph is then created for each new organization based on the global schema so multiple organizations can be supported. The CSV files are then mapped and loaded into the graph. Using the TigerGraph Explore and Query tools you can answer several questions:
- What programming languages and technologies are in use by the organization?
- What code repositories use those technologies?
- Who is contributing to those repos and how much?
- How are developers within the organization connected?
- Who is the best person to answer my question about a particular technology or project?
- What skills should I look for in new developers and where are my training dollars best spent?
- What do I have in common with other developers in my organization?
How I built it
I built the GitHub data export script in Node.js using the GitHub API and the “fast-csv” library. The graph was built in TigerGraph (of course 😉).


