What is graph analytics?

TigerGraph has brought forward a free Developer Edition of its graph analytics platform for lifetime non-commercial use.
But, please, what is graph analytics?
As defined nicely here by Hitachi Vantara’s Bill Schmarzo, “Graph analytics leverage graph structures to understand, codify, and visualise relationships that exist between people or devices in a network. Graph analytics, built on the mathematics of graph theory, is used to model pairwise relationships between people, objects, or nodes in a network. It can uncover insights about the strength and direction of the relationship.”
Mike Ferguson of IBM further defines four ‘types’ of graph analytics here.
- Path analysis: Determines the shortest distance between two nodes in a graph.
- Connectivity analysis: Determines weaknesses in networks. Community analysis: Determines distance and density–based analysis in groups of people and identifies whether individuals are transient or if the network will grow.
- Centrality analysis: Determines the most influential people in a social network or most highly accessed web pages.
Back to the news story that drove this post, TigerGraph produces a graph analytics platform for developers to create their own big data graph applications i.e. ones whose central function will feature an element of the types of data analytics relationships detailed above.
“As graphs continue to go mainstream, the next phase of the graph evolution has arrived. Cypher vs. Gremlin is no longer the right question to ask,” said Dr. Yu Xu, founder and CEO of TigerGraph. “The time has come to rethink graph analytics with TigerGraph and GSQL, the most complete query language on the market. One hour with our free Developer Edition is all you need to experience TigerGraph’s superiority in unlocking value from connected data at massive scale.”
This technology stores all data sources in a single, unified multiple-graph store that can scale out and up to explore, discover and predict relationships. Unlike traditional graph databases, TigerGraph can scale real-time multi-hop queries to trillions of relationships.
TigerGraph offers enterprise graph MPP (massively parallel processing), to support big data, complex business queries – all with GSQL, the graph query language that is claimed to be intuitive for people who already know SQL.
Other graph analytics tools include Neo4j and Amazon Neptune.
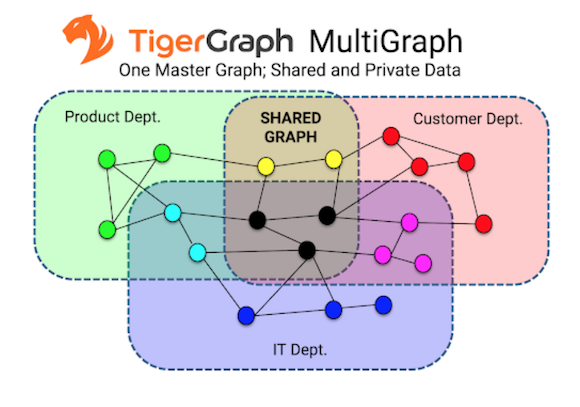
Image: TigerGraph