Enterprise Times spoke to Todd Blaschka – COO TigerGraph and Gaurav Deshpande – VP Marketing TigerGraph about the announcement. The solution will be available in limited preview in Q1 2019.

The company first unveiled its product a year ago and has won several high profile customers including Uber, VISA, Alipay, Wish, China Mobile and State Grid Corporation of China. Most currently use a private cloud offering in Azure or AWS. It also has several customers, including insurance companies that use the solution on-prem according to Todd Blaschka – COO TigerGraph.
TigerGraph is only available initially in the public cloud from AWS. We asked Blaschka which regions it would be available from. He replied “The regions within AWS will be in the US as well as regions in EMEA, specifically Germany, the UK and then France. Asia will follow after those initial roll outs in 2019.”
It has just opened its first European office in the UK and already has offices in China and Japan. According to Blaschka it will look to expand further in Europe as well as Asia in the future.
What is different
TigerGraph claims that its solution outperforms other Graph Databases. Its own benchmark tests saw query speeds of 40-337 times faster than other 1st and 2nd generation graph databases. These included Neo4j, Neptune, JanusGraph and ArangoDB. A more independent test saw similar if not even more stark differences between TigerGraph and others. Each Graph Database has its own advantages but in terms of processing power it seems as if TigerGraph currently enjoys a significant lead.
TigerGraph also called out four areas that it will offer in the public cloud solution.
- TigerGraph GraphStudio. This an end to end visual SDK, end-to-end visual SDK for creating and maintaining data schema, mapping datasets, loading data,building and executing queries and exploring results all in a seamless experience in cloud. Importantly this delivers on the key concept of explainable AI. It is a concept that Blaschka believes will become more and more important as time passes. He explained it as “being able to use training data to extract insights and being able to explain how did I get those insights to be able to move that into my AI application.”
- Support for 4 key graph deployment patterns – Link Analysis, Subgraph Discovery, Pattern Matching, Hub & Community Detection.
- Starter kits for popular business use cases for rapid time to value –schema, sample data, preloaded queries. It includes initial templates for Anti-Fraud, Supply Chain and Social Media Applications on launch.
- TigerGraph Graph Algorithm Library with user extensible/customizable and highly scalable graph algorithms including PageRank, Community Detection and Shortest Path.
Explainable AI delivered
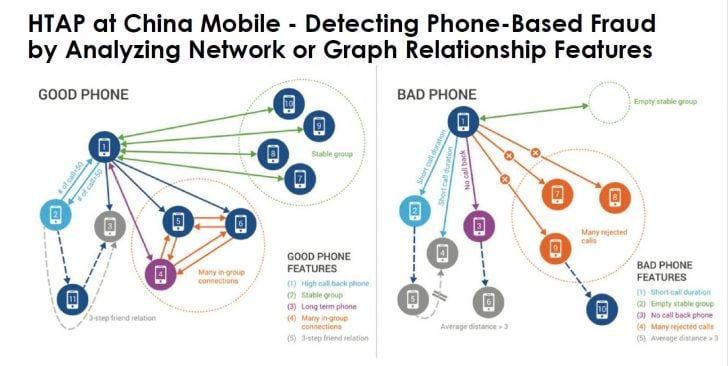
One example of explainable AI was demonstrated by Deshpande. There is an issue in China with individuals and companies obtaining SIMs and using them for fraudulent or cold calls. The company wanted to reduce the problem and looked to TigerGraph to solve it. TigerGraph now analysis several factors about calls made as per the diagram below such as:
- no of calls
- duration
- rejected calls
These help identify when a phone number is a “bad phone”. Deshpande explained that: “we do this for 6 to 7 million subscribers with 2000 calls per second in real time. This is where Graph database technology makes a real difference, it allows China Mobile to shut down bad phones almost as soon as they appear rather than having to wade through historical data reports or investigate individual reports.”

The diagram clearly shows how and why decisions around bad phones are made. The decision ultimately ends up with a human being, but the augmented insight is clearly explainable.
Who will use it
TigerGraph is targeted at both IT departments and Line of Business IT. It is seeing traction from a wide range of industries including start ups looking to leverage the technology for their own solutions. New customers include Intuit, Zillow and PingAn Technology. TigerGraph would not be drawn on what Intuit is actually using the solution for other than it is used for a FinServ application.
Blaschka added that it has good use cases for both Customer 360 and GDPR applications. He added: “Graph is a terrific tool to be able to pull where Steve’s data lies in the various tools and databases and then present it visually. and then demonstrate after the fact that Steve’s data that you wanted removed has in fact been removed.”
Enterprise Times: What does this mean
TigerGraph is not long out of incubation. Founded in 2012 it is one of the fastest growing graph database companies in existence. That is has only raised $31 million in a Series A funding round also speaks volumes for its success.
Importantly, it is already on multiple hosting platforms. It is a company that is worth following, especially as it has the chance to grow even faster once the public cloud solution is available. This will open up its technology to a far wider audience that will look to leverage one of the fastest analytical platforms around.


