
TigerGraph
ResourcesPathfinderDiscord(opens in a new tab)
Resources

Everything, In One Wall

Videos, courses, hands-on tutorials, docs, and blog posts. One place for every phase of learning.

TigerGraph
ResourcesPathfinderDiscord(opens in a new tab)

© 2026 Tiger Graph Dev Hub. All rights reserved.

  • Privacy Policy|
  • Terms of Service

Applied · 4

Clear all
  • Reference
  • Case study
  • Talk
  • Tutorial

Levels

  • All Resources
  • Beginner
  • Intermediate
  • Advanced

Categories

  • Videos514
  • Docs644

749 resources · page 19 of 63

NewestOldest
3 Col Grid2 Col GridList
Talk41 min · Aug 20, 2021

Northeastern Hackathon with TigerGraph and Plotly Kickoff

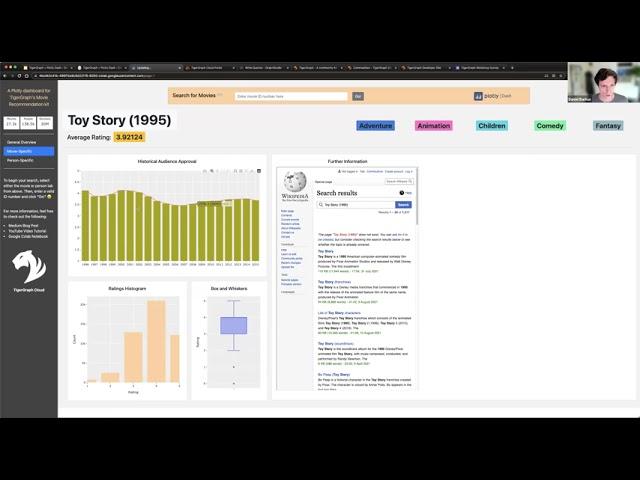
We invite you to our Northeastern Hackathon with TigerGraph and Plotly! Learn how to get started in this kickoff video! https://www.eventbrite.com/e/northeastern-hackathon-with-tigergraph-and-plotly-tickets-162717192503

Glossary
50
  • Blog posts222
  • Code & samples126
  • Graph Resources52
  • Assets

    • Definition36
    • Tutorial113
    • How-to guide319
    • Reference312
    • Concept109
    • Troubleshooting12
    • Security advisory4
    • Runbook
    • Article173
    • Case study26
    • Talk298
    • Release note24
    • Demo114
    • Webinar12
    • Event12
    • Report24

    Tags

    • #Fraud and AML
    • #Entity resolution
    • #Recommendations
    • #GraphRAG and AI
    • #Graph machine learning
    • #Search
    • #Network analysis
    • #Performance and scale
    • #Running TigerGraph
    • #Evaluating graph
    Discover
    Talk36 min · Aug 20, 2021

    UCSD: TigerGraph + Plotly Part 3

    Take the survey below: https://docs.google.com/forms/d/1pY0aK1UgTj8ZnWhBTCoELCihN7DKvxDU2RnKWZRGPC0/viewform?editrequested=true

    Discover
    Tutorial39 min · Aug 9, 2021

    UCSD: Integrate TigerGraph with Jupyter Notebooks Part 2

    Part 2 of a 3 part series for UCSD: Integrate TigerGraph with Jupyter Notebooks (pyTigerGraph, TigerGraph, and Google Colab) Survey https://docs.google.com/forms/d/e/1FAIpQLSf8VIl6ts8gNN8XIYwLyq8xfpGUJTZTPQG4vX3elgsARFTQw/viewform?usp=sf

    Discover
    Talk43 min · Aug 4, 2021

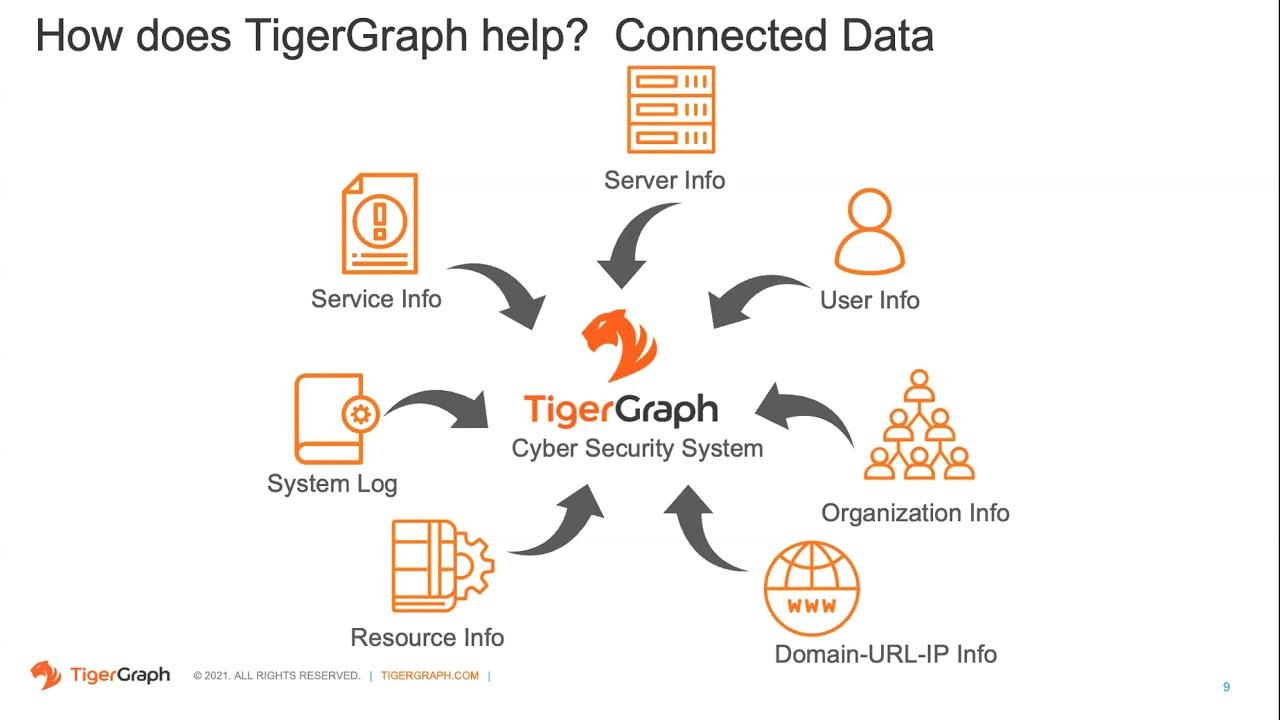
    Graph Gurus 55: Improving Cyber Threat Detection with Graph Analytics

    The sophistication of cybercriminals is increasing relentlessly. Accenture found that 68% of business leaders feel their cybersecurity risks are increasing. More and better technologies are required to detect attacks and prevent them. In th

    Discover
    Tutorial28 min · Aug 2, 2021

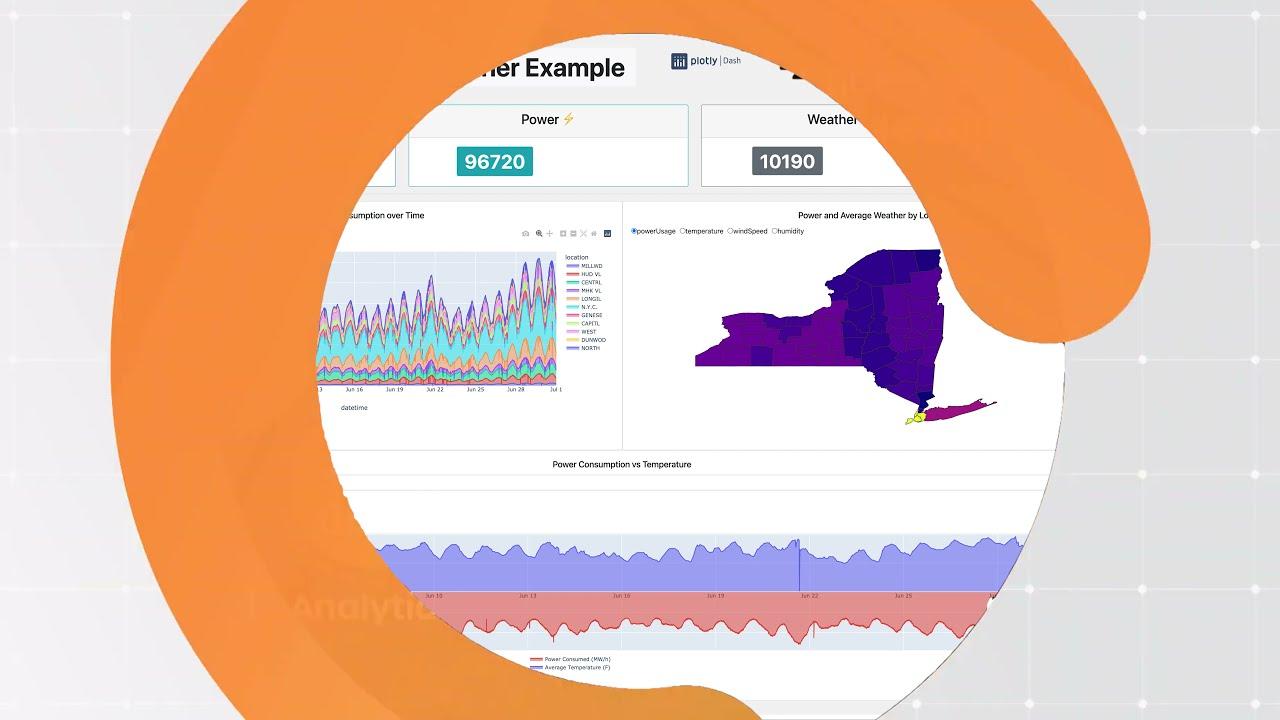
    Integrating TigerGraph with Plotly Dash

    Learn how you can integrate TigerGraph with Plotly Dash to make an interactive dashboard. Follow Along with the Notebook shown in the video: https://colab.research.google.com/drive/1R8P6V8AGd7eumoIA6Poqh0Dy8BuKIThi?usp=sharing TigerGraph

    Discover
    Case study2 min · Aug 2, 2021

    Wish.com Increases Revenues with Personalized Ecommerce Recommendations with TigerGraph

    Discover
    Tutorial46 min · Jul 30, 2021

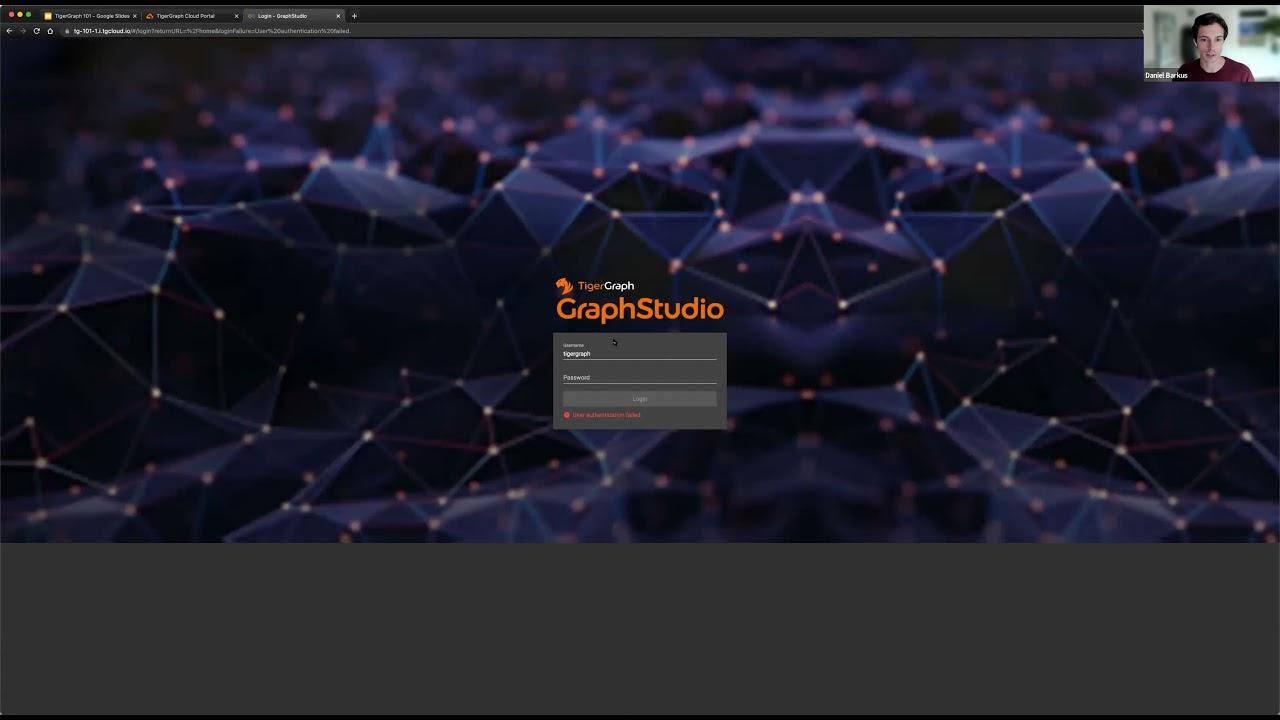
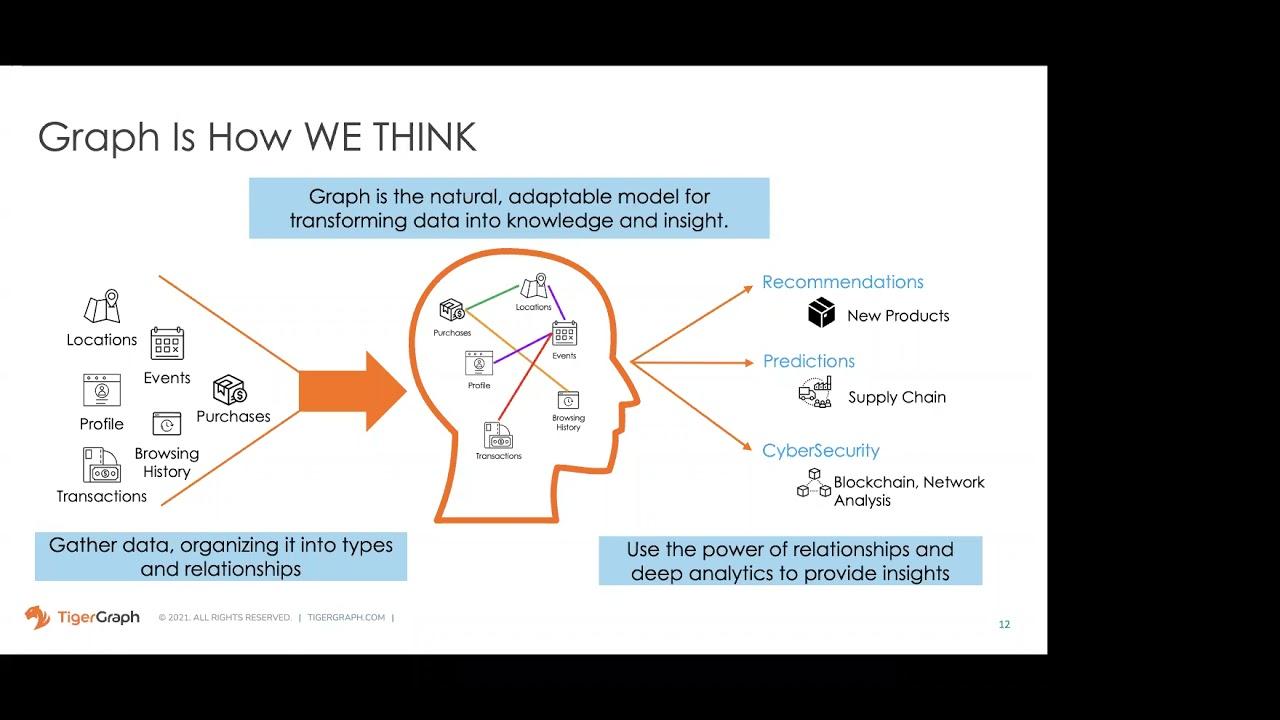
    UCSD: TigerGraph 101 Part 1

    ➡️ Intro to Graph and TigerGraph. ➡️ Comparison to relational databases and when to use graph. Real world use cases. ➡️ Walkthrough of creating your first graph through Graph Studio. Take this short quiz to test your knowledge: https://d

    Discover
    Talk44 min · Jul 23, 2021

    Kampf gegen Finanzbetrug: Graph Analytics und Machine Learning als entscheidende Technologie!

    Presenter : Mario Werner, Regional Manager DACH

    Discover
    Tutorial14 min · Jul 23, 2021

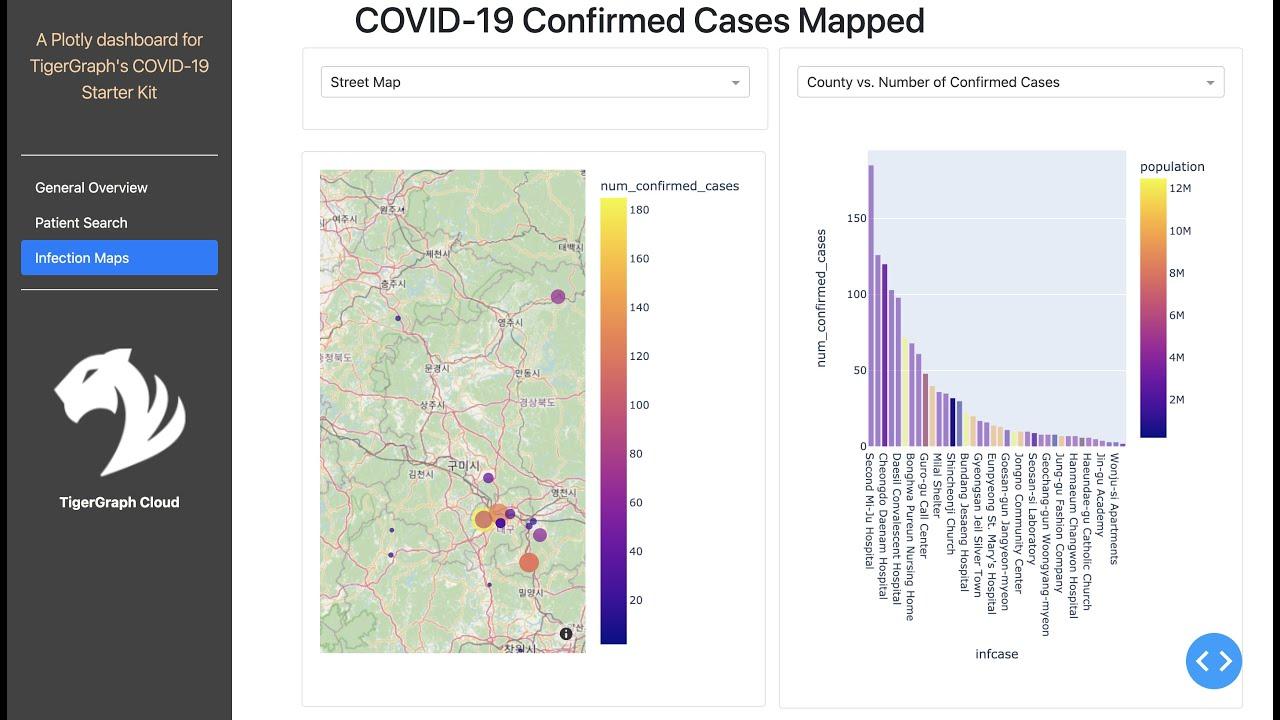
    Introduction to Plotly Dash using TigerGraph COVID-19 Starter Kit

    By Shreya Chaudhary, Developer Advocate Intern at TigerGraph Link to Colab to follow along (https://colab.research.google.com/drive/1ElzCA9BXJsNuJxn7yq7Mgfmvwtvf-lag?usp=sharing) Link to pyTigerGraph documentation (https://pytigergraph.git

    Discover
    Talk1h 12m · Jul 14, 2021

    Graph Gurus 54: Leveraging pyTigerGraph for Big Data Analytics from Google Colab

    TigerGraph is an analytical and data science platform that provides new, powerful tools for advanced analytics, machine learning and artificial intelligence. These types of workflows are generally driven by data scientists who are used to c

    Discover
    Tutorial22 min · Jul 9, 2021

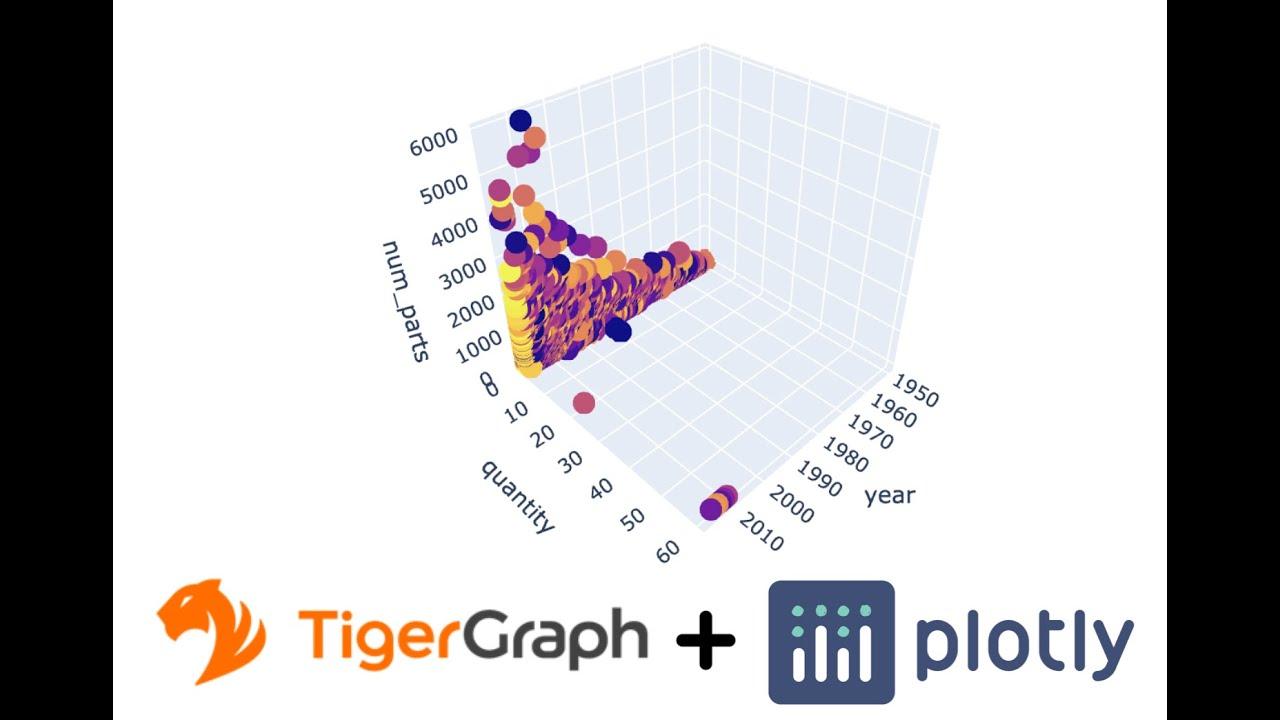
    Using Plotly to Visualize your TigerGraph Data

    By Shreya Chaudhary, Developer Advocate Intern at TigerGraph Link to Colab to follow along (https://colab.research.google.com/drive/13nSPlySH9deZs0mft7oikOSCuUo5RBI6?usp=sharing) Link to pyTigerGraph documentation (https://pytigergraph.git

    Discover
    Talk49 min · Jul 8, 2021

    PartnerGraph Webinar - Publicis Sapient - Supply Chain and Logistics Management

    ➡️Manufacturers face great challenges dealing with enormous amounts of parts, components and materials needing to be sourced from a great variety of globally distributed vendors, then processed and assembled in many stages, making it expone

    Discover
    1…181920…63