TigerGraph
ResourcesPathfinderDiscord(opens in a new tab)
Resources

Everything, In One Wall

Videos, courses, hands-on tutorials, docs, and blog posts. One place for every phase of learning.

TigerGraph
ResourcesPathfinderDiscord(opens in a new tab)

© 2026 Tiger Graph Dev Hub. All rights reserved.

  • Privacy Policy|
  • Terms of Service

Applied · 4

Clear all
  • Reference
  • Case study
  • Tutorial
  • Concept

Levels

  • All Resources
  • Beginner
  • Intermediate
  • Advanced

Categories

  • Videos514
  • Docs644

560 resources · page 9 of 47

NewestOldest
3 Col Grid2 Col GridList
Tutorial28 min · Aug 2, 2021

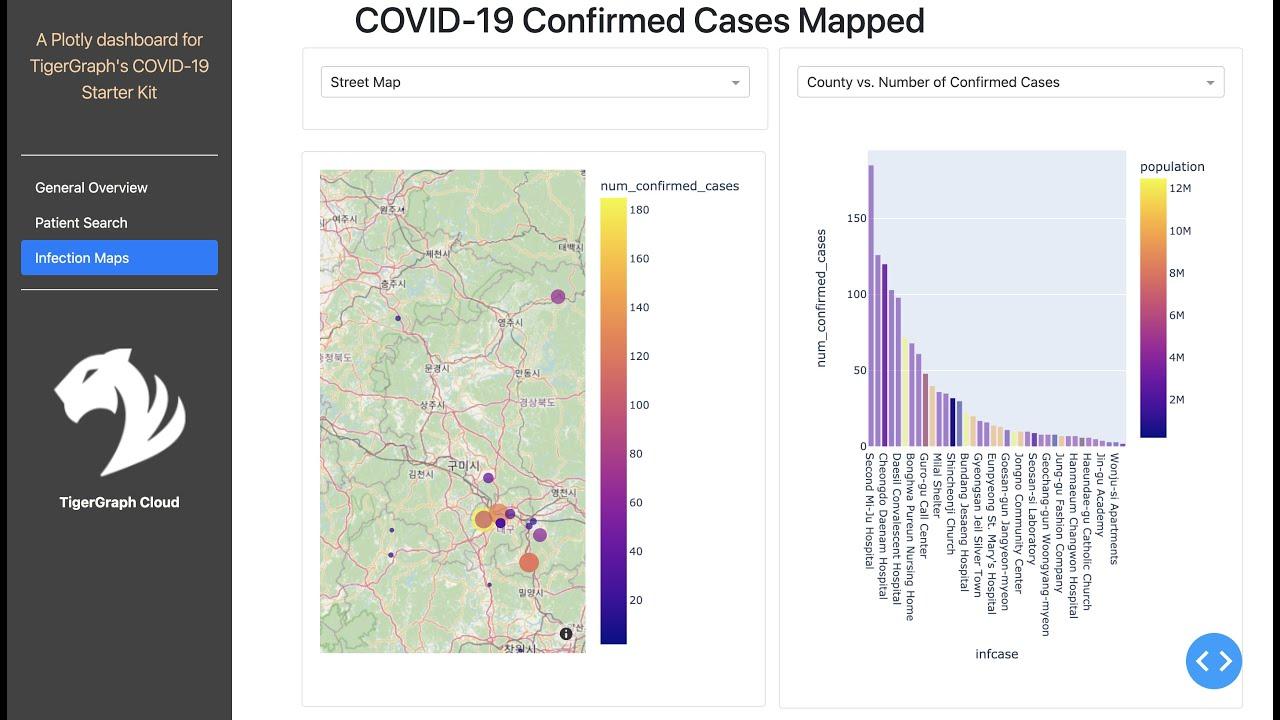
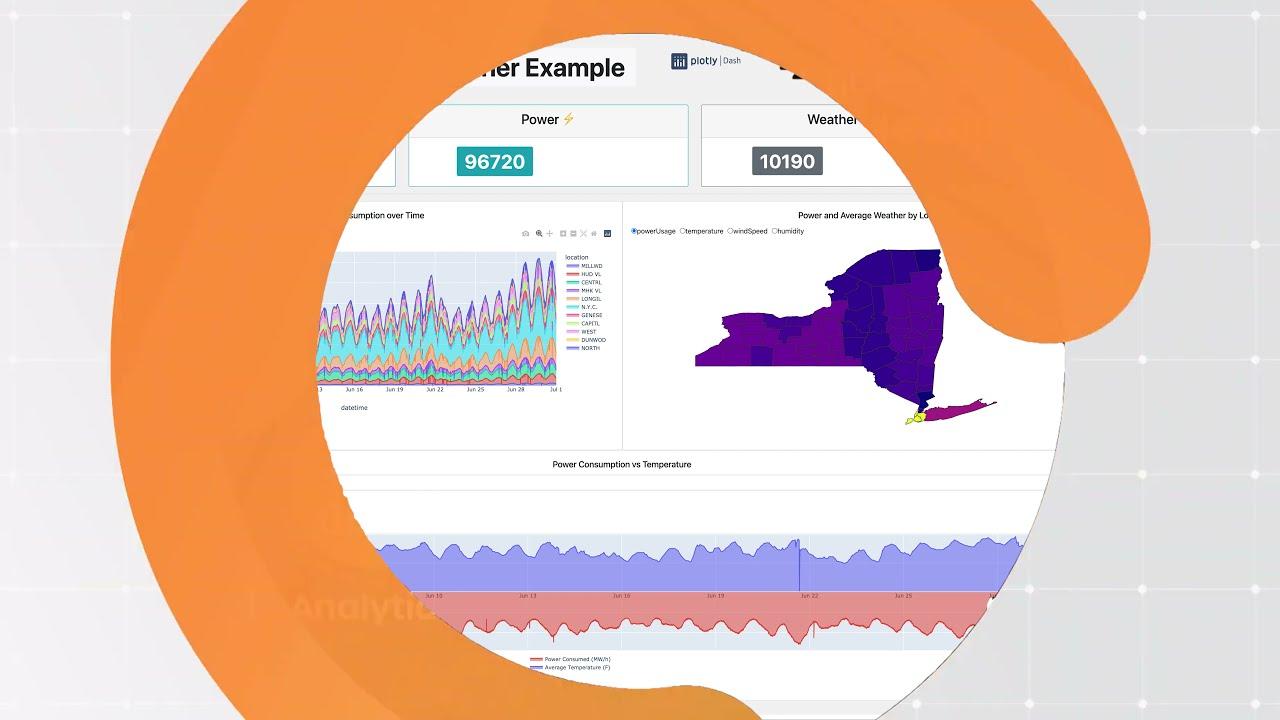
Integrating TigerGraph with Plotly Dash

Learn how you can integrate TigerGraph with Plotly Dash to make an interactive dashboard. Follow Along with the Notebook shown in the video: https://colab.research.google.com/drive/1R8P6V8AGd7eumoIA6Poqh0Dy8BuKIThi?usp=sharing TigerGraph

Glossary
50
  • Blog posts222
  • Code & samples126
  • Graph Resources52
  • Assets

    • Definition36
    • Tutorial113
    • How-to guide319
    • Reference312
    • Concept109
    • Troubleshooting12
    • Security advisory4
    • Runbook
    • Article173
    • Case study26
    • Talk298
    • Release note24
    • Demo114
    • Webinar12
    • Event12
    • Report24

    Tags

    • #Fraud and AML
    • #Entity resolution
    • #Recommendations
    • #GraphRAG and AI
    • #Graph machine learning
    • #Search
    • #Network analysis
    • #Performance and scale
    • #Running TigerGraph
    • #Evaluating graph
    Discover
    Case study2 min · Aug 2, 2021

    Wish.com Increases Revenues with Personalized Ecommerce Recommendations with TigerGraph

    Discover
    Tutorial46 min · Jul 30, 2021

    UCSD: TigerGraph 101 Part 1

    ➡️ Intro to Graph and TigerGraph. ➡️ Comparison to relational databases and when to use graph. Real world use cases. ➡️ Walkthrough of creating your first graph through Graph Studio. Take this short quiz to test your knowledge: https://d

    Discover
    Tutorial14 min · Jul 23, 2021

    Introduction to Plotly Dash using TigerGraph COVID-19 Starter Kit

    By Shreya Chaudhary, Developer Advocate Intern at TigerGraph Link to Colab to follow along (https://colab.research.google.com/drive/1ElzCA9BXJsNuJxn7yq7Mgfmvwtvf-lag?usp=sharing) Link to pyTigerGraph documentation (https://pytigergraph.git

    Discover
    Tutorial22 min · Jul 9, 2021

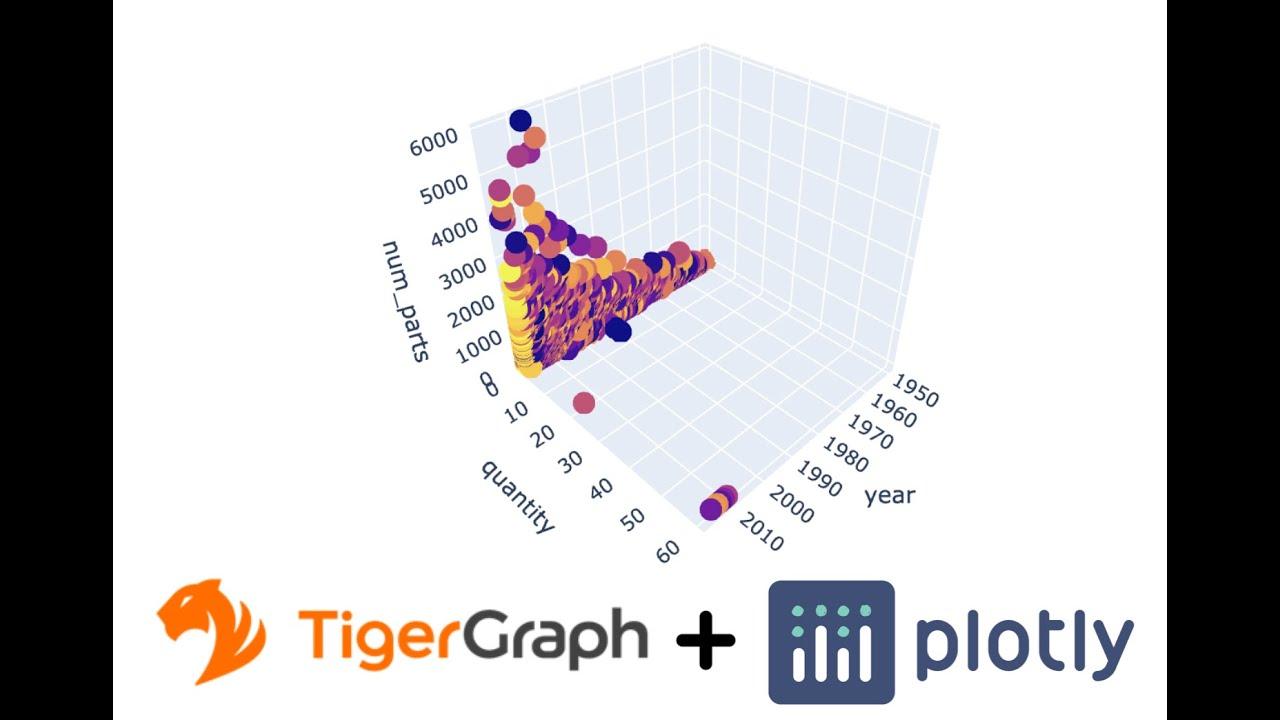
    Using Plotly to Visualize your TigerGraph Data

    By Shreya Chaudhary, Developer Advocate Intern at TigerGraph Link to Colab to follow along (https://colab.research.google.com/drive/13nSPlySH9deZs0mft7oikOSCuUo5RBI6?usp=sharing) Link to pyTigerGraph documentation (https://pytigergraph.git

    Discover
    Tutorial1h 0m · Jun 24, 2021

    Introduction to pyTigerGraph

    by Dan Barkus (https://www.linkedin.com/in/daniel-barkus-87ba2978/), Developer Advocate at TigerGraph Link to Notebook on Github (https://github.com/DanBarkus/TigerGraph-101) Link to Colab to follow along (https://colab.research.google.com

    Discover
    Case study2 min · May 18, 2021

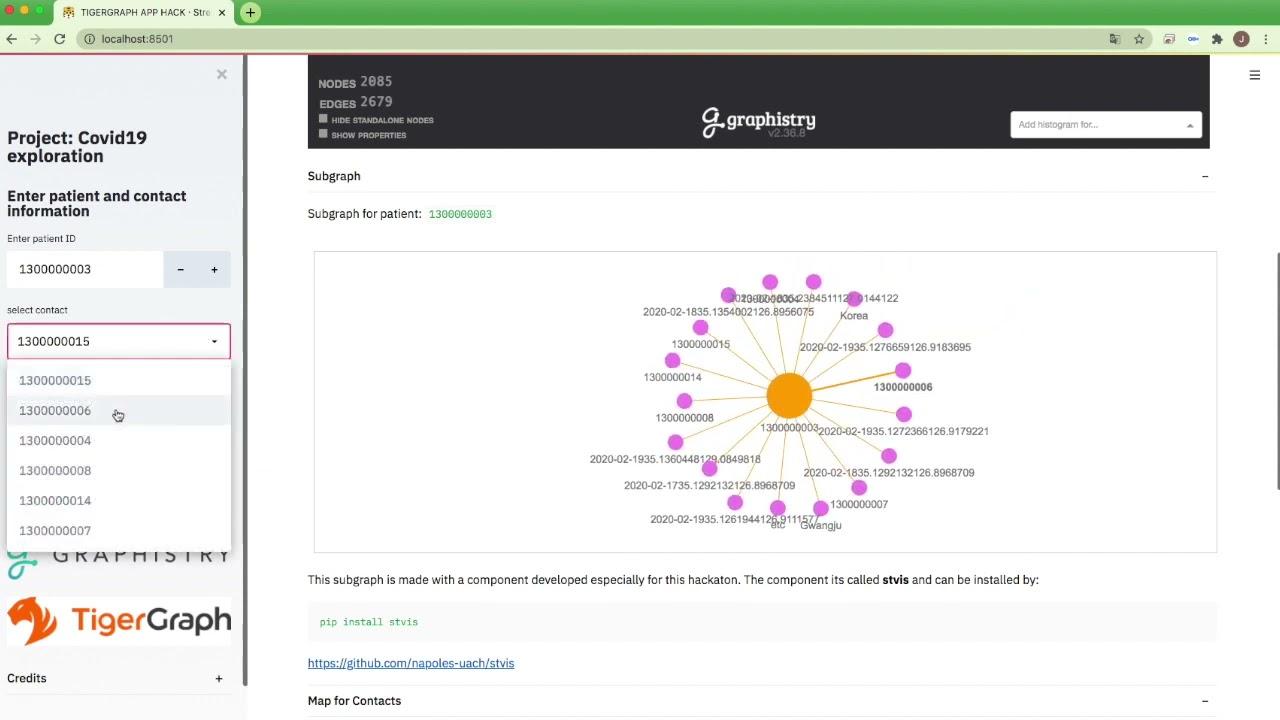
    COVID-19 Exploration

    by José Manuel Nápoles Duarte Winner: Best Streamlit App I have been somewhat related to the Covid 19 fight in the city of Chihuahua in México as a volunteer for the Health Services Department of Chihuahua regarding the geospatial distri

    Discover
    Case study4 min · May 18, 2021

    Easy Analysis Video

    by Abhay R Patel Winner: Best Design UX/UI App A Streamlit app that uses TigerGraph Cloud, data, queries and other custom data to analyse COVID-19 data and gain insights from the data.

    Discover
    Case study3 min · May 18, 2021

    DATALAND

    by Landry Fotso Best Documented App Since the beginning of the Covid19 and before, the repartition of medical devices in the world is unequal. In this project, I analysed the repartition of that equipment in all the counties to show thos

    Discover
    Tutorial11 min · May 18, 2021

    Temporal Analysis with Time Based Custom Metrics

    by Yusuf Canbaz Winner: Most Popular Time-based analysis by creating custom metrics (filters) using simple GSQL statements. Let's the user see the custom metrics and visualize the corresponding objects as a graph.

    Discover
    Tutorial4 min · Apr 14, 2021

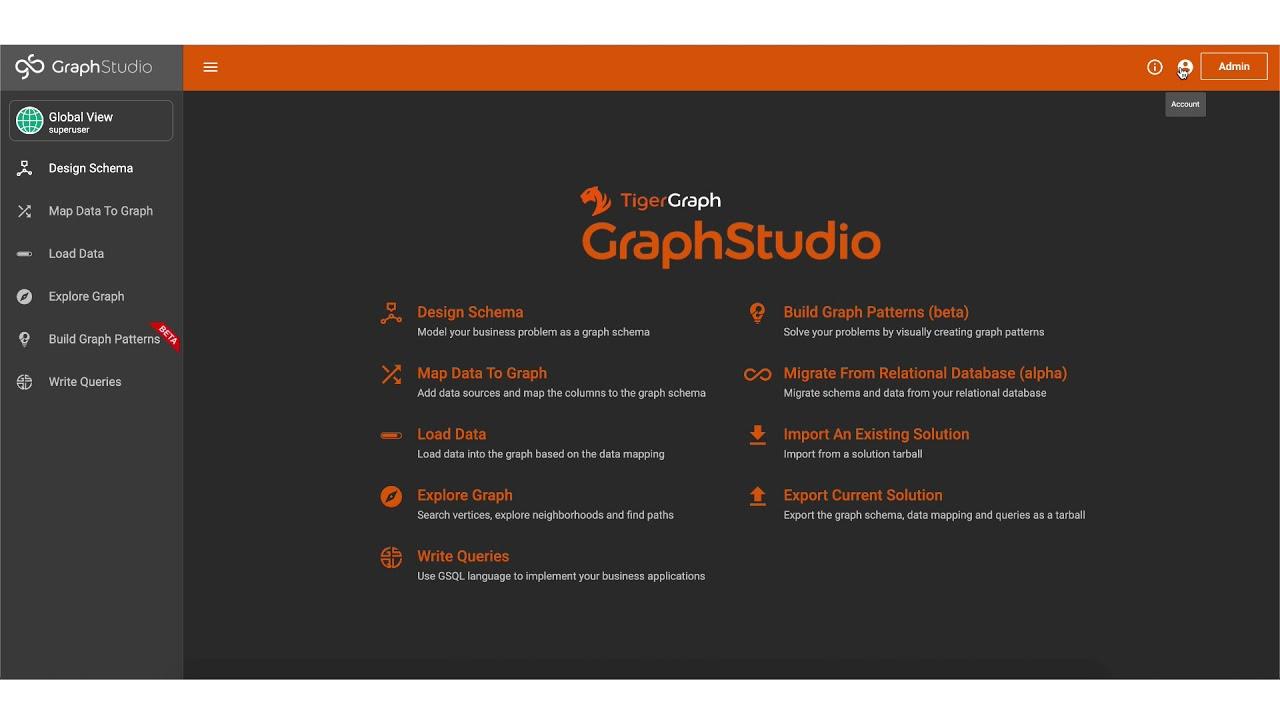
    Getting Started with TigerGraph Cloud (2021)

    An easy-to-use, cloud-based graph database built for agile teams Get started with TigerGraph Cloud and follow along here: https://www.tigergraph.com/cloud/ (free to start, no credit card required)

    Discover
    Tutorial1h 34m · Feb 24, 2021

    February 2021 Graph Gurus Workshop: Accelerating Machine Learning with Graph

    Today's analytical graph databases are taking organizations to another level by connecting their data, better-representing knowledge, and obtaining answers to deeper questions in real-time. These benefits extend to the world of machine lea

    Discover
    1…8910…47