TigerGraph
ResourcesPathfinderDiscord(opens in a new tab)
Resources

Everything, In One Wall

Videos, courses, hands-on tutorials, docs, and blog posts. One place for every phase of learning.

TigerGraph
ResourcesPathfinderDiscord(opens in a new tab)

© 2026 Tiger Graph Dev Hub. All rights reserved.

  • Privacy Policy|
  • Terms of Service

Applied · 4

Clear all
  • Reference
  • Tutorial
  • Talk
  • Case study

Levels

  • All Resources
  • Beginner
  • Intermediate
  • Advanced

Categories

  • Videos514
  • Docs644

749 resources · page 20 of 63

NewestOldest
3 Col Grid2 Col GridList
Talk40 min · Jun 28, 2021

Smarter AI mit Graph Analytics: Beispiele aus den Bereichen Supply Chain und Finanzen

ScaleUp 360° AI in Business Summit | June 16, 2021 Presenter: Mario Werner, Regional Manager DACH, TigerGraph Bruno Simic, Senior Solutions Engineer, TigerGraph
Glossary
50
  • Blog posts222
  • Code & samples126
  • Graph Resources52
  • Assets

    • Definition36
    • Tutorial113
    • How-to guide319
    • Reference312
    • Concept109
    • Troubleshooting12
    • Security advisory4
    • Runbook
    • Article173
    • Case study26
    • Talk298
    • Release note24
    • Demo114
    • Webinar12
    • Event12
    • Report24

    Tags

    • #Fraud and AML
    • #Entity resolution
    • #Recommendations
    • #GraphRAG and AI
    • #Graph machine learning
    • #Search
    • #Network analysis
    • #Performance and scale
    • #Running TigerGraph
    • #Evaluating graph
    Discover
    Tutorial1h 0m · Jun 24, 2021

    Introduction to pyTigerGraph

    by Dan Barkus (https://www.linkedin.com/in/daniel-barkus-87ba2978/), Developer Advocate at TigerGraph Link to Notebook on Github (https://github.com/DanBarkus/TigerGraph-101) Link to Colab to follow along (https://colab.research.google.com

    Discover
    Talk59 min · Jun 23, 2021

    Graph Gurus 53: Visual Insights with Graph Analytics - Tableau and TigerGraph

    Business intelligence (BI) tools like Tableau enable anyone to rapidly and visually see and dive into how their enterprises are performing. Visual, interactive dashboards and reports pull and join data from tabular sources. Graph database

    Discover
    Talk46 min · Jun 17, 2021

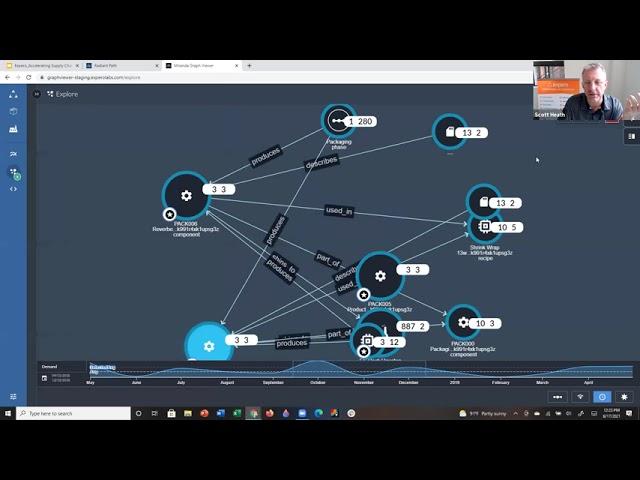
    PartnerGraph Webinar - Expero - Accelerating Supply Chain Optimization

    Accelerating Supply Chain Optimization with Machine Learning, Graph Analytics and Visualization Recorded June 17, 2021 Supply chains have evolved significantly for manufacturers in all industries, and especially automotive, pharma, retail

    Discover
    Talk43 min · Jun 15, 2021

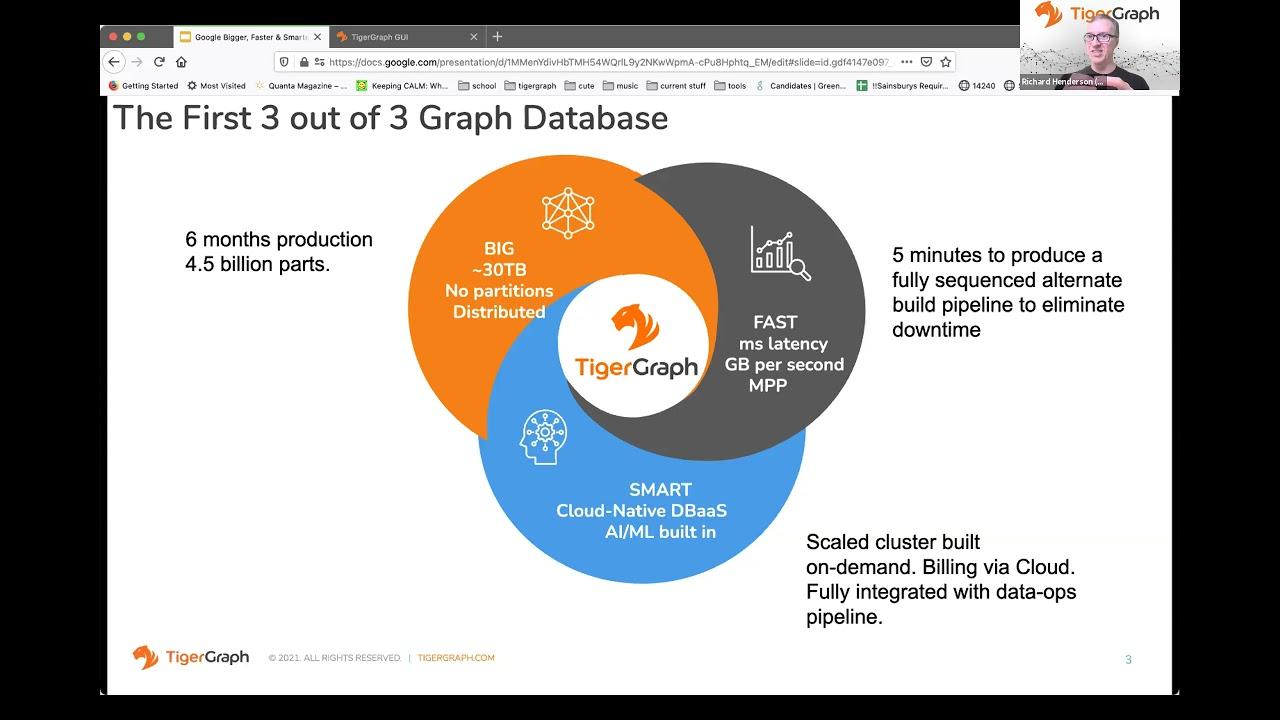
    Ai, Data Analytics& Insights Summit | North Europe

    Presenter: Richard Henderson, TigerGraph EMEA Technical Director Richard has been an independent data system designer for over thirty years, consulting to most major industries including FIS, banking, retail and manufacturing. For the las

    Discover
    Talk53 min · Jun 10, 2021

    PartnerGraph Webinar - Accenture - Combating Financial Crime with Graph Analytics

    Combating fraud and meeting regulatory requirements for AML demand smarter, faster, and more dynamic tools and solutions. Legacy rules-based systems have limited the efficacy of anti-money laundering detection and investigation—hidden finan

    Discover
    Talk46 min · Jun 3, 2021

    Graph Gurus 52: Expand the Data Analytics Capabilities of Snowflake with TigerGraph

    Snowflake is a leading cloud-native data warehousing solution. With its fully automated technology, Snowflake users are able to focus on getting the most impactful data insights to power business decisions. TigerGraph has been powering adva

    Discover
    Talk1 min · May 26, 2021

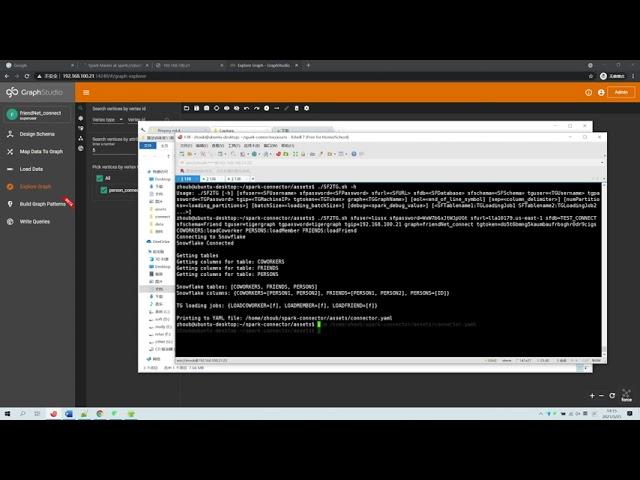
    TigerGraph Snowflake Connector

    TigerGraph and Snowflake are a powerful combination as illustrated by the two of Gartner’s Top Ten Trends in Data and Analytics from recent years (Cloud-based Data Warehouse and Graph Database Analytics). TigerGraph-Snowflake connector stre

    Discover
    Talk46 min · May 19, 2021

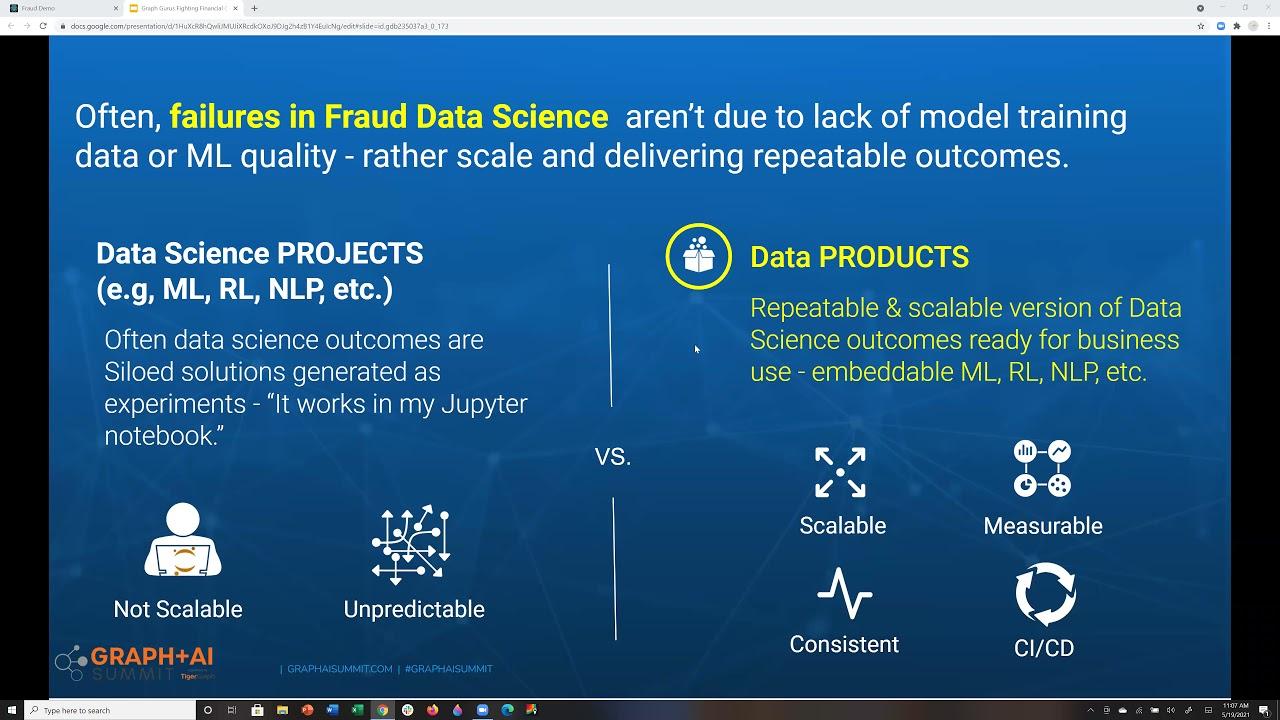
    Graph Gurus 51: Fighting Financial Crimes With Graph Analytics: A Deep Dive

    A surge in financial crime has increased the focus and scrutiny on the automated identification of fraud patterns and real-time alert identification. Join us as we dive deep into maximizing machine learning processes by incorporating graph

    Discover
    Talk5 min · May 18, 2021

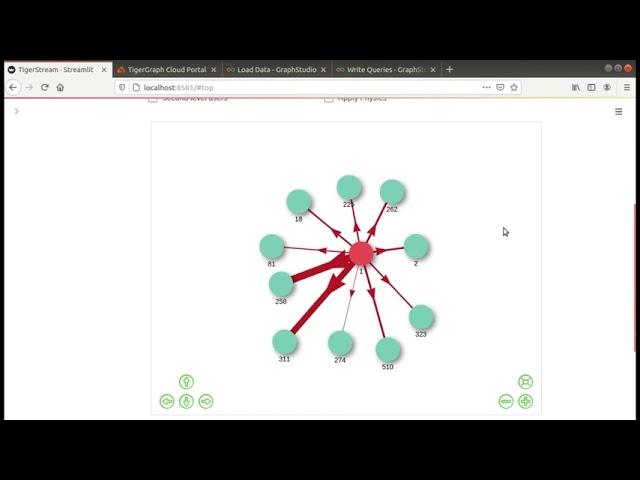
    TigerStream: TigerGraph Web App made with Streamlit

    by Kaushal Chapaneri Winner: 2nd Place Graph database transforms a complex web of dynamic data into meaningful relationships to help deliver real-time insight and action. This hackathon inspired me to explore TigerGraph and develop inter

    Discover
    Case study2 min · May 18, 2021

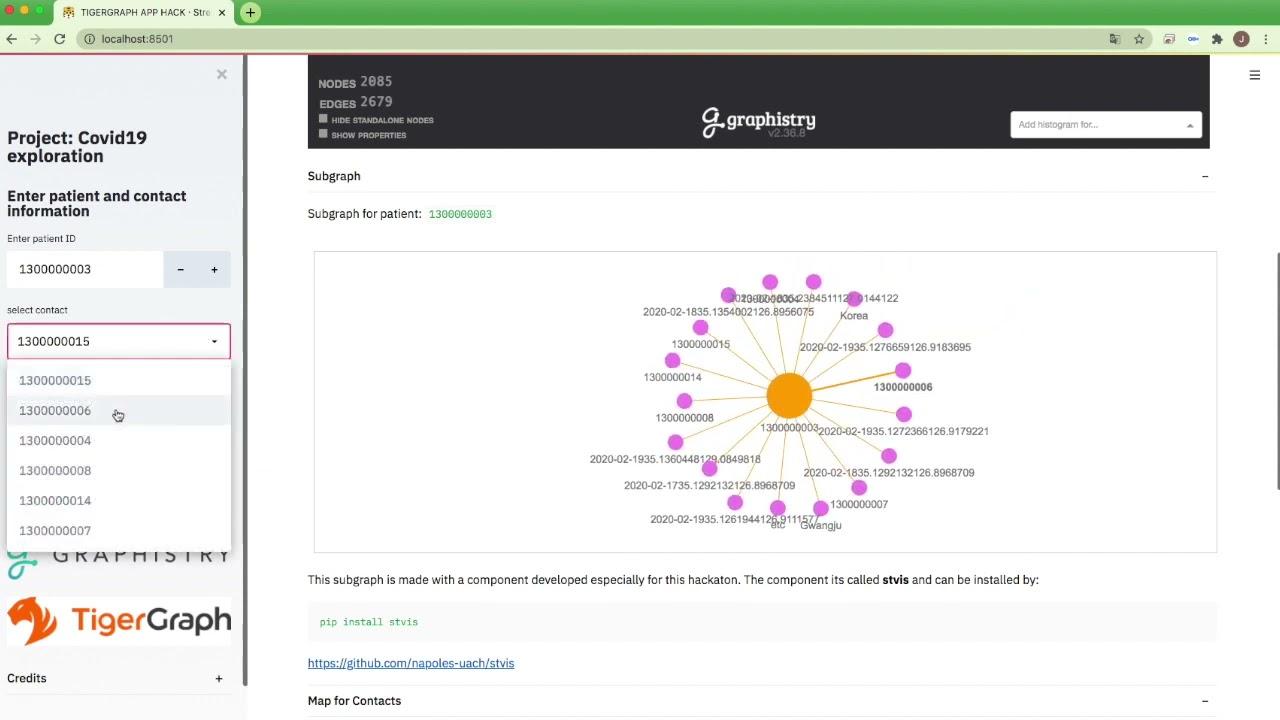
    COVID-19 Exploration

    by José Manuel Nápoles Duarte Winner: Best Streamlit App I have been somewhat related to the Covid 19 fight in the city of Chihuahua in México as a volunteer for the Health Services Department of Chihuahua regarding the geospatial distri

    Discover
    Case study4 min · May 18, 2021

    Easy Analysis Video

    by Abhay R Patel Winner: Best Design UX/UI App A Streamlit app that uses TigerGraph Cloud, data, queries and other custom data to analyse COVID-19 data and gain insights from the data.

    Discover
    1…192021…63