Tutorial22 min ·
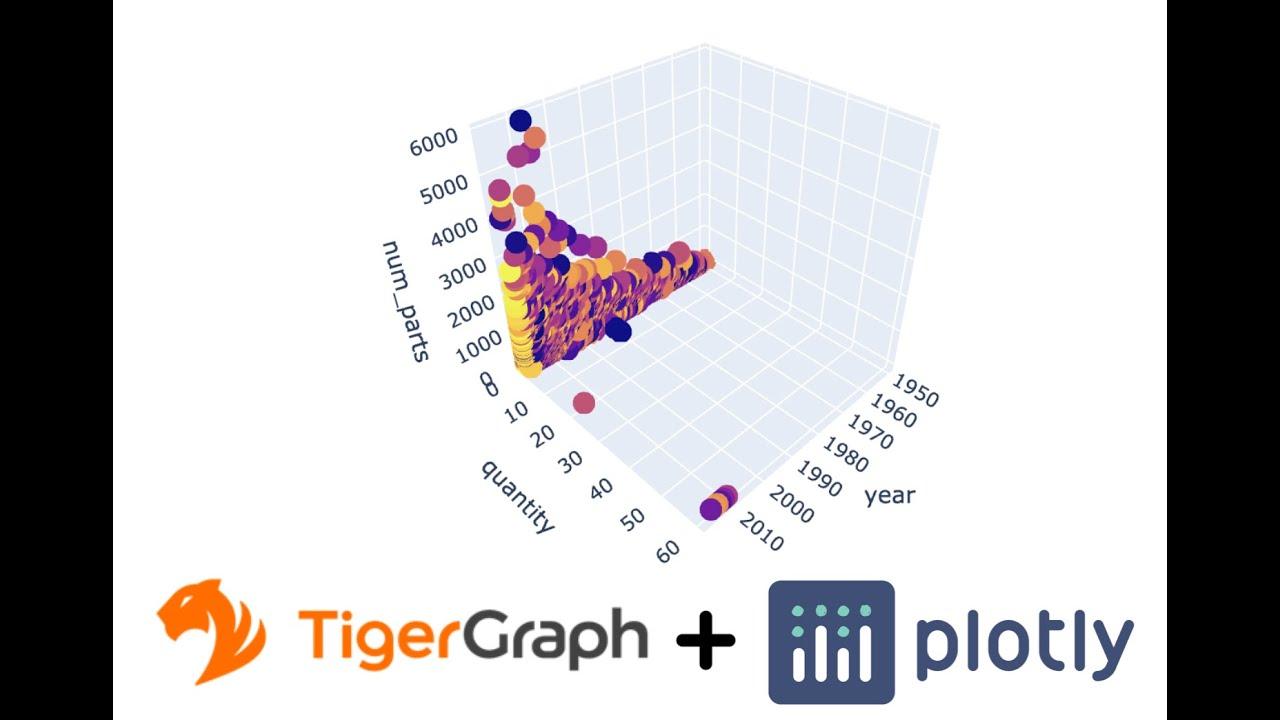
Using Plotly to Visualize your TigerGraph Data
By Shreya Chaudhary, Developer Advocate Intern at TigerGraph Link to Colab to follow along (https://colab.research.google.com/drive/13nSPlySH9deZs0mft7oikOSCuUo5RBI6?usp=sharing) Link to pyTigerGraph documentation (https://pytigergraph.git