Explore Graph
After data has been loaded, the Explore Graph page allows you to explore and analyze the graph using an interactive graph visualization.
Explore Graph is available in two interfaces:
Classic Explore Graph
You can use Classic Explore Graph to perform the following operations:
The Graph Exploration panel also provides you with many ways to modify and augment the visualization of your exploration results, as well as the ability to add vertices and edges to the graph:
Page layout
The Explore Graph page is vertically divided into three parts, from left to right:
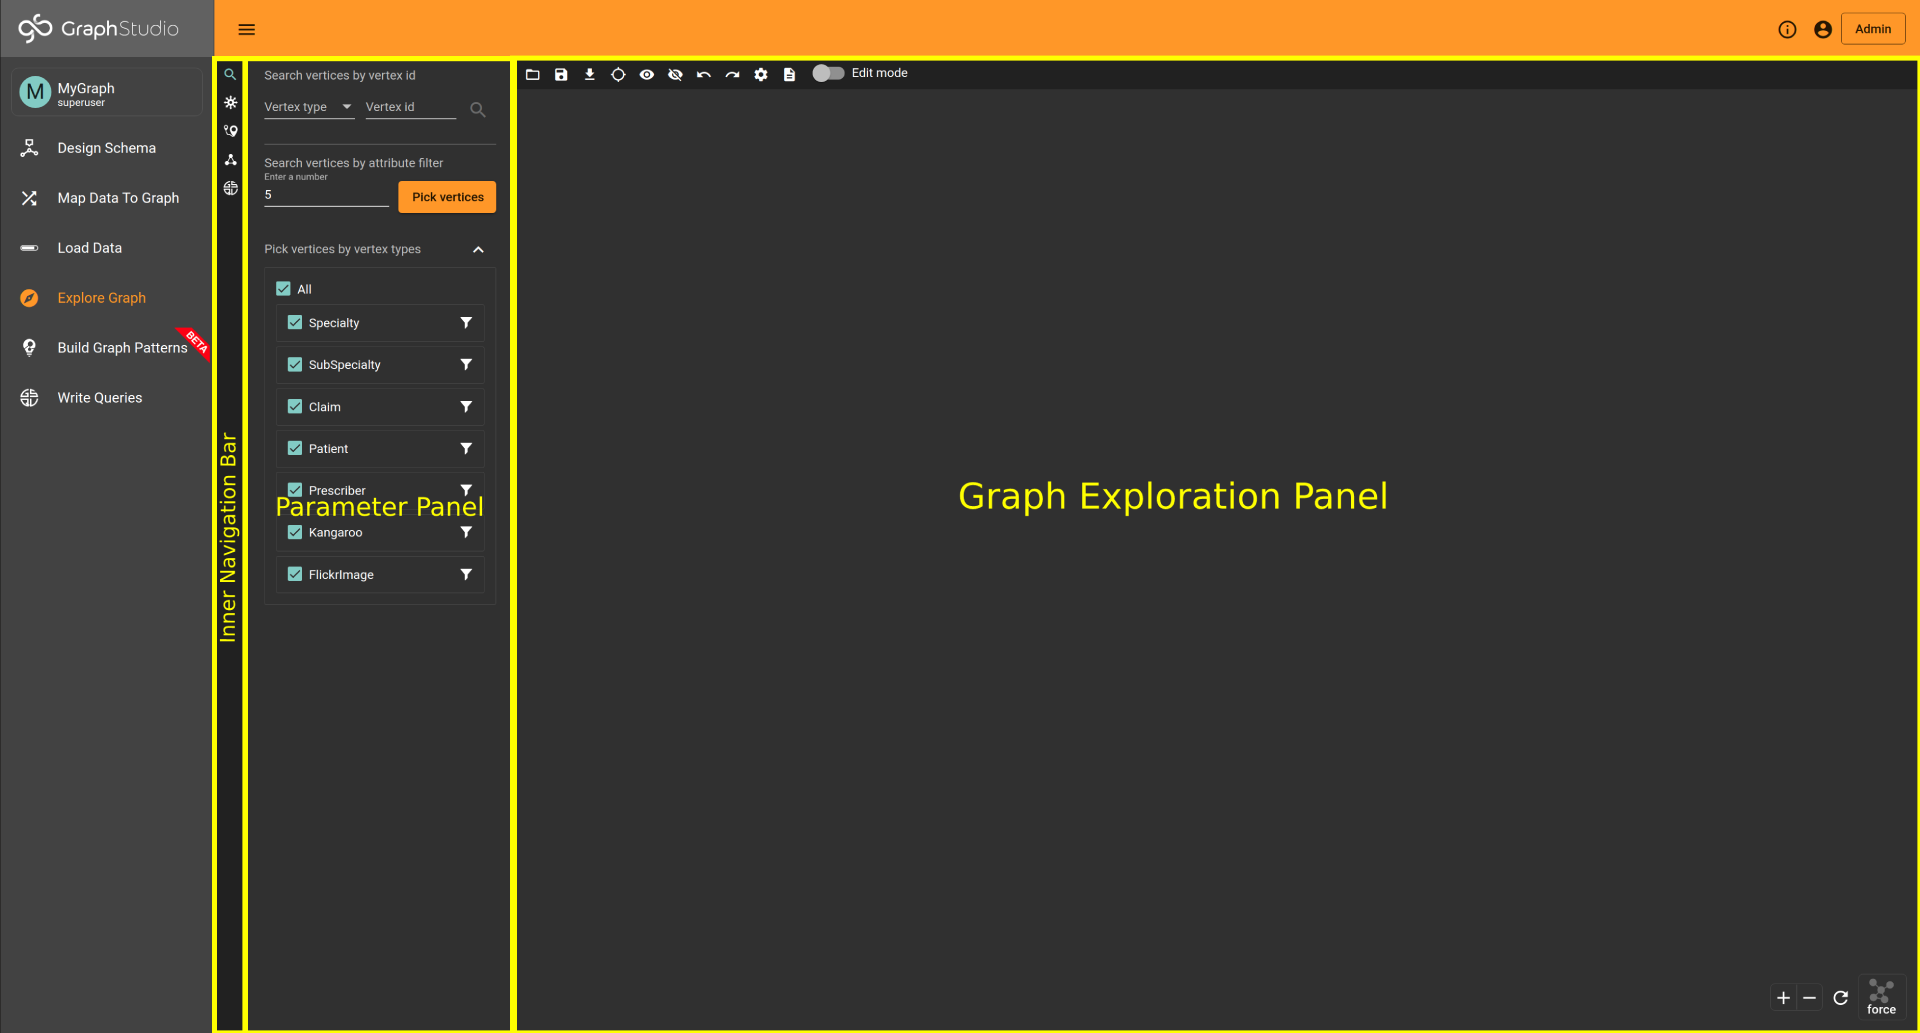
The Inner Navigation Bar
The menu options, from top to bottom, are the following:
| Menu option | Functionality |
|---|---|
|
Search vertices: select specific vertices with conditions. |
|
Expand from vertices: find neighborhood of the specified vertices. |
|
Find paths: find paths between the selected source vertex and target vertex. |
|
Find connections: find connecting paths between a set of vertices. |
|
Run queries: run installed GSQL queries. |


%20(3).png)
.png)
The Parameter Panel
Set filters, conditions, and other parameters for the selected option from the Inner Navigation Bar.
The Graph Exploration Panel
The exploration result is displayed in this panel. Below is an example of an exploration result:
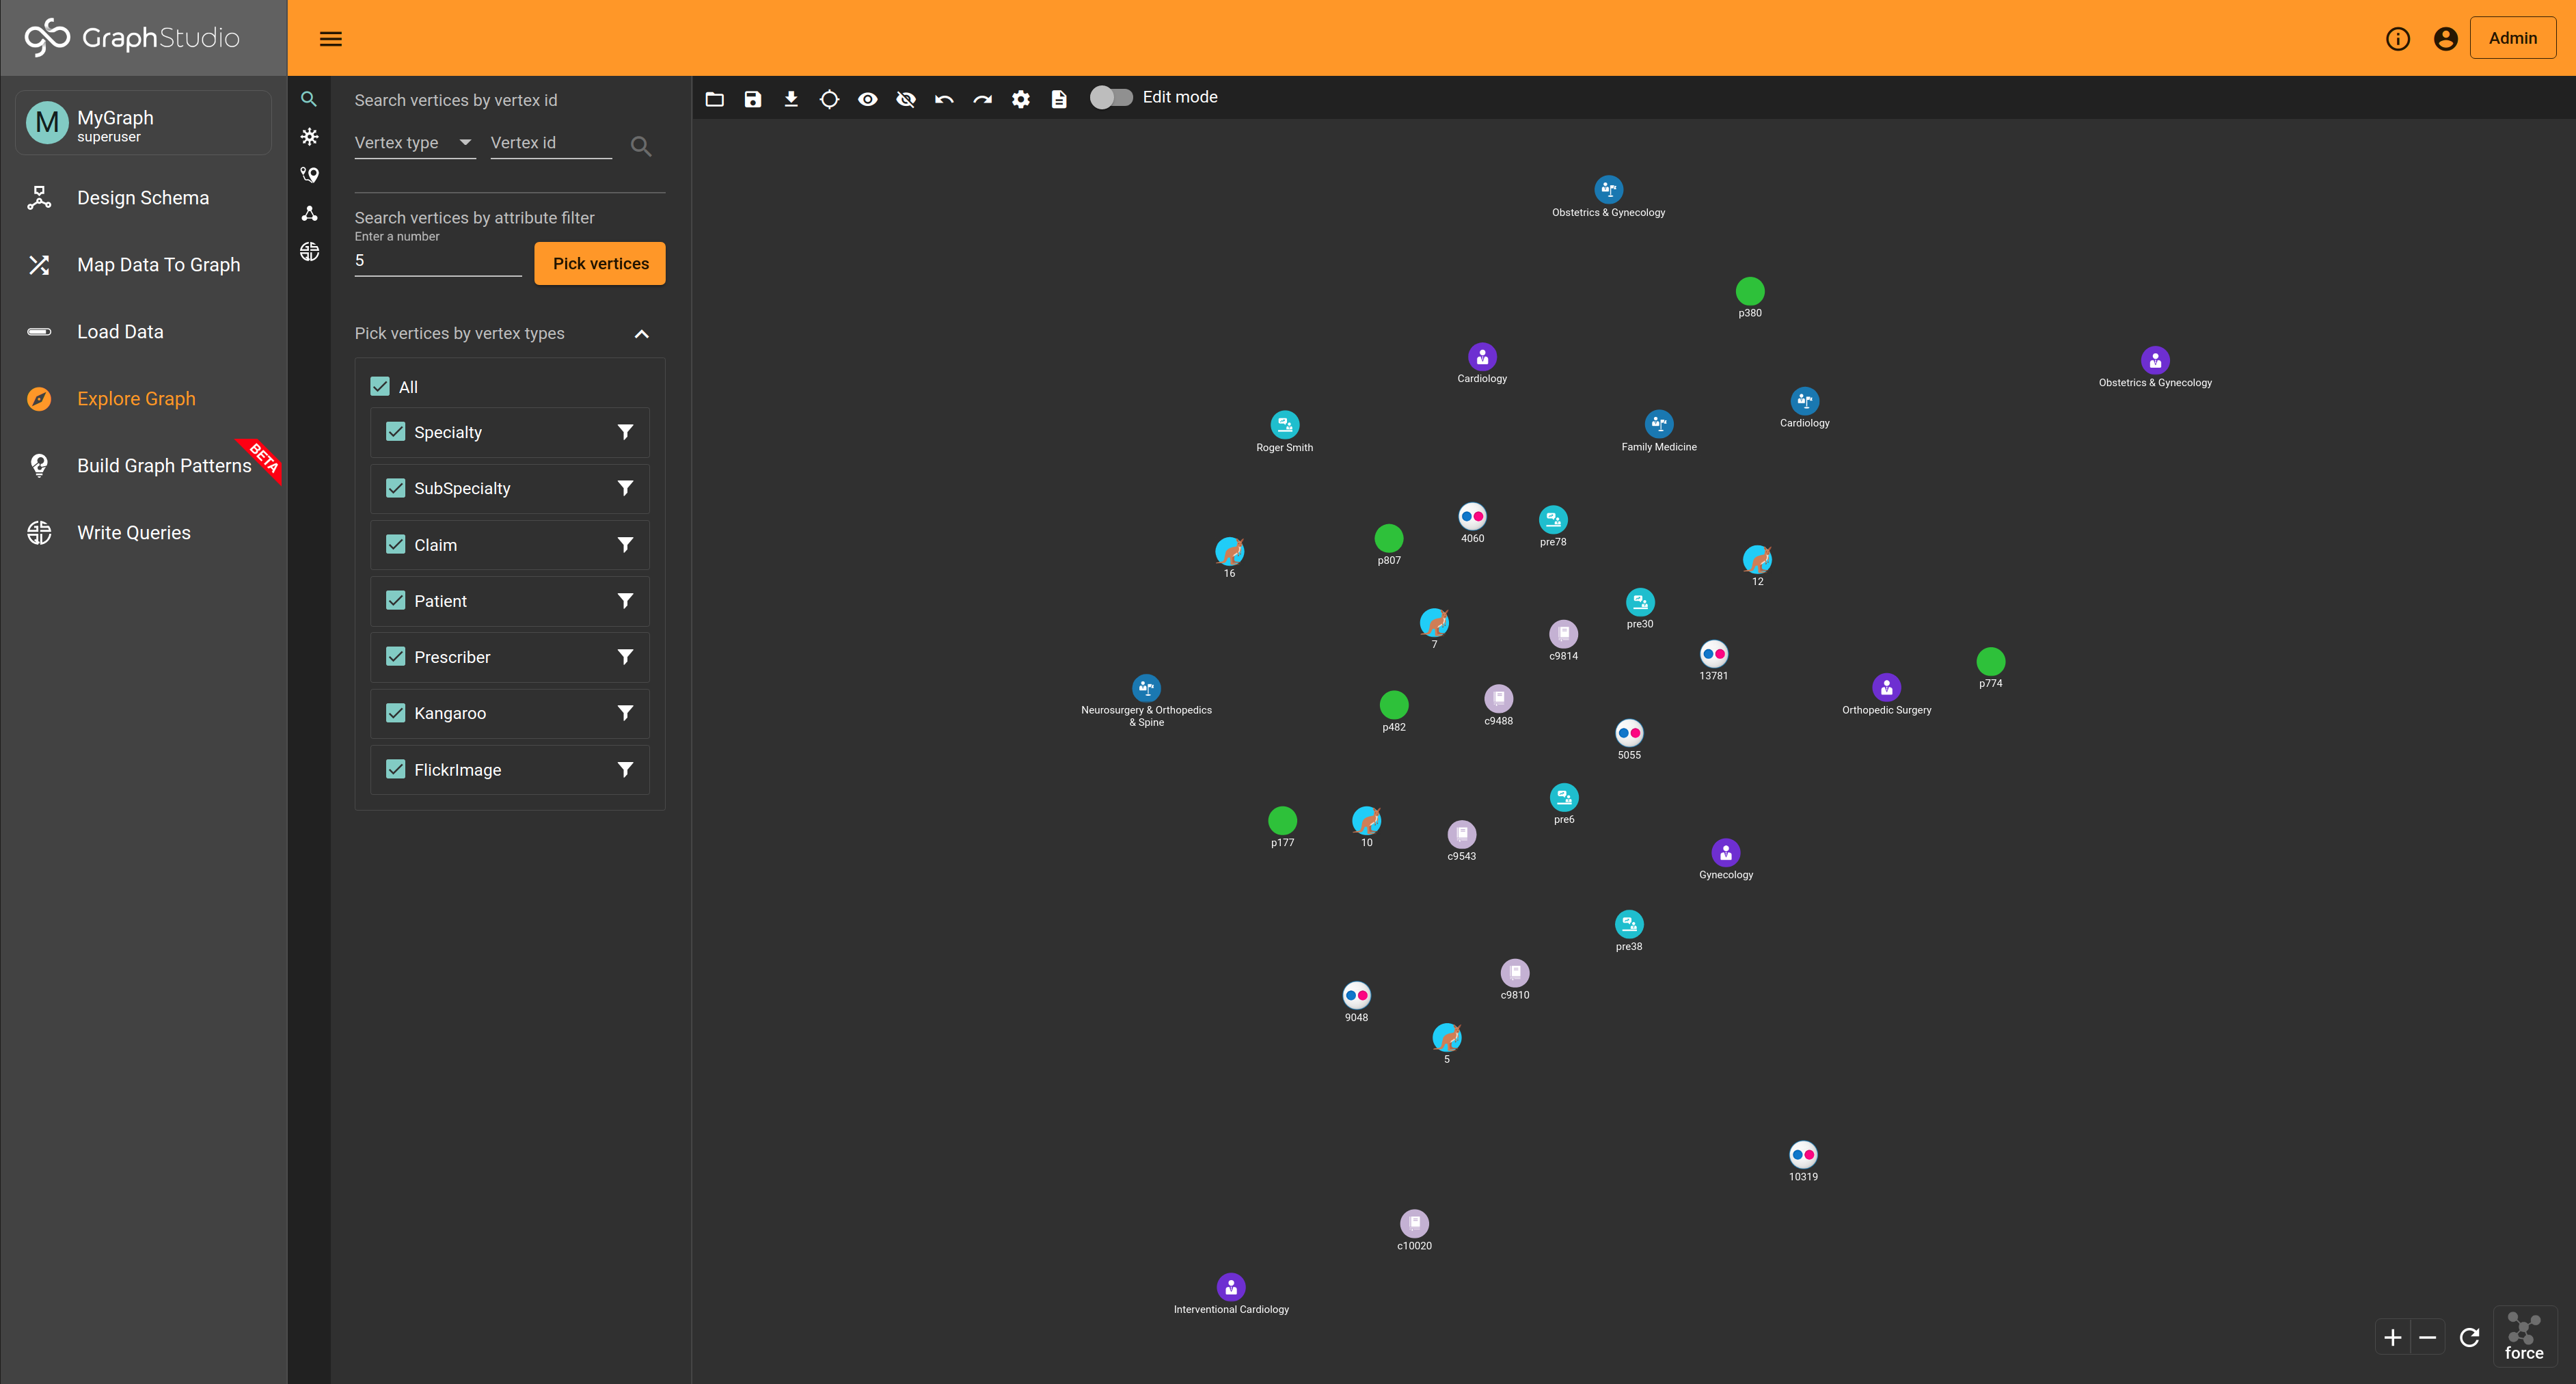
You can adjust the results display, take a snapshot of the display, and modify selected data objects in the result.

The menu buttons, from left to right, are the following:
-
Open exploration history: Open a previously saved graph exploration result.
-
Save exploration: Save the current visualization result.
|
After saving an exploration result, modifying the graph schema will cause the saved result to be obsolete. You will not be able to open an obsolete saved result. |
-
Export: Export the current visualization result as a png file or a zip file containing .csv files.
-
Locate vertices in result: Search the exploration result by vertex id or attribute value.
-
Only show selections: First select one or more objects. Clicking the button will hide all the objects which are not selected.
-
Hide: First select one or more objects. Clicking the button will hide the selected vertices and edges (or all if none is selected).
-
Undo: Undo the last change to the visualization result set (that is, changes to which objects are included in the result set).
-
Redo: Redo the most recent undone change to the visualization result set (that is, changes to which objects are included in the result set).
|
Database changes (adding or deleting vertices/edges, editing attributes) cannot be undone with the Undo feature. |
-
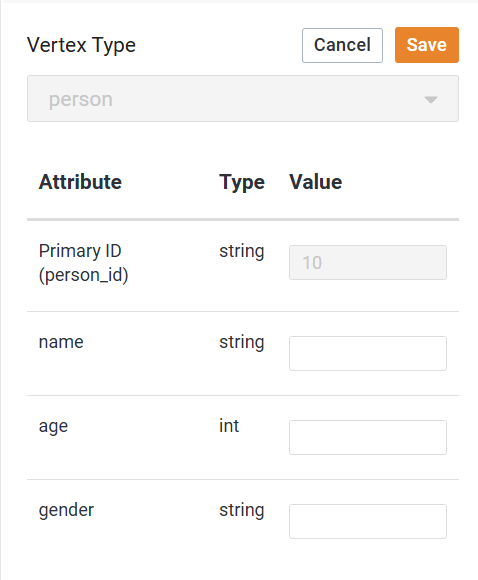
Add new vertex: Add a new vertex into the visualization result as well as to the graph database.
-
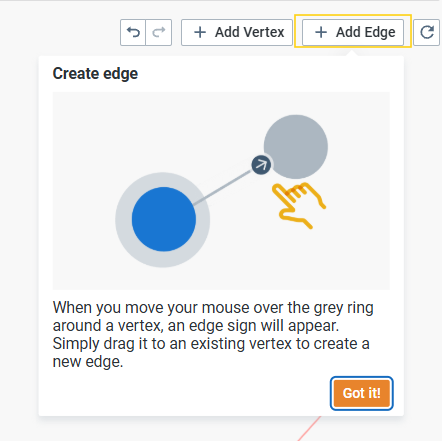
Add new edge: Add a new edge into the visualization result as well as to the graph database.
-
Edit attributes: Change the attributes of the selected object in the visualization result as well as the graph database.
-
Delete selected elements: Delete the selected elements from the visualization result as well as the graph database.
-
Change settings: Select which attribute values to display with each vertex or edge type. Enable/disable popup display of all attributes when the cursor hovers over a vertex or edge.
The Parameter Panel can be hidden by clicking its corresponding button in the Explore Graph Menu.
New Explore Graph
Click Try Now on the Classic Explore Graph banner to experience the New Explore Graph.
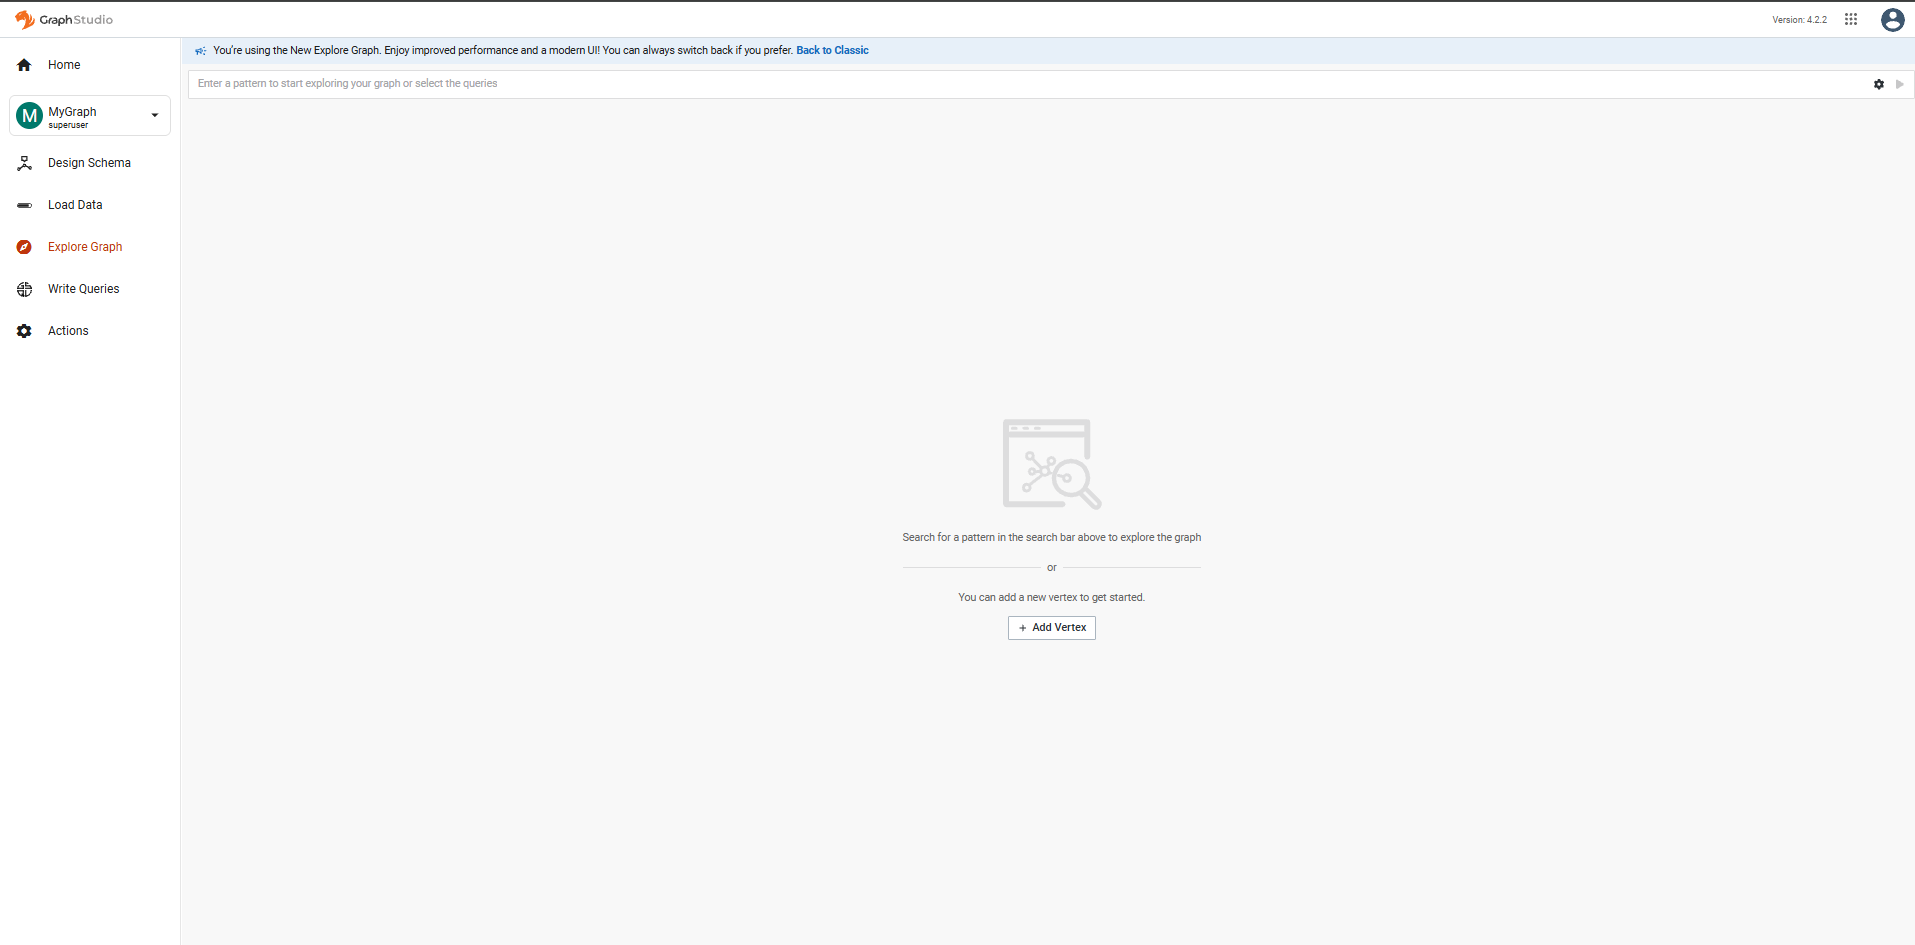
The New Explore Graph provides a redesigned interface for exploring and analyzing graph data.
The new interface provides a pattern search bar and an + Add Vertex button to start an exploration.
The pattern search, graph canvas, filtering mechanism, canvas controls, and graph algorithms in the New Explore Graph are shared with the Insights graph widget. For details on how pattern search works, how filters apply, canvas controls, and supported algorithms, see Graph Widget.
Pattern Search and Graph Visualization
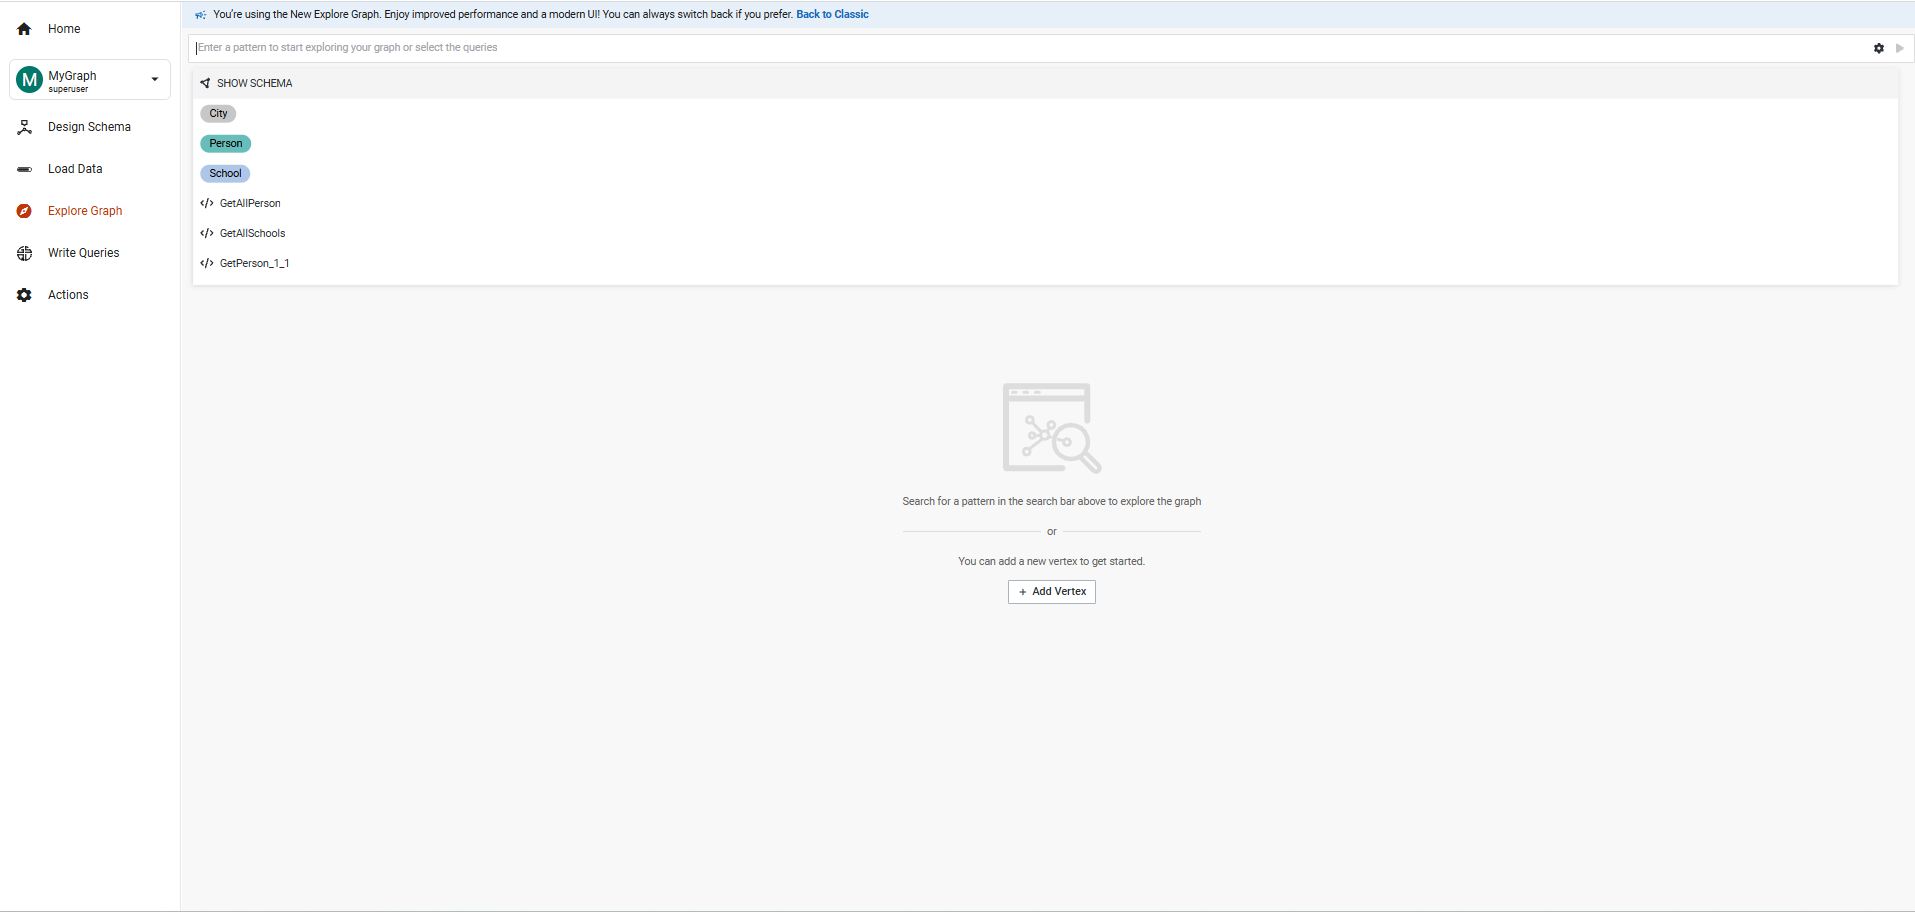
Use the pattern search bar to explore the graph. Matching vertices and edges are displayed on the canvas.
Result Panel
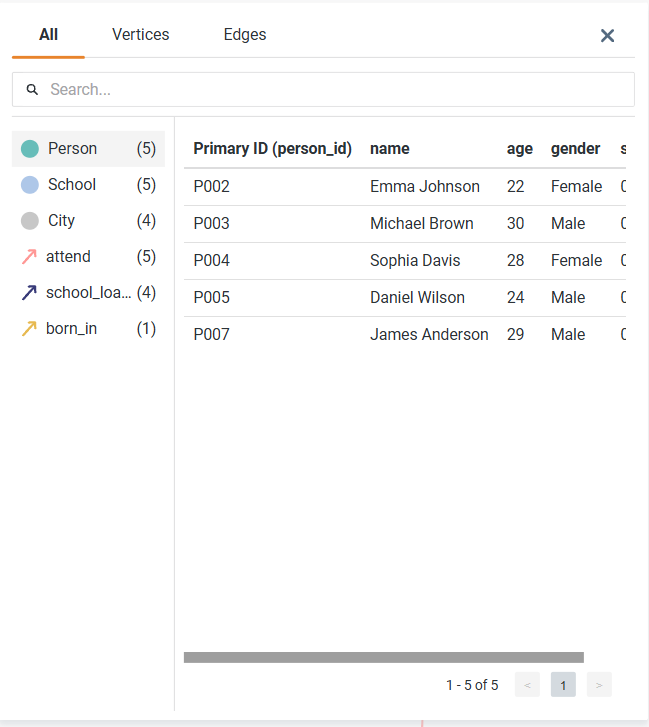
Click the  button to open the Result panel.
The Result panel displays the exploration results in a table, with
three views:
button to open the Result panel.
The Result panel displays the exploration results in a table, with
three views:
-
All — Displays all objects in the exploration result.
-
Vertices — Displays the vertices in the exploration result.
-
Edges — Displays the edges in the exploration result.
Filters Panel
Click the  button to open the Filters panel.
The Filters panel displays the distribution of attribute values and
the number of filters currently applied.
button to open the Filters panel.
The Filters panel displays the distribution of attribute values and
the number of filters currently applied.

Query Configuration
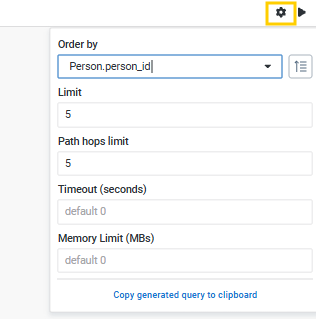
Use Query Configuration to control how graph exploration results are returned.
The available options include:
-
Order by
-
Limit
-
Path hops
-
Timeout
-
Memory limit
Graph Analytics
|
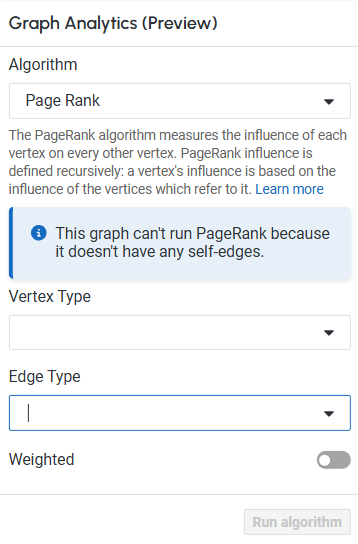
Graph Analytics is a Preview feature and may change in future releases. |
Select an algorithm, such as PageRank, and configure the required parameters before running it.
Graph Configuration
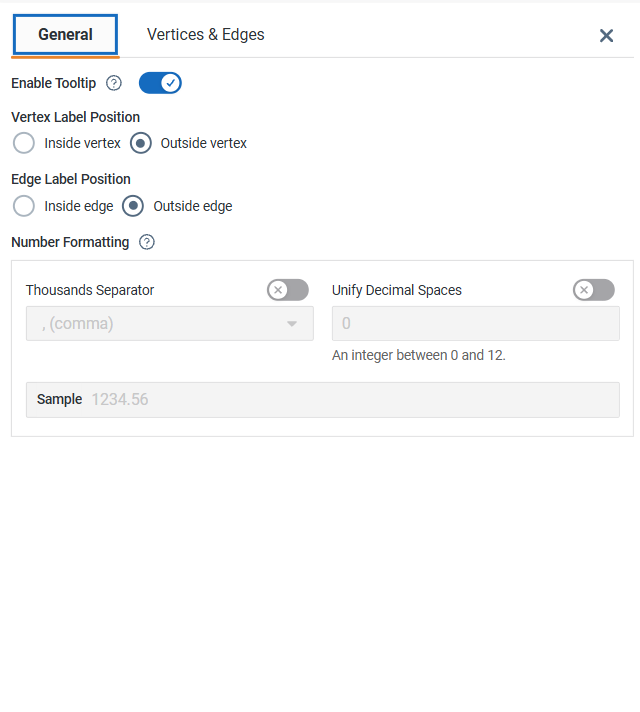
Use Graph Configuration to customize the appearance of the graph.
Click the  button to open the Graph configuration.
The General tab provides settings for the graph visualization, such
as tooltip display, label positions, and number formatting.
button to open the Graph configuration.
The General tab provides settings for the graph visualization, such
as tooltip display, label positions, and number formatting.
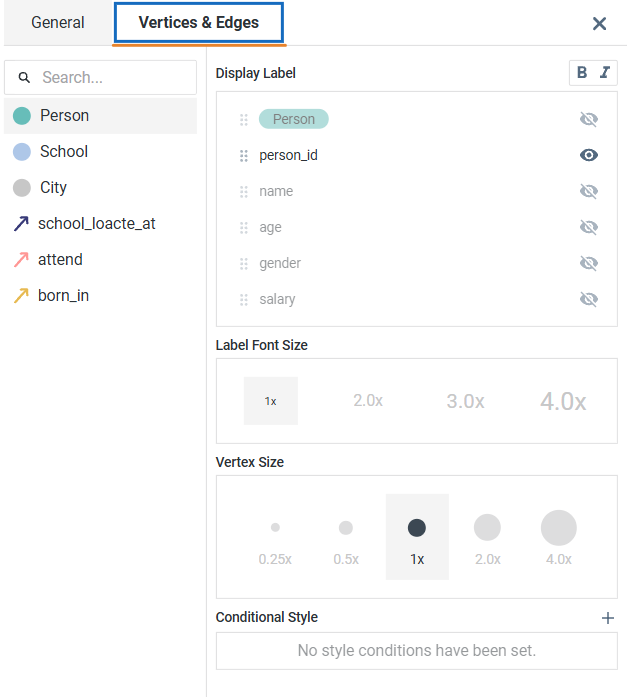
The Vertices & Edges tab allows you to configure styles for individual vertex and edge types.
You can also define conditional styles for graph objects.