Contact Us
A soft blue gradient background with areas of darker blue and black blur, fading into white at the bottom. No clear objects or shapes are distinguishable.

Enterprise AI Has a Proof Problem

Fraud Detection Entity Resolution Anti-Money
Laundering (AML)
Product
Recommendations
Customer 360 Supply Chain
Management
Cybersecurity
Threat Detection
Financial Crime

TigerGraph is the relationship intelligence and control layer for enterprise AI—connecting every AI decision to governed, real-time evidence so agents can reason, act, and be audited with confidence. Built for fraud, AML/KYC, identity, customer intelligence, and AI systems operating in regulated environments at enterprise scale.

A flow diagram shows four blue boxes with white text: 300% faster fraud investigations, 3X increase in identity resolution rates, 5X improvement in speed by shopper, and 26% reduction in customer churn. A womans photo is above the third box.

Trusted by global enterprises

Jaguar white logo
JP Morgan Chase logo
INTUIT white logo
AT&T white logo
Ford white logo
xbox logo
American Express white logo
Deloitte white logo
nike logo
KPMG white logo
Nice Actimize logo
Mastercard white logo
Helwett Packard white logo
Jaguar white logo
JP Morgan Chase logo
INTUIT white logo
AT&T white logo
Ford white logo
xbox logo
American Express white logo
Deloitte white logo
nike logo
KPMG white logo
Nice Actimize logo
Mastercard white logo
Helwett Packard white logo

AI Doesn’t Fail. Your Context Does.

Most systems store data. TigerGraph understands relationships. TigerGraph connects people, accounts, devices, merchants, policies, products, transactions, and events so AI can reason over connected reality, not isolated records. Because enterprise decisions are only as good as the relationships behind them.
A simple black and white rocket icon with blue lines beneath it, representing thrust or movement upward.

1000x

Faster. Relationship Intelligence at Operational Speed.
A black magnifying glass with a blue lightning bolt symbol inside the lens, set against a light gray background.

<100ms

Deterministic multi-hop reasoning across billions of relationships—in milliseconds.
A black circular design with eight small black circles evenly spaced around its outer edge, resembling a simplified network or gear. The design is outlined with a light blue glow.

Petabyte

Enterprise-scale relationship intelligence with no trade-offs.

Retrieval Is Not Understanding.

Enterprises do not fail because they lack data. They fail because their AI cannot understand the relationships inside it.

TigerGraph reveals why something happened, what is connected, what changes next, and whether AI has enough evidence to act.

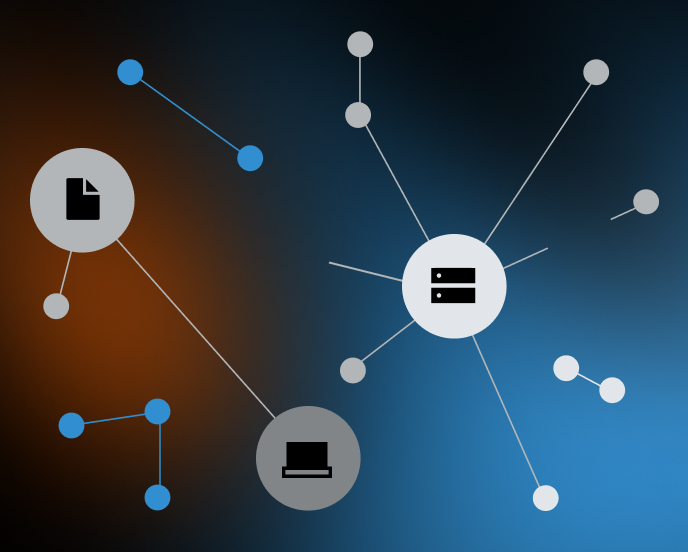
A network diagram with connected nodes. Large gray circles with icons for a document, computer, and server are linked to smaller blue and gray circles, representing data or device connections on a dark gradient background.
Before
without

Flat Data Leaves AI Blind

Rows, documents, and vectors can show fragments. They cannot explain the network behind a decision. Traditional systems break context apart across tables, queries, and disconnected systems — limiting AI to shallow understanding and incomplete reasoning.
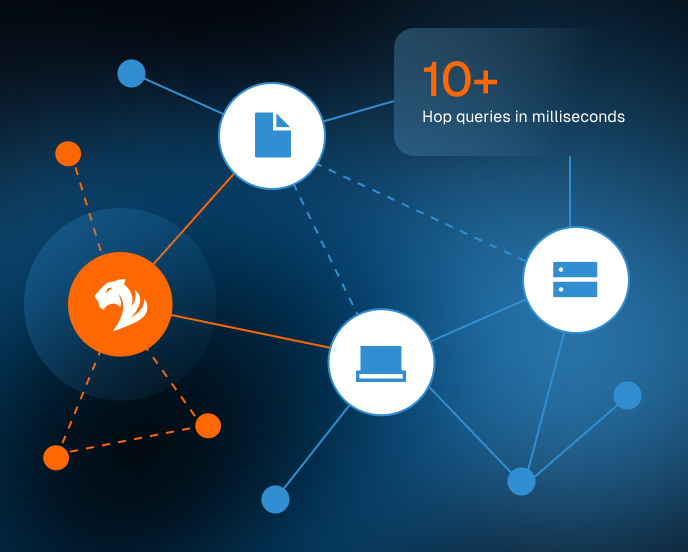
A network diagram with nodes showing a bird logo, document, computer, and server, connected by dotted and solid lines. Text reads 10+ Hop queries in milliseconds on a dark blue background.
Connected Reality
with

Relationship Intelligence for Enterprise AI

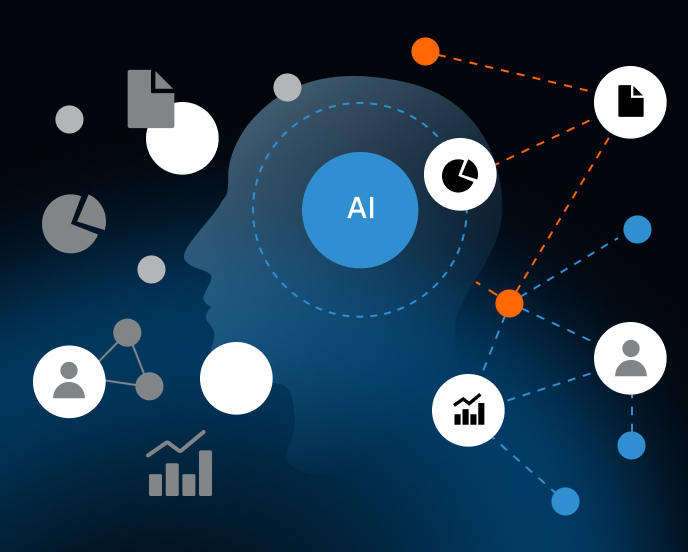
TigerGraph gives AI the relationship context, provenance, and policy-aware control required for provable enterprise decisions. Multi-hop reasoning across connected data reveals hidden fraud rings, supply chain dependencies, customer behaviors, and operational risk patterns in real time.

Abstract illustration featuring a human profile silhouette with a central “AI” label, surrounded by icons representing data, analytics, documents, and network connections on a dark background.
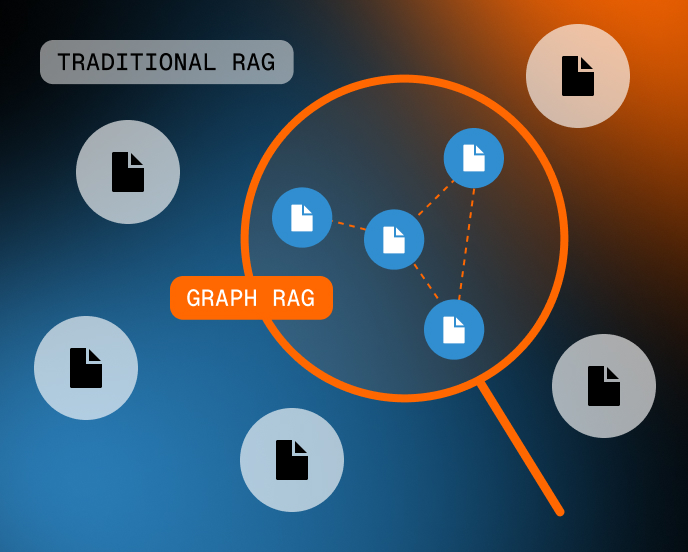
GraphRAG Is Not Retrieval. It Is Surgical Context.
with

Make Enterprise AI Explainable, Accurate, and Defensible

TigerGraph grounds every AI decision in verified relationships, reducing hallucinations, improving accuracy, and making every answer traceable to connected enterprise evidence.

Diagram comparing Traditional RAG and Graph RAG, showing isolated document icons for traditional RAG and connected document icons within a magnifying glass for Graph RAG.
Provable AI. Not Just Probable.
with

Enterprise AI Needs More Than Retrieval. It Needs Proof.

Traditional RAG retrieves documents. TigerGraph retrieves deterministic relationship evidence, not probabilistic document fragments, so AI can produce decisions enterprises can explain, audit, and defend.

A dark background with two blurred streaks: one orange and glowing near the bottom right, and one faint blue near the top. The image has an abstract, out-of-focus appearance.

The Relationship Intelligence and Control Layer for Provable AI

TigerGraph powers AI systems that need speed, scale, explainability, governance, and real-time action. From fraud prevention and AML to customer intelligence and autonomous AI systems, TigerGraph enables AI to reason over connected enterprise reality at enterprise scale.
Simple blue rocket icon with a circular window, pointing upward, on a light gray background.

The model predicts. TigerGraph proves.

TigerGraph models enterprise reality as connected systems of relationships — people, identities, accounts, devices, products, policies, transactions, and events. This relationship-first architecture enables AI systems to reason with full context instead of isolated records — producing faster decisions, deeper intelligence, and more explainable, defensible outcomes.
A blue circular arrow surrounding a lightning bolt icon, representing a concept of energy, power, or recharge.

Real-Time Relationship Intelligence at Enterprise Scale

Native massively parallel architecture enables deterministic multi-hop reasoning across billions of relationships in milliseconds — powering AI systems that must operate in real time.
Simple blue outline of a human brain, viewed from above, with a vertical line down the center dividing the two hemispheres.

Designed for AI That Needs Connected Reality

The relationship foundation behind explainable AI, GraphRAG, agentic systems, and governed AI decisions. TigerGraph preserves relationship context to reduce hallucinations, improve accuracy, and make AI outputs explainable.
A blue shield outline with a padlock symbol in the center, representing security or protection.

Governed AI by Design. Provable by Architecture.

ACID compliance, fine-grained security, policy enforcement, provenance tracking, and cloud-native deployment for mission-critical AI systems operating in regulated enterprise environments.
Small blue and white icon of a clipboard with horizontal lines representing text and two blue tabs at the top.

Traditional Systems

• Isolated records

• Fragmented context

• Delayed decisions

• Limited explainability
A blue icon with three connected circular nodes, each linked by blue lines, forming a triangular network shape on a white background.

TigerGraph Relationship Runtime

• Multi-hop reasoning

• Real-time AI decisions

• Relationship intelligence / Provenance

• Governance

• Explainable AI action


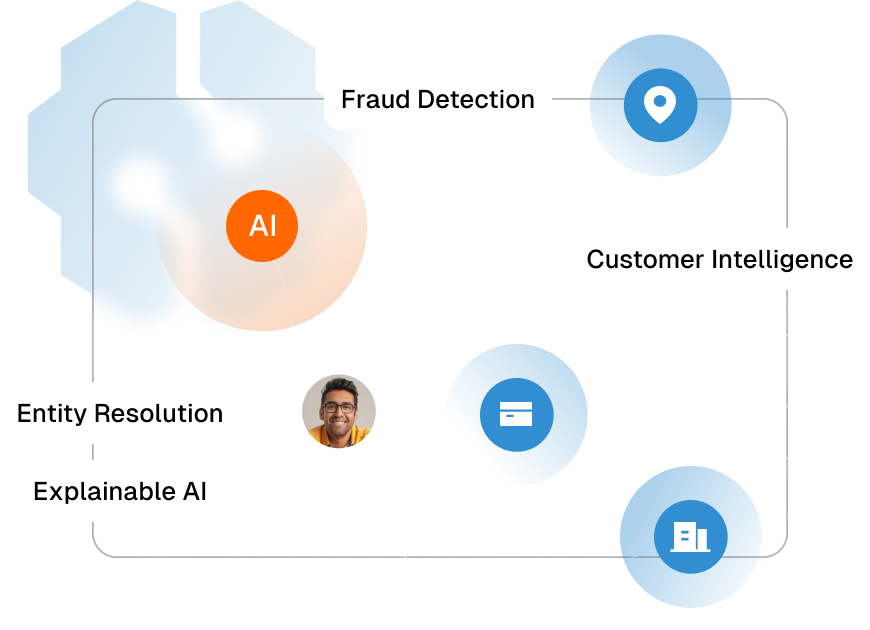
Diagram with labeled circles representing AI, customer intelligence, fraud detection, entity resolution, and explainable AI, connected by lines. A small photo of a man with glasses appears near the entity resolution label.
A soft, light blue and white gradient background with two blurred blue spots, one in the top right corner and another in the top left, creating a calm and abstract atmosphere.

Provable AI Starts with Relationships.

Leading enterprises trust TigerGraph where AI decisions carry financial, operational, and regulatory consequences.
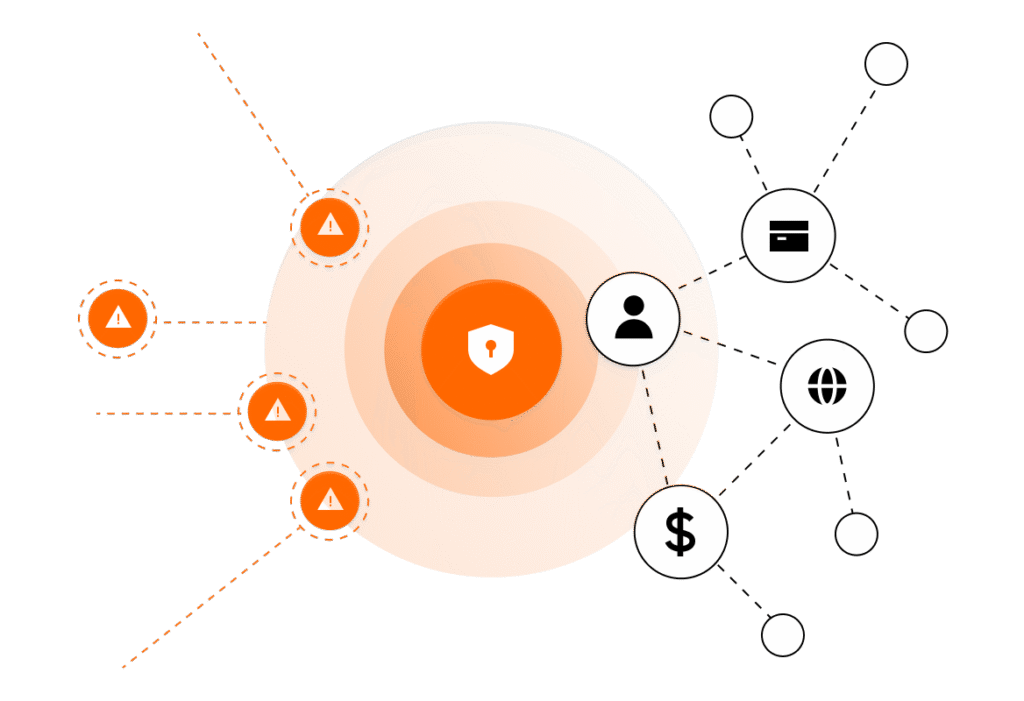
Diagram showing security threats approaching a central shield icon, with warning symbols on the left and interconnected user, credit card, money, and web icons on the right, representing data protection.
Financial Services

Fraud Is a Relationship Problem.

Detect connected fraud rings across accounts, identities, merchants, devices, transactions, and locations in real time — with AI decisions that can be explained, audited, and defended.
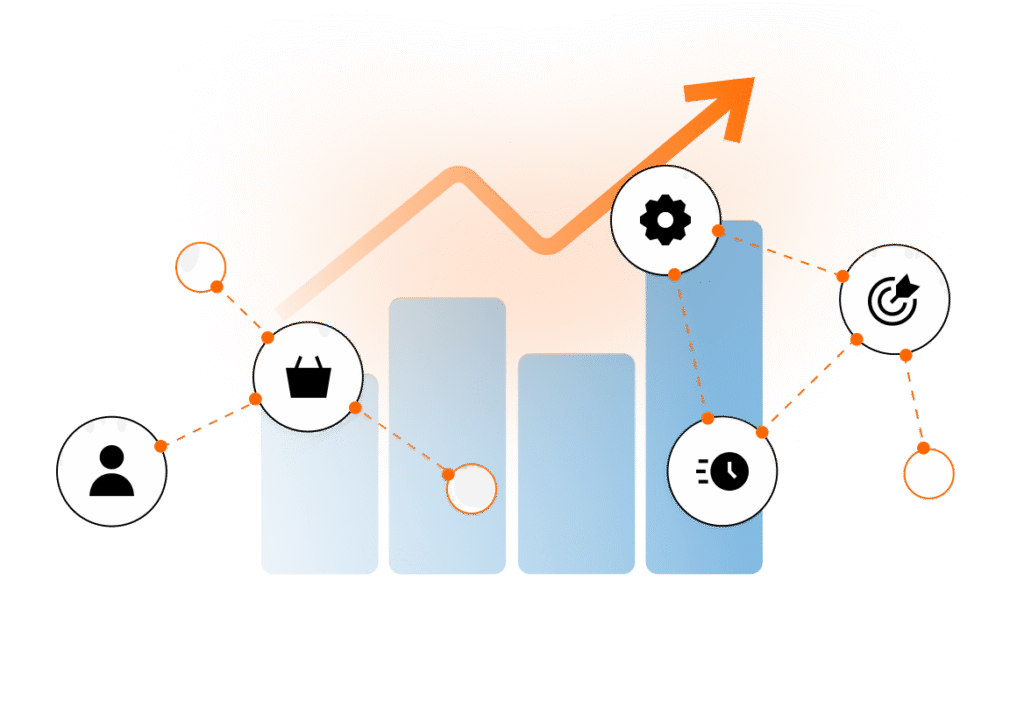
Bar chart with ascending bars, an orange upward arrow, and connected icons representing a person, shopping, settings, time, and a target, illustrating progress and growth in business or productivity.
E-commerce

Personalization Requires Relationship Intelligence.

Understand customer relationships, behaviors, affinities, and intent in real time to power AI-driven recommendations and personalized experiences at enterprise scale.
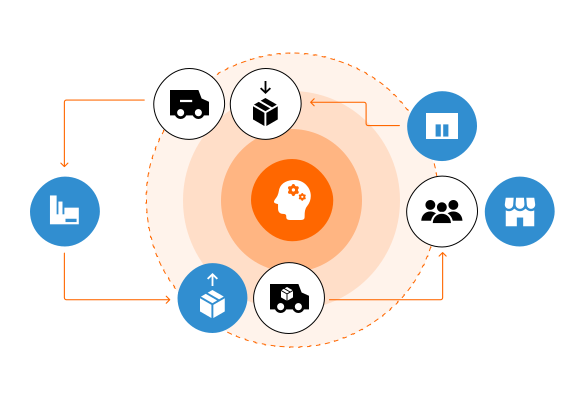
A circular flowchart with icons showing a head in the center, surrounded by symbols of trucks, boxes, warehouses, people, and a store, representing supply chain or logistics processes. Orange and blue colors are used.
Supply Chain

See Risk Before It Cascades.

Map supplier dependencies across multi-hop relationship networks to identify hidden risk, operational bottlenecks, and cascading disruptions before they impact the business.

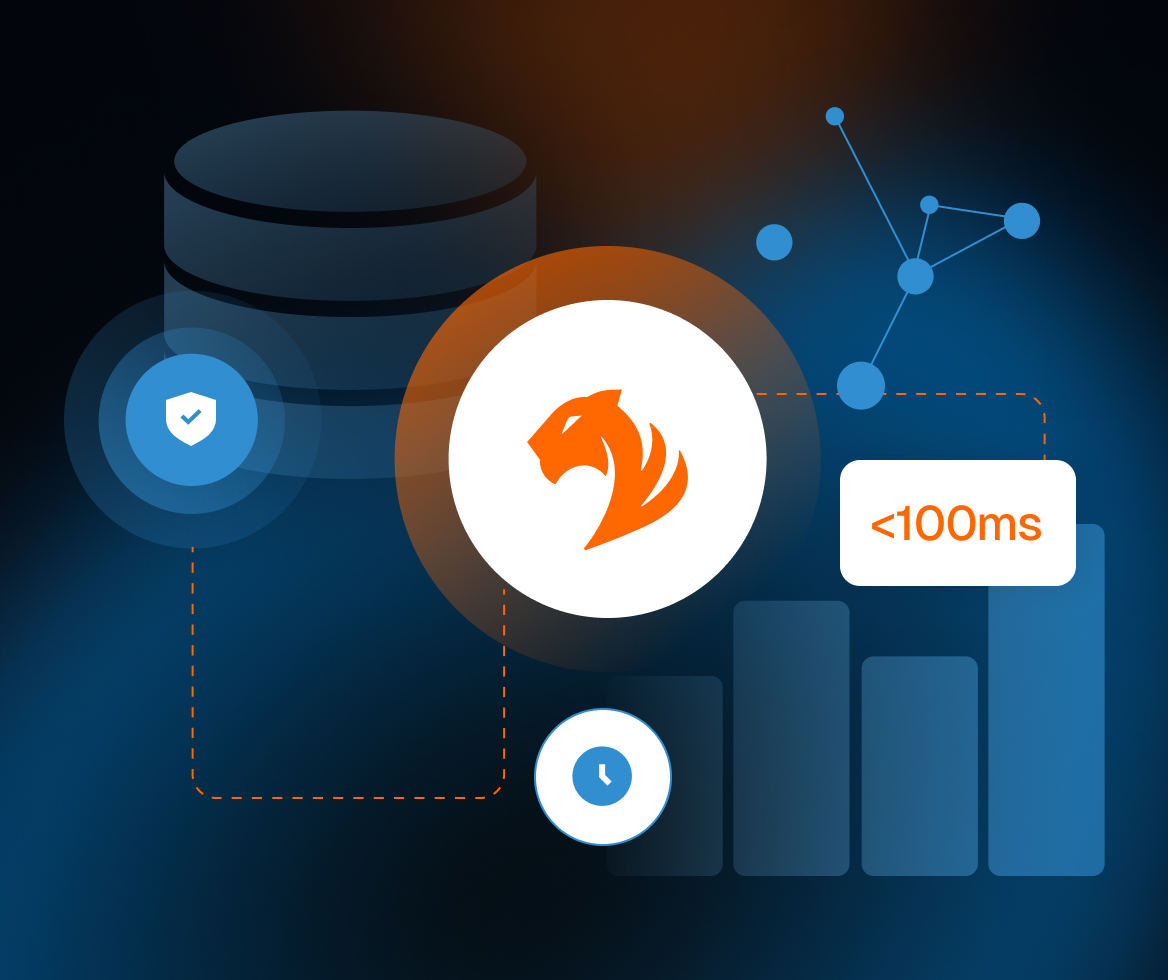
Reason Across Billions of Relationships. Decide in Milliseconds.

While traditional systems struggle with complex relationship reasoning, TigerGraph enables deterministic multi-hop AI reasoning across billions of relationships in milliseconds — enabling explainable, auditable decisions at enterprise scale
A graphic with a large tiger head logo in the center, surrounded by database and network icons, a speed gauge showing
An icon showing a black cube connected by three blue lines to three smaller black squares, representing a network or interconnected system.
Native MPP for AI Decisions at Scale
Built from the ground up for real-time relationship intelligence, combining massive scale, deep traversal, and AI reasoning without sacrificing performance.
A simple chart icon with two jagged, upward-trending lines—one black and one blue—set against a white background, suggesting growth or comparison of data trends.
Real-Time Decisions on Live Connected Data
Continuously reason across live connected enterprise data to make AI decisions as events happen — not hours or days later.
A black shield outline with a blue padlock icon in the center, symbolizing security or protection.
Security, Governance, and Deterministic Evidence for AI You Can Defend.
Built for enterprises where AI decisions require governance, policy enforcement, auditability, encryption, role-based controls, and verifiable evidence.

What Our
Customers Achieve

intuit white logo
“Using graph-based features, our model shows an amazing improvement in detecting 50% more risk events and also improving model precision by 50% at the same time.”
Uri Lapido
Senior Product Manager, Intuit
illumina white logo
“To tackle all the scattered data correlations within our processes, Illumina has onboarded TigerGraph Savanna to begin building an analytics bridge between the many complex processes to tackle manufacturing bottlenecks and improve investigation turn-around time.”
Stephen Horn
Staff Data Engineer, Global Ops
jlr white logo
“With TigerGraph we can join sources of data together and make connections within the data that previously we couldn’t. We can now answer questions that, for the last 20 years, we didn’t think were possible to ask.”
Harry Powel
Director of Data and Analytics
Xbox logo
“One of the reasons why we chose TigerGraph was performance – TigerGraph was the only company that could ingest our data in 3.5 hours, while the other companies would take 7 hours.”
John Conway
Principal Software Developer

Built for Scale, Designed for Provable AI

Enterprise AI infrastructure with cloud-native architecture, relationship intelligence, and governance built for provable AI operations.
A simple icon of a laptop displaying blue angle brackets () on the screen, symbolizing coding or programming.
Query Relationships the Way AI Needs to Reason
Purpose-built query languages optimized for multi-hop relationship reasoning, graph algorithms, and enterprise AI systems operating on connected data.
A simple cloud icon with three lines extending downward, each ending in a blue circle, representing cloud computing or data streaming.

Deploy Provable AI Infrastructure Anywhere
Kubernetes-native infrastructure deployable across AWS, Azure, GCP, and on-premise environments — built for resilient, scalable, enterprise AI systems.
A gear icon with a blue code symbol (forward slash between angle brackets) in the center, representing programming or development settings.
Connect TigerGraph to the Enterprise AI Stack
Integrate TigerGraph into the modern enterprise AI ecosystem with APIs, SDKs, GraphQL, streaming platforms, analytics systems, cloud infrastructure, and AI orchestration frameworks.
A man with curly hair, glasses, and a beard wearing a plaid shirt looks thoughtful while gazing upward, standing against a light gray background.

Ready to Unlock Your Data’s
Hidden Value?

Join thousands of developers and data scientists using TigerGraph’s
leading graph analytics platform to solve complex problems with
connected data.