

Boost Business Revenue with Personalized Customer Experiences
Size of “Global Datasphere” by 2025
Increase in revenues from cross/up-selling
Higher spend when visitor clicks a recommendation

Drive Revenue in the Process
Uncover Patterns, Similarities and Other Insights
Graph databases empower every executive to uncover patterns, similarities and other insights hidden in their datasets that can result in more accurate business decisions. Accomplishing that goal requires a three-step process: integrating data to make it reliable, building 360-degree views of this data and, finally, extracting insights from the data to personalize recommendations for and deepen relationships with customers.
Read More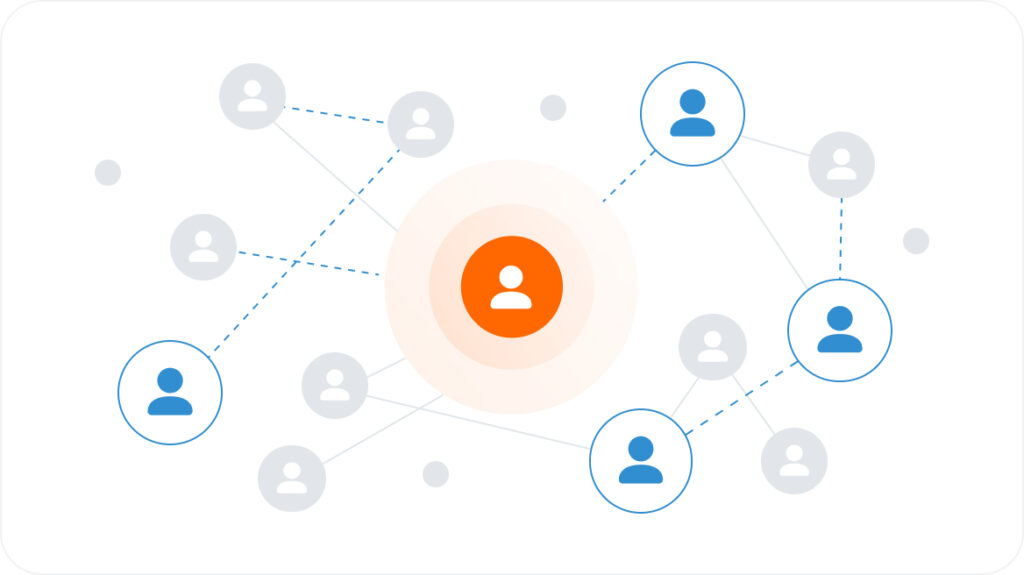
Integrate Data to Identify Valuable Customer Insights
Entity resolution is the process of disambiguating data. The key to entity resolution is connecting digital entities referring to the same real-world identities. Graph databases are the most intuitive and efficient data structures for connecting dots. Each digital entity can be represented as a vertex in the graph; each attribute that will be used to connect the entities can also be represented as a vertex in the graph. If we represent the entity-has-attribute relationship as edges, then we can form a graph where different entities are linked together when they share a set of attributes such as phone number, email, physical or IP address.
Read More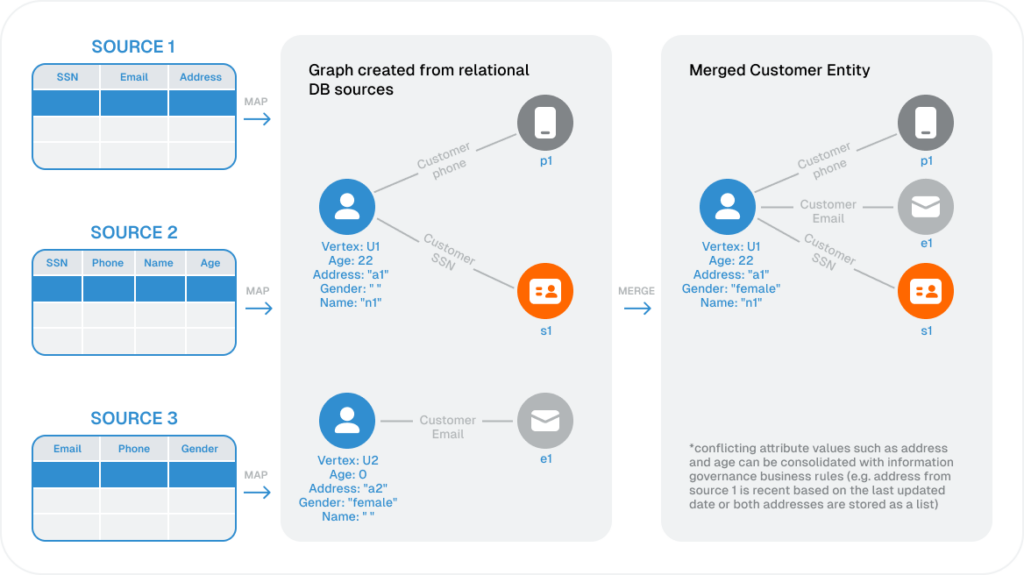
Build 360-Degree Views of Interconnected Data
The next step is to build 360-degree views of the data. Graph databases are the ideal way to accomplish this. This results in a much better solution for understanding the connections among data. A marketer could, for example, create a graph that identifies the names of the key people involved with a sales opportunity, along with their roles and the date of their involvement in the opportunity. A couple of clicks identifies specific actions of the individuals involved in the opportunity, such as downloading a white paper, watching a webinar, attending a meeting, downloading developer edition software, signing up for a cloud-based trial and more. By applying analytics on this data, the marketer could now offer contextual next best actions to further move the customer along the sales campaign.
Read More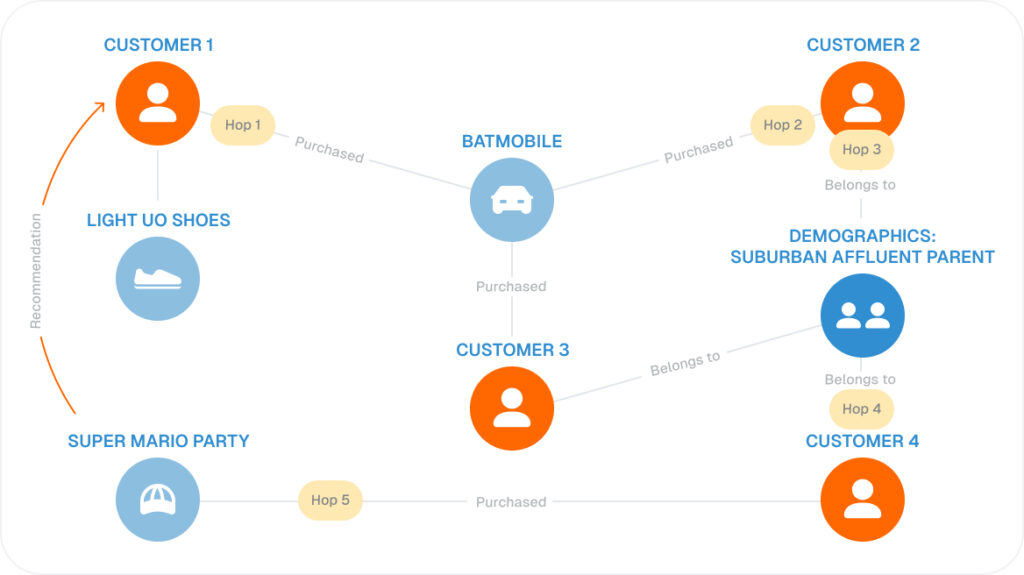
Personalize Recommendations to Boost Customer Loyalty
The Result: Understand Your Customers, Drive Revenue in the Process
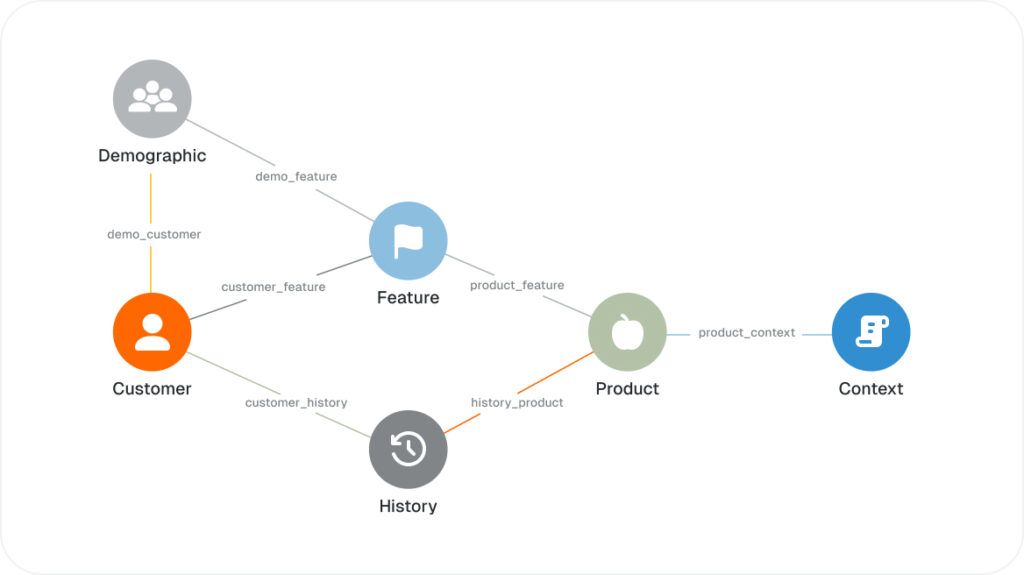
The better you know your audience, the more competitive your offering. Take the example of a media company. A person could consume content on different devices, such as a smartphone, tablet device or desktop computer, from various streaming platforms, including Roku, XBox, and Xfinity, using multiple accounts in some cases, spanning HBO’s Go to Comcast’s Xfinity app, and so on. Although this will result in multiple data points, they are all associated with a single viewer. An ability to disambiguate that data, and build 360° view of consumer’s behavior (eg, programs, viewer preferences), enables the media company to recommend programming likely to hold the interests of subscribers. At the same time, it empowers the media company to build a hyper-personalized advertising platform that offers advertisers a higher probability of reaching their intended audiences.
Read More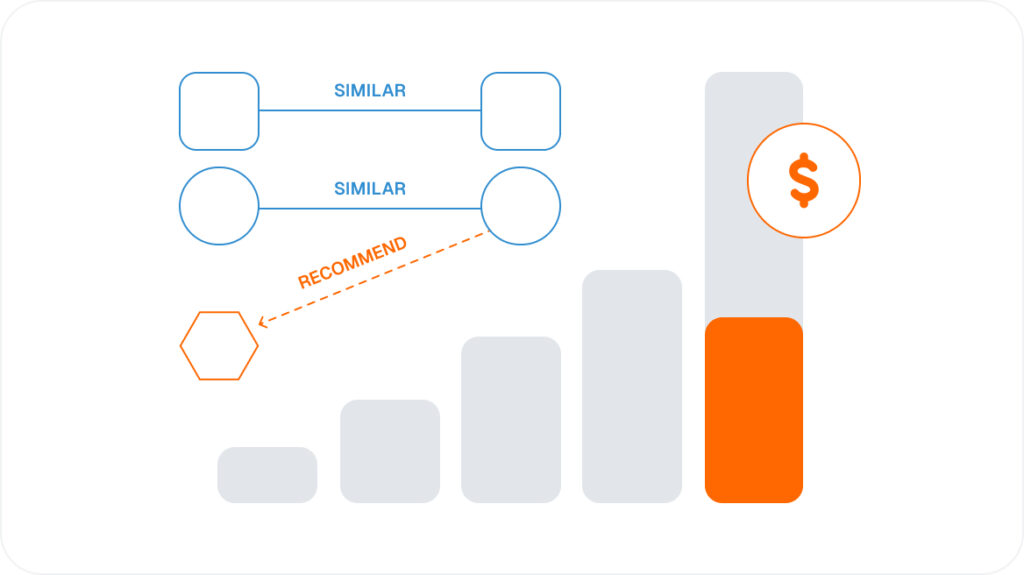


FAQ
A graph-based advertising, media, and entertainment database stores and analyzes connected data about viewers, subscribers, devices, accounts, content, campaigns, advertisers, and engagement activity. Leveraging connected data, media organizations are better equipped to build unified audience views, personalize recommendations, optimize ad targeting, reduce churn, and deepen customer relationships.
A graph offers several advantages for advertising, media, and entertainment databases:
- Connected audience views help teams understand viewers across devices, platforms, accounts, and channels.
- Improved context and pattern detection enable more relevant content recommendations and advertising segments.
- Relationship-aware analytics help increase engagement, loyalty, ad performance, and revenue opportunities.
Tasks such as audience identity resolution, content personalization, ad targeting, churn prevention, and recommendation require a comprehensive analysis of data, including seeing patterns of behavior and how viewers, devices, content, and advertisers are related. Tabular databases are not built for this type of activity and cannot perform it quickly or at scale. Graphs are outstanding for finding and analyzing connection patterns and similarities.
Yes, TigerGraph is built for scalability, with massively parallel processing and a distributed database architecture. This means organizations can analyze growing volumes of viewers, devices, content, campaigns, impressions, clicks, and engagement data by adding more servers while performance keeps up. TigerGraph has been benchmarked up to 108 TB.
Yes, TigerGraph helps media and entertainment organizations connect fragmented audience, device, content, subscription, advertising, and engagement data into a unified graph. TigerGraph features include encrypted data transfer, fine-grained access control, advanced authentication, high availability, cross-region replication, disaster recovery support, and detailed audit logs.
TigerGraph is the top graph database for advertising, media, and entertainment because it offers:
- Real-time deep-link analytics
- Scalability to handle enterprise-level audience and engagement data
- Machine learning integration for improved personalization
- Strong security, reliability, and data connectivity
- Proven use cases across Customer 360, entity resolution, recommendation, and revenue optimization