

Build 360° Views of the Customer Journey With TigerGraph
Percentage of B2B marketers struggling with inconsistent data.
Reasons why customer 360 matters.
Companies have customer 360 views
Most Companies Struggle to Fully Understand Customer 360
Not using a Graph Database is an Obstacle to Fully Understanding Customer 360
Traditional solutions are built upon relational databases, which store information such as account, contact, lead, campaign, and opportunity in separate tables, one for each type of business entity.
Relational databases are good tools for indexing and searching for data, as well as for supporting transactions and performing basic analysis. However, relational databases are poorly-equipped to connect across the tables or business entities and identify hidden relationships and patterns going across multiple leads, campaigns, and opportunities. This limitation makes implementing effective master data management graph database solutions critical for organizations seeking to unify their customer data landscape.
Read More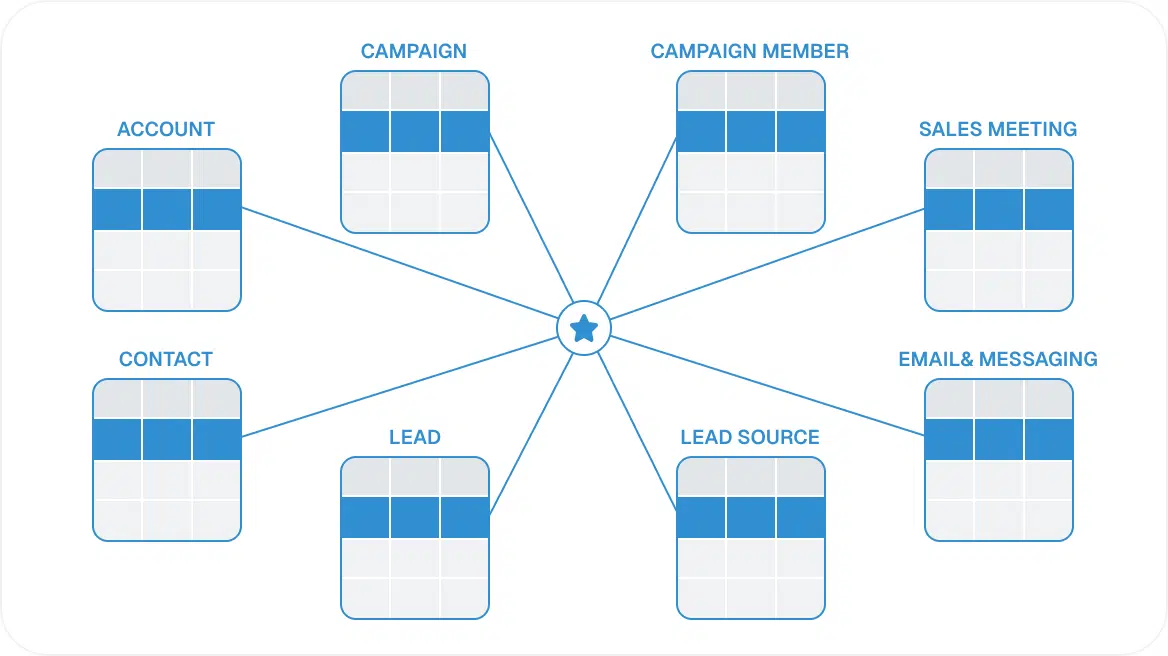

Database for Real-time Customer Database for 360/MDM?
Graph Database Can Provide a Seamless View of the Customer Journey
A graph database for customer 360 enables marketing teams to connect different types of information seamlessly. Unlike traditional approaches, graph based master data management allows marketers to create comprehensive views that identify the names of key people involved with an opportunity, along with their roles and the date of their involvement in the opportunity.
With master data management graph visualization, a couple of clicks identifies specific actions of the individuals involved in the opportunity, such as downloading a white paper, watching a webinar, attending a meeting, downloading developer edition software, signing up for a cloud-based trial and more. The dates of each of these actions are displayed on the graph, providing unprecedented visibility into customer behavior patterns.
This graph customer 360 solution transforms how organizations understand their customers by creating unified, contextual views of all customer interactions and relationships across the entire enterprise.
Read More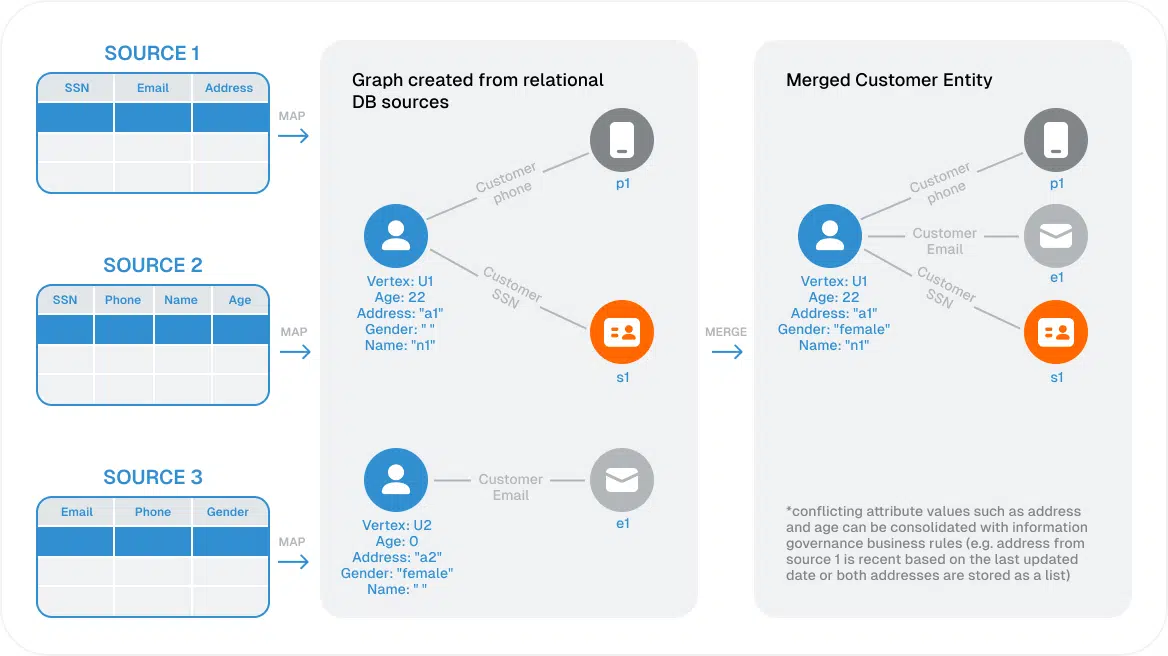
Finding the Customer 360 Engagement and Attribution Patterns With a Graph Database
The power of an mdm graph database lies in its ability to reveal hidden patterns and connections that traditional systems miss. By implementing graph master data management, organizations can:
- Trace complete customer journeys across multiple touchpoints and channels
- Identify influential relationships and decision-makers within target accounts
- Understand the true impact of marketing activities on customer progression
- Discover previously unknown connections between prospects, customers, and opportunities
This comprehensive approach to customer data unification enables marketers to make data-driven decisions based on complete, accurate, and connected customer intelligence rather than fragmented views from siloed systems.
Read More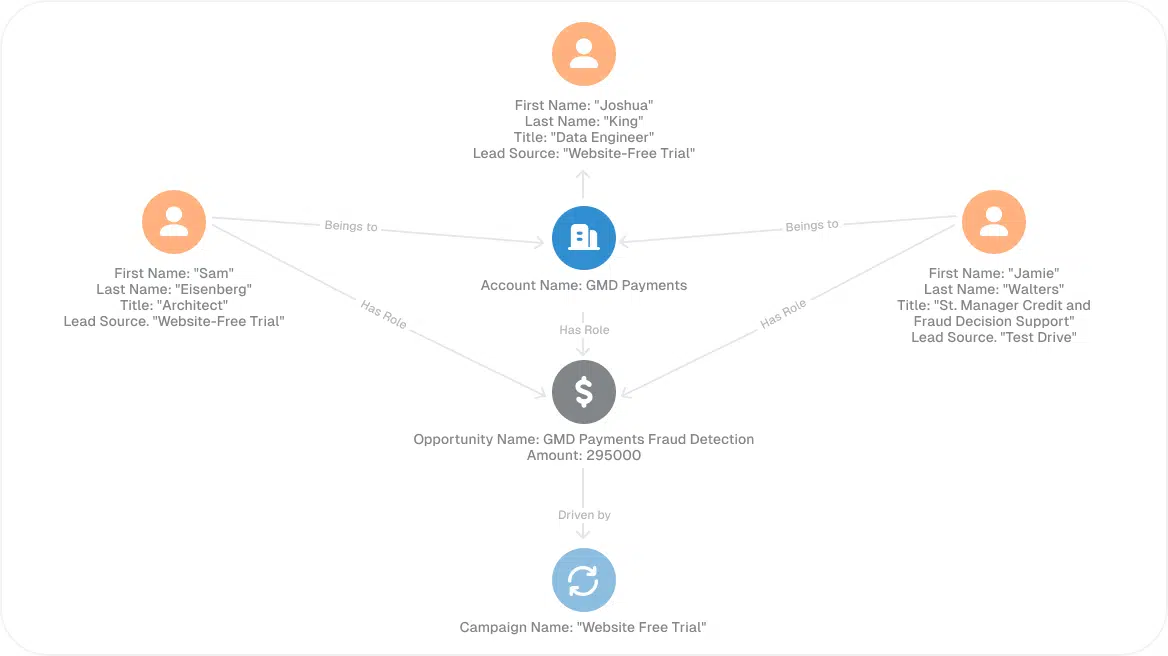
FAQ
A customer 360 graph database is a specialized data management system that stores customer information as interconnected nodes and relationships rather than separate tables. Unlike traditional customer data platforms that struggle to connect disparate data sources, a graph database for customer 360 naturally represents the complex relationships between customers, products, interactions, and touchpoints. This enables organizations to see the complete customer journey as a connected network rather than fragmented data points.
Graph based master data management addresses data silos by creating a unified data model where all customer-related information is connected through relationships. Instead of maintaining separate databases for sales, marketing, support, and other departments, an MDM graph database creates a single source of truth where data from all systems is integrated and linked. This eliminates duplicate records, inconsistent data, and provides a holistic view of each customer across all business functions.
Graph databases excel at solving several critical Customer 360 challenges:
- Complex relationship mapping: Understanding how customers influence each other and identifying buying committees
- Multi-touch attribution: Accurately tracking the impact of various touchpoints across lengthy B2B sales cycles
- Real-time personalization: Dynamically updating customer profiles based on connected relationship changes
- Predictive analytics: Identifying patterns in customer behavior networks to predict churn, upsell opportunities, and next best actions
- Cross-selling optimization: Discovering product affinity patterns across customer networks
Master data management graph visualization transforms complex customer data into intuitive, interactive visual representations. Business users can see customer relationships, interaction patterns, and journey flows as connected diagrams rather than spreadsheets or reports. This visual approach makes it easier to identify influencers, understand decision-making processes, spot anomalies, and communicate insights across teams. Users can explore customer networks by clicking and drilling down into specific relationships and touchpoints.
Organizations typically see ROI from graph customer 360 solutions through:
- Improved conversion rates (15-25% increase) through better understanding of customer decision-making processes
- Reduced customer acquisition costs (20-30% decrease) by identifying the most effective channel combinations
- Increased customer lifetime value (10-20% improvement) through more accurate cross-selling and upselling
- Enhanced marketing attribution accuracy (40-60% improvement) leading to better budget allocation
- Faster time-to-insight (50-70% reduction) in customer analysis and reporting
Graph master data management provides superior data quality and governance through:
- Relationship-based validation: Data quality rules that leverage connections to identify inconsistencies
- Automatic duplicate detection: Graph algorithms that identify potential duplicate entities based on relationship patterns
- Lineage tracking: Complete visibility into how customer data flows and transforms across systems
- Policy enforcement: Relationship-aware governance policies that ensure data consistency across connected entities
- Impact analysis: Understanding how data changes affect related customer information throughout the network
Key implementation considerations include:
- Data integration strategy: Planning how to connect existing systems and data sources to the graph database
- Schema design: Modeling customer entities and relationships to support both current and future use cases
- Performance requirements: Ensuring the graph database can handle query complexity and data volume at scale
- Security and privacy: Implementing appropriate access controls and data protection measures
- Change management: Training teams to leverage graph-based insights and visualization tools
- Migration planning: Developing a phased approach to move from legacy systems to the graph-based Customer 360 solution