

Obtain Insights From Geospatial Data With TigerGraph
Global Geospatial Analytics Market in 2017
CAGR of the Geospatial Analytics market to 2026
Percentage of C-level executives planning to invest in location data
Geospatial Analysis Is Becoming a Must-Have for Many Organizations
Legacy Systems Are Insufficient for Geospatial Analysis
Relational databases are poorly suited to geospatial analytics for several reasons: first of all, the data model is not designed for complex location-based analytics questions in real time; secondly, the geospatial analytics may rely on third-party index; and, in addition, there are no easy SQL queries to answer these complex location focused questions. Traditional geospatial analytics applications built on relational databases were not designed to address this challenge. Due to these challenges, many organizations have taken geospatial analytics into their core business intelligence modeling and are missing crucial insights as a result.
Read More

Database for Geospatial Analysis?
Uncover Insights From Geospatial Data Using Deep Link Analytics
Get Insights From Geospatial Data Using Real-Time Analytics
Uncover Insights From Geospatial Analysis of Internet of Things Data
FAQ
Geospatial analysis is the process of analyzing location-based data to understand how people, assets, devices, events, and services move and interact across physical space. It is critical because location patterns can reveal customer behavior, operational risk, demand changes, service gaps, and business opportunities that are often hidden in traditional analytics.
Graph databases improve geospatial analysis by modeling locations, customers, devices, sensors, vehicles, stores, transactions, and events as connected data. Unlike relational databases that require complex joins across separate tables, graph databases can traverse relationships in real time to reveal movement patterns, proximity, dependencies, and location-based opportunities across multiple connected entities.
TigerGraph’s geospatial analysis solution supports real-time, deep link analytics across massive volumes of connected location data. It can analyze multi-hop relationships across customers, products, transactions, sensors, vehicles, routers, locations, and time-based events to uncover hidden patterns, improve recommendations, optimize operations, and support faster location-aware decisions.
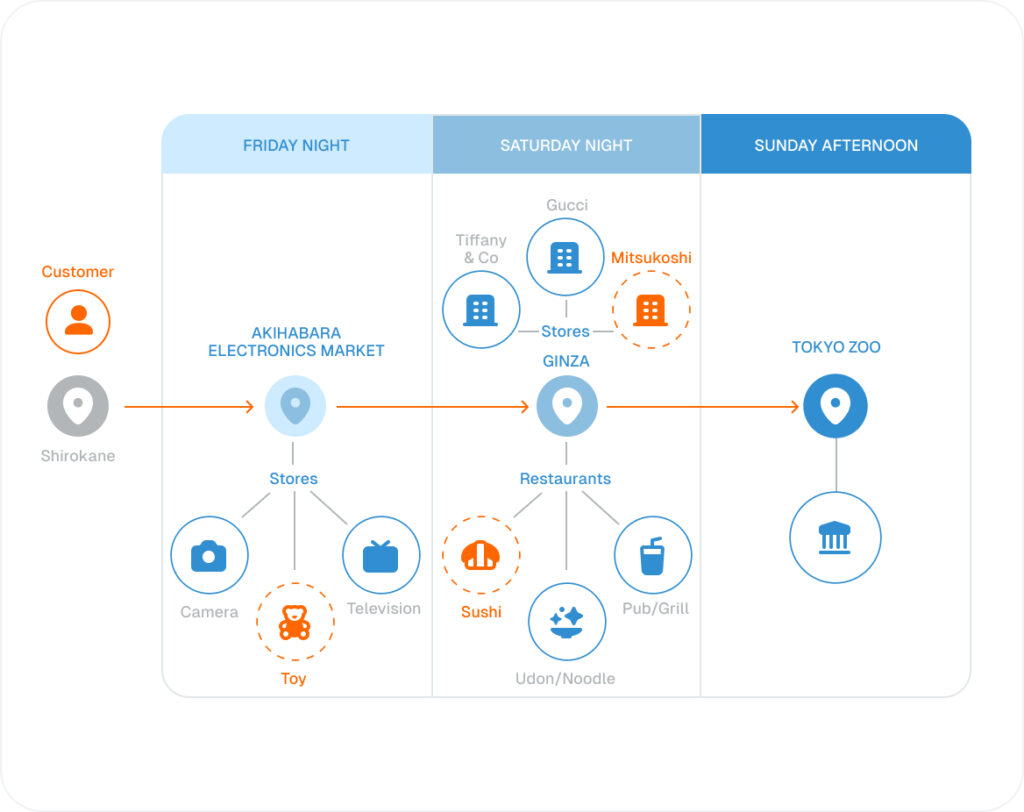
Yes, TigerGraph can support real-time location-based recommendations by combining customer behavior, transaction history, product interest, mobility patterns, and current location context. This helps organizations deliver more relevant offers, services, and recommendations based on where customers are, where they have been, and what nearby opportunities are most likely to matter.
TigerGraph supports AI and machine learning for geospatial analysis by generating graph-based features from connected location data, such as mobility patterns, proximity scores, route relationships, demand clusters, asset dependencies, and location-based influence. These features help models improve recommendations, forecasting, anomaly detection, routing, and operational decision-making across complex geospatial networks.
The main challenges include massive location data volumes, fragmented systems, fast-changing movement patterns, complex proximity calculations, and limited visibility into how location, time, behavior, and infrastructure are connected. Traditional systems often struggle with deep location-aware analysis at speed. A graph database addresses these challenges by analyzing connected geospatial data directly and at scale.
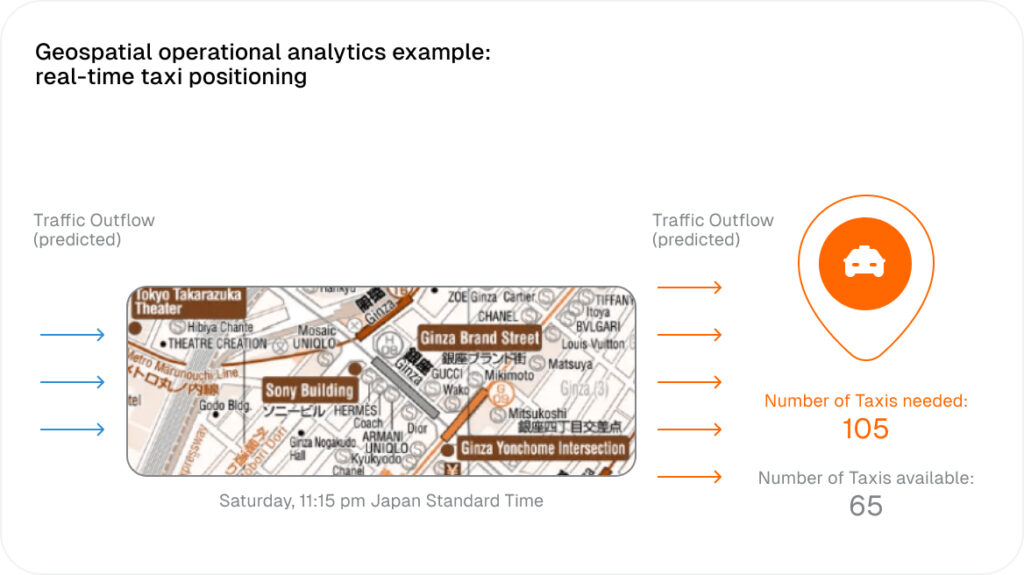
Real-time graph analytics helps organizations understand how location-based events affect connected people, assets, services, and infrastructure. Instead of analyzing location data in isolation, teams can detect demand changes, supply gaps, movement patterns, routing issues, and service disruptions as they happen, enabling faster response and better operational decisions.