

Transform Healthcare With Graph and AI
U.S. health care costs for 2018
Annual growth in U.S. healthcare costs over next decade
Healthcare spend per capita to double by 2040
Transforms Healthcare
Control the Rising Cost of Healthcare by Understanding Relationships
The Healthcare Industry is looking for ways to contain rising costs. In order to maximize savings, it’s important for all parties to understand the relationships among patients and doctors, especially as they pertain to the members’ journey to wellness. The bulk of the current tools for storing and analyzing healthcare data are built on relational databases. These databases store the data for each entity such as member, provider, claim, and treatment facility in separate tables or even separate databases. In order to connect and understand the relationships among these entities, all of these tables or databases must be joined together. As the size and complexity of the data grow, the database table joins become time-consuming and computationally expensive, thereby making a relational database an impractical solution for understanding and analyzing relationships. Using a Graph Database is a more cost effective solution.
Read More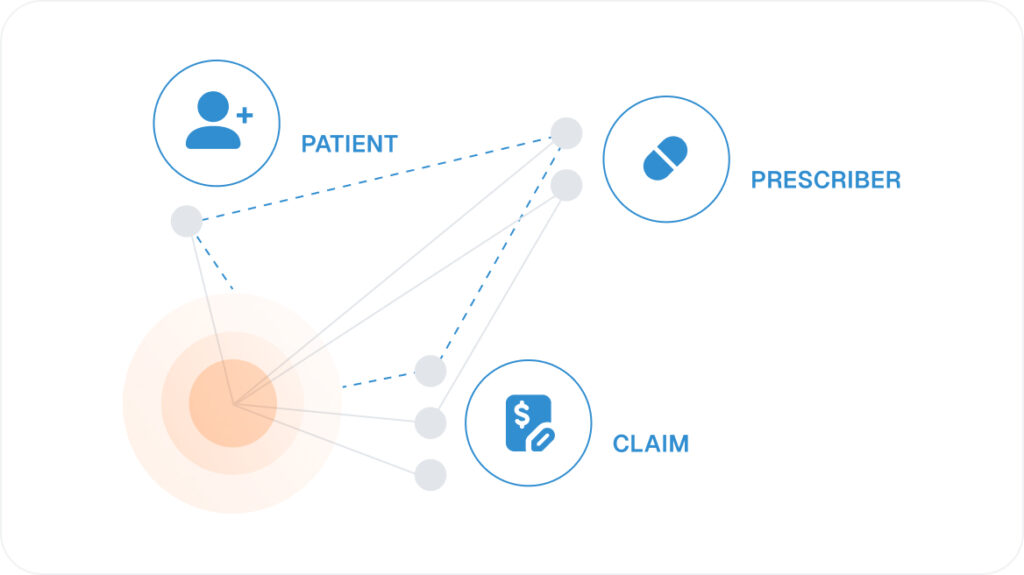
Stop Rampant Waste and Abuse/Fraud
Another major imperative is rampant waste and abuse or fraud. In March 2018, Kaiser Health News shared a YouTube video showing how a simple urine test was billed for $1,845 by an unscrupulous laboratory, which piled on unnecessary tests to pad the bill. Healthcare-related fraud is estimated at around 3-10% of the total cost and is rising, especially with the opioid epidemic affecting over 2 million Americans. Finding these fraudulent activities requires analysis of internal data regarding the patients, opioid treatment facility centers, as well as referring physicians and connecting it with external data such as recently used addresses and phone numbers to find the hidden connections among patients, doctors, and the opioid treatment facilities
Read More Improve Member Satisfaction and NPS
TigerGraph Powers Real-time Member and Provider 360 Views
Building and maintaining a real-time member and provider 360 view is challenging. It requires combining three types of data. The first of these is the master data about patients, doctors, healthcare providers, hospitals and their various facilities. The second type of data is the transactional data, which includes healthcare claims and payments as well as the member’s electronic health records. Lastly, the third type of data is the historical data – petabytes of information stored in data warehouses and massive Hadoop data lakes. All of this internal data must be combined with the data from partners such as hospitals as well as public data sources including FAERS and openFDA in the United States.
Read More
TigerGraph Delivers Seven Key Data Science Capabilities for Healthcare
TigerGraph delivers seven data science capabilities for healthcare industry to build real-time 360 views of members and providers and support the four strategic imperatives.
Read More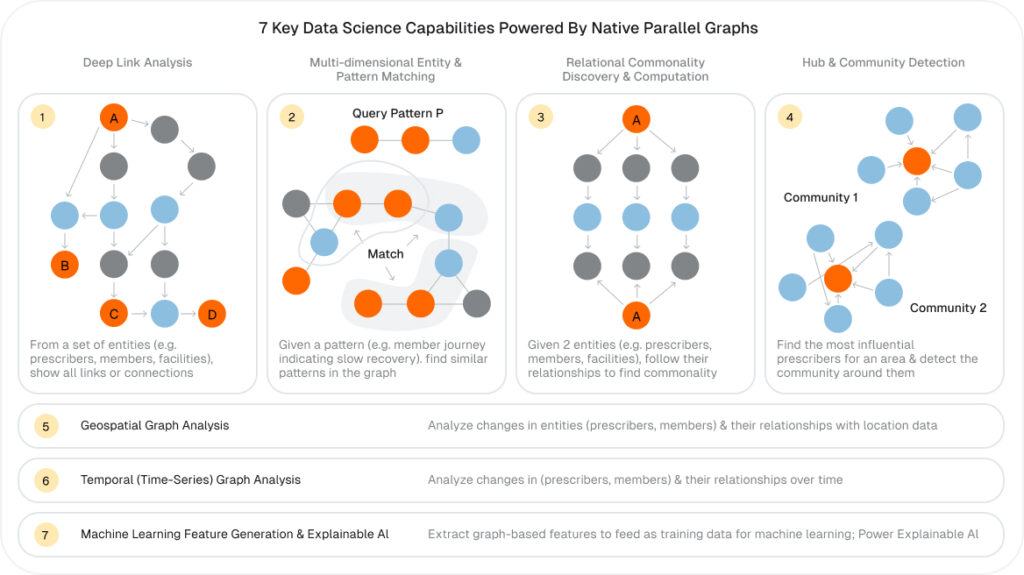
#1 – Find Fraud and Abuse With Deep Link Analysis
Deep link analysis refers to the ability to look across multiple (typically more than three) connections in data. Consider a doctor who is referring a large portion of patients to a specific substance abuse treatment center specializing in opioid addiction. At first glance there may not appear to be a connection between the substance abuse treatment center and the doctor and traditional fraud solutions can’t find anything unusual based on the information available for the doctor as well as the opioid addiction treatment center. TigerGraph, however, can mine data from third-party sources such as Thomson Reuters or Dun & Bradstreet to find all known administrators for the drug treatment center and their current and previous addresses. This analysis could find, for example, that one of the previous addresses for the administrator is the same as the address for the doctor referring patients to the treatment center. In order to detect this hidden relationship between the doctor and the administrator, requires a deep link query with eight hops across claims data for the doctor visits by patients and opioid treatment center claims by the same patients and combining that with the third-party knowledge repository data such as addresses and phone numbers to find the collusion.
Read More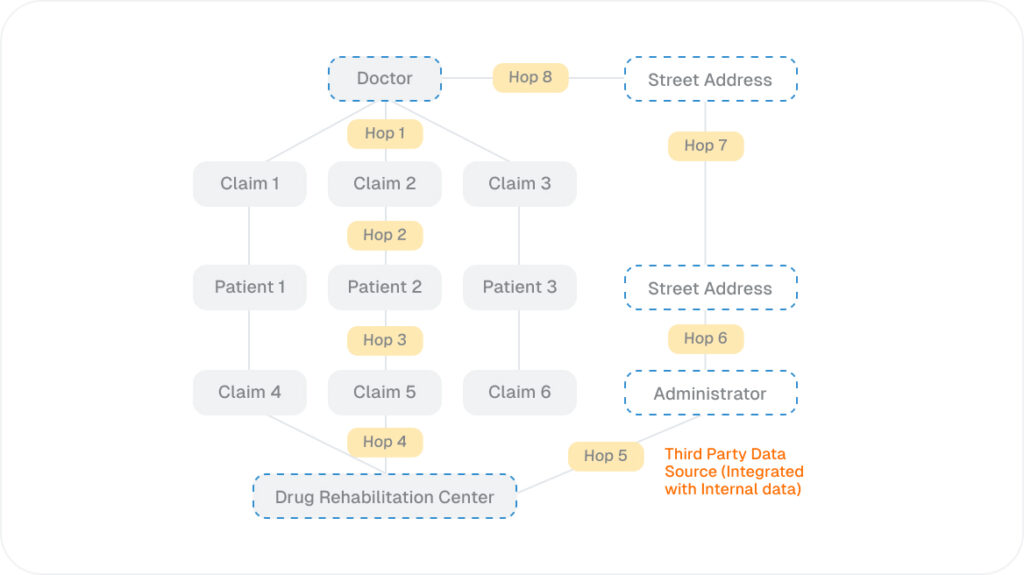
#2 – Improve Quality of Care With Entity and Pattern Matching
Multi-dimensional Entity and Pattern Matching refers to understanding the significance of a pattern of connections between different data types and looking for similar patterns across datasets. Let’s look at the journey of an elderly member, Doris, who recently had knee surgery. Post-operation, Doris attended a consultation with her doctor who examined her knee and recommended four weeks of physiotherapy. Doris missed her appointments for two consecutive weeks and also missed the second postoperative consultation set up with her doctor. After a few months, this led to complications, where Doris’ knee had to be operated on again. By matching that pattern with the journeys of other members, TigerGraph can enable a healthcare provider, as well as an insurer, to take proactive actions to offer support and assistance, and ensure that these members get to their physiotherapy sessions and post-op sessions as required and avoid adverse health outcomes.
Read More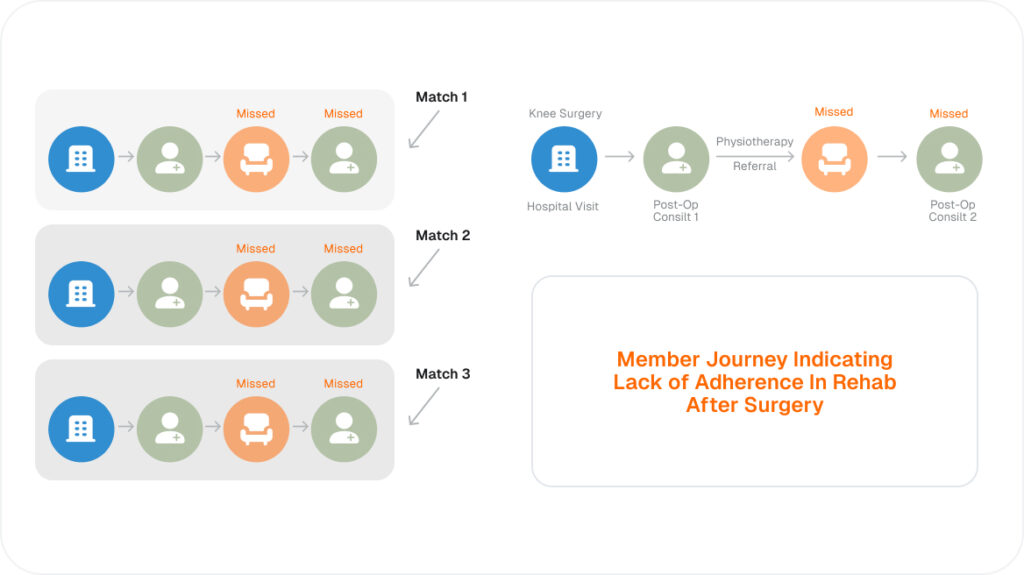
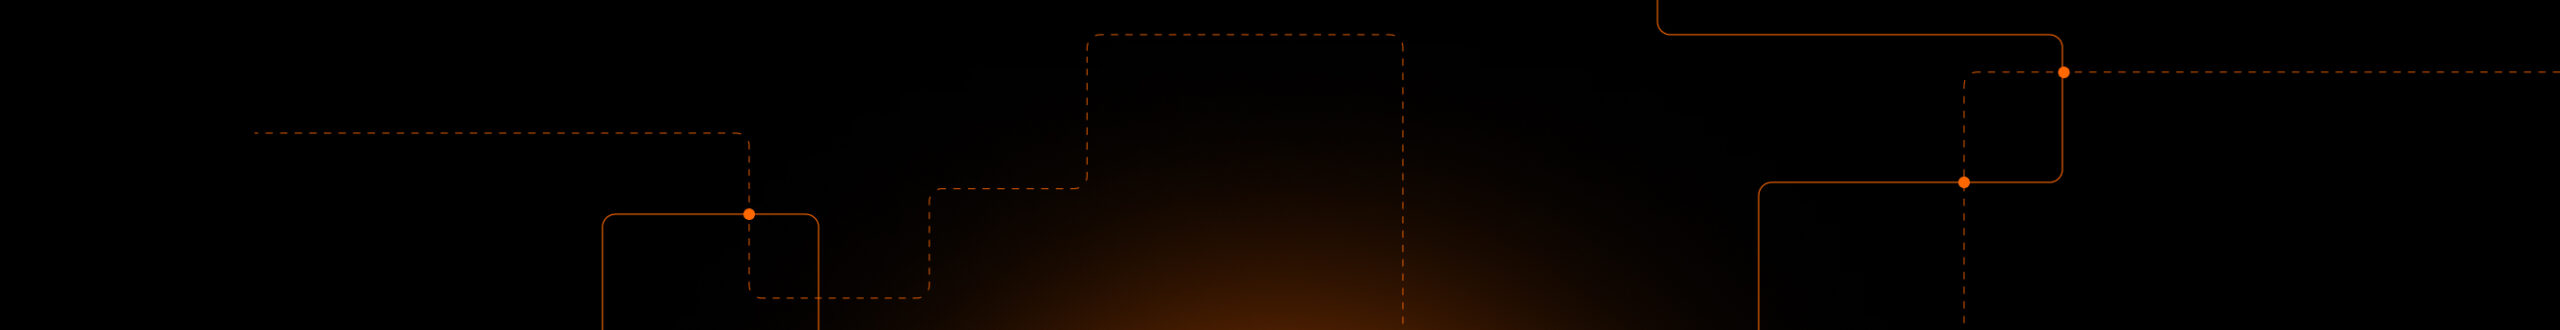
#3 – Uncover Referral Networks With Relational Commonality Discovery and Computation
Relational Commonality Discovery and Computation refers to understanding extended relationships among different entities.
In this example, two providers, Dr. Douglas Thomas, a general practitioner and Dr. Helen Su, an interventional cardiologist or surgeon are linked through their common patients and claims.
A referral edge or relationship is established between Dr. Douglas Thomas and Dr. Helen Su and the relationship edge carries important information such as the number of patients referred, healthcare condition groups or codes (such as ICD10 codes) related to the referred patients.
Read More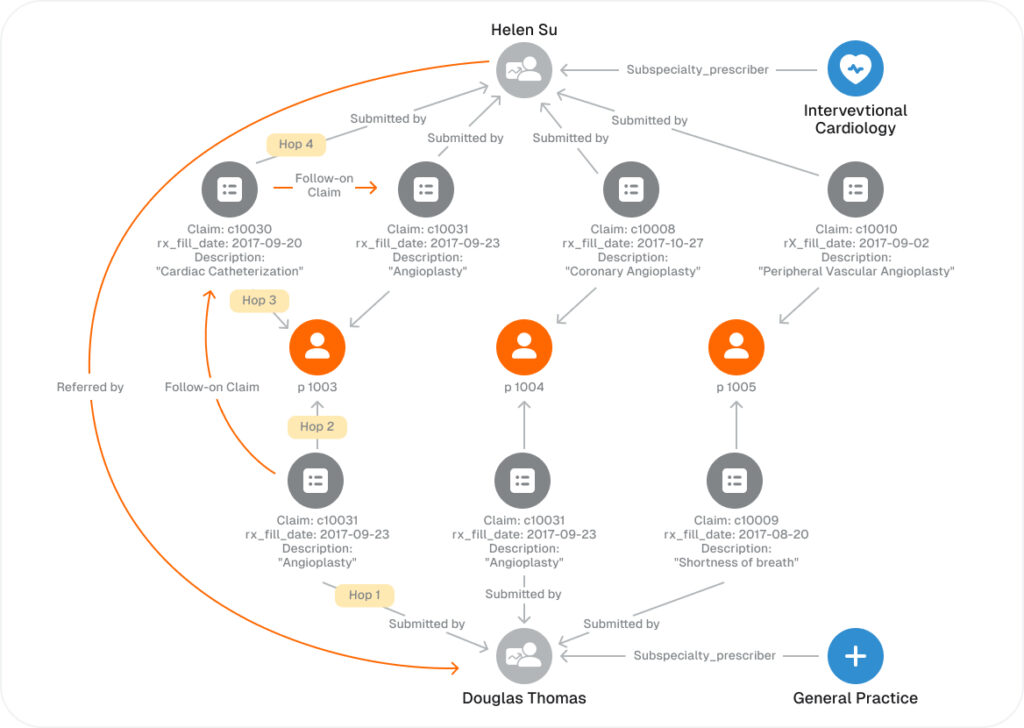
#4 – Find Hubs of Influence With Hub and Community Detection
Hub and community detection has two steps: the first step is finding the most influential providers (hubs) driving maximum referrals for a specific health condition such as cardiac care or diabetes management or a particular type of drug (such as drug for hypertension); the second step is establishing a community of connected providers and the members availing the services from the providers.
Consider an example, shown in the figure, which builds on the referral relationships, established by Relational Commonality and Computation, among Dr. Douglas Thomas and several other providers in the area.
PageRank algorithm is used to rank all of the doctors, with providers with most number of referrals receiving the highest score. Dr. Douglas Thomas with PageRank of 3.9 is the most influential provider in the network.
The next step is establishing multiple communities of connected providers and understanding the healthcare products and services consumed by each community. TigerGraph’s open source graph algorithm library includes multiple PageRank and community detection algorithms to deliver this functionality.
Informed by these insights, the healthcare payer can start to understand which referral networks or communities of providers have above average spend for the cost of care for similar members versus which referral networks or communities or providers are more efficient and lower than average spend while delivering similar healthcare outcomes for the members.
Read More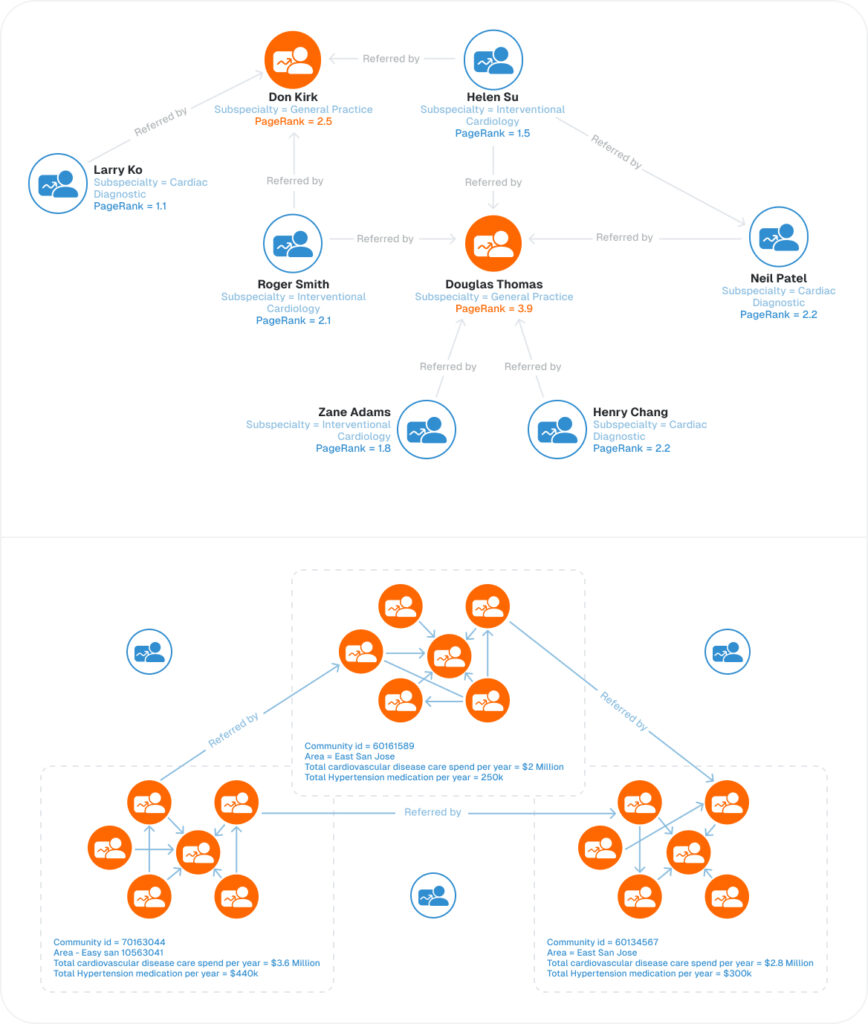
#5 – Understand Provider Coverage With Geospatial Graph Analysis
Geospatial Graph Analysis refers to identifying connections between data that are related to physical location. Geospatial analysis can, for example, analyze the spread of patients covered by each provider as well as connected provider communities geographically.
Read More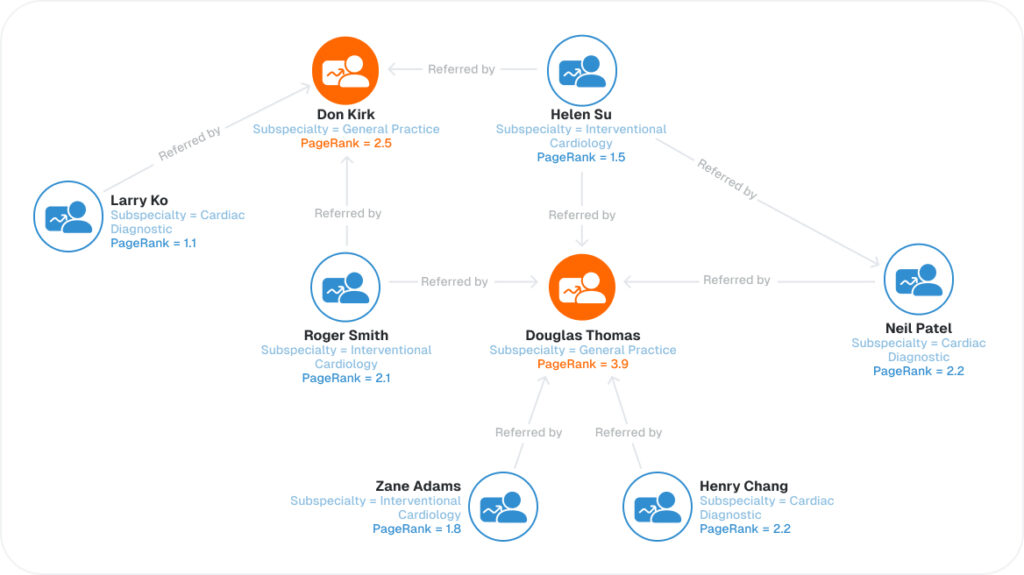
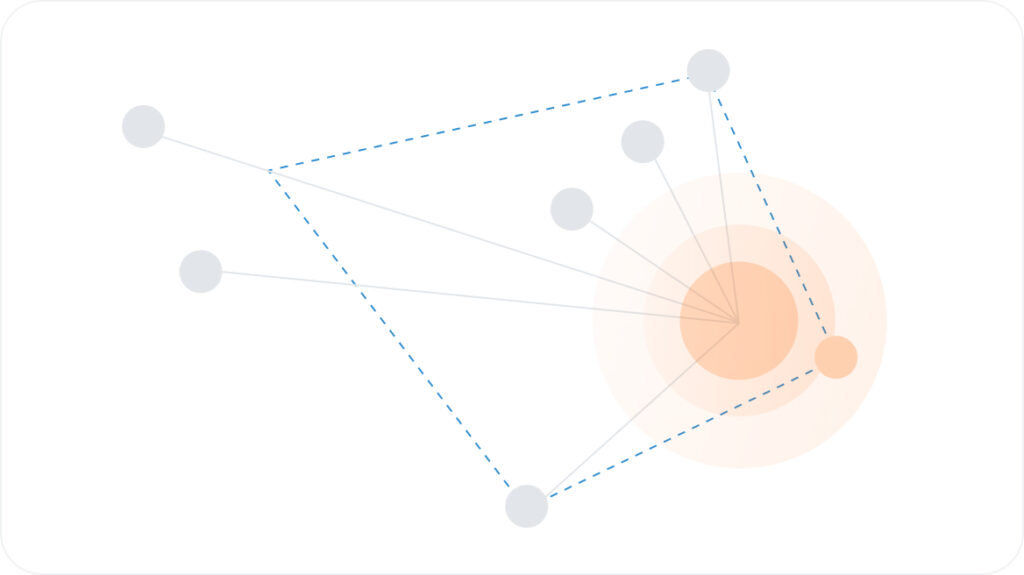
#6 – Improve Quality Care While Lowering Costs With Time Series Analysis
Temporal (Time Series) Graph Analysis refers to analyzing connections between entities over time. Consider the example showing member journey for the elderly member, Doris. Temporal analysis enables providers to see, at a glance, all the information that is relevant to an individual patient, and identify opportunities for improving quality of care. When entity and pattern matching to find similar patients, for example, temporal graph analysis can provide a care team with information about members who are missing postoperative appointments. TigerGraph can enable a care team to take proactive actions to offer support and assistance, and ensure that members remain committed to their recovery programs.
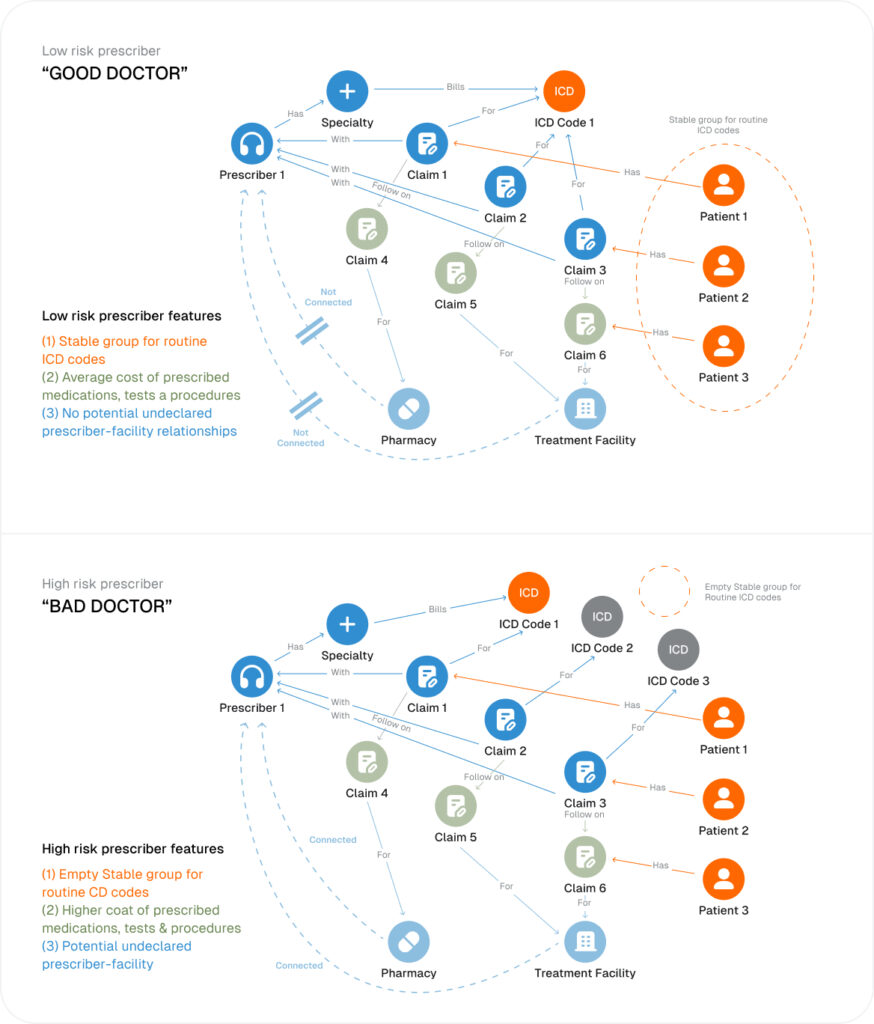
Read More #7 – Improve Accuracy of Fraud Detection With Machine Learning and Explainable AI
Machine Learning Feature Generation refers to the ability to identify important data relationships and use those features as resources for training an artificial intelligence on identifying similar features without human intervention and at great scale.
Consider the example shown in the figure with several graph-based features computed to assess whether a provider (or a doctor) is a low-risk provider (“good doctor”) or a high-risk provider (“bad doctor”). These graph-based machine learning features for “good doctor” and “bad doctor” are generated for each provider and are fed into the machine learning solution as training data.
FAQ
A graph-based healthcare and life sciences database stores and analyzes connected data about members, patients, providers, claims, treatments, facilities, prescriptions, referrals, and care activity. Leveraging connected data, healthcare organizations are better equipped to reduce costs, detect fraud and abuse, improve quality of care, build Member 360 and Provider 360 views, and support AI-driven healthcare analytics.
A graph offers several advantages for healthcare and life sciences databases:
- Connected member and provider views help teams understand care journeys across claims, facilities, prescriptions, and services.
- Improved context and pattern detection enable better fraud, waste, abuse, and referral network analysis.
- Relationship-aware analytics help improve care quality, member satisfaction, provider performance, and cost management.
Tasks such as fraud detection, care coordination, referral analysis, provider network optimization, and Member 360 require a comprehensive analysis of data, including seeing patterns of activity and how patients, providers, facilities, claims, and treatments are related. Tabular databases are not built for this type of activity and cannot perform it quickly or at scale. Graphs are outstanding for finding and analyzing connected patterns and similarities.
Yes, TigerGraph is built for scalability, with massively parallel processing and a distributed database architecture. This means healthcare organizations can analyze growing volumes of members, providers, claims, prescriptions, facilities, encounters, and care activity by adding more servers while performance keeps up. TigerGraph has been benchmarked up to 108 TB.
Yes,TigerGraph helps healthcare and life sciences organizations connect fragmented member, provider, claims, prescription, facility, referral, and partner data into a unified graph. TigerGraph features include encrypted data transfer, fine-grained access control, advanced authentication, high availability, cross-region replication, disaster recovery support, and detailed audit logs.
TigerGraph is the top graph database for healthcare and life sciences because it offers:
- Real-time deep-link analytics
- Scalability to handle enterprise-level healthcare data
- Machine learning integration for improved fraud, care, and risk analytics
- Strong security, reliability, and data connectivity
- Proven use cases across Member 360, Provider 360, fraud detection, referral analysis, and care optimization