

Risk Assessment and Monitoring with TigerGraph
Population of US not covered by FICO and related credit bureaus
Size of the maximum OFAC fine till date
Loss In GNI Due to Coronavirus
Assessing and Monitoring Risk Is Becoming More Challenging
Legacy Approaches Are Often Unable to Connect the Dots
Database for Risk Assessment and Monitoring?
Assess and Monitor Credit Risk With Graph Analytics
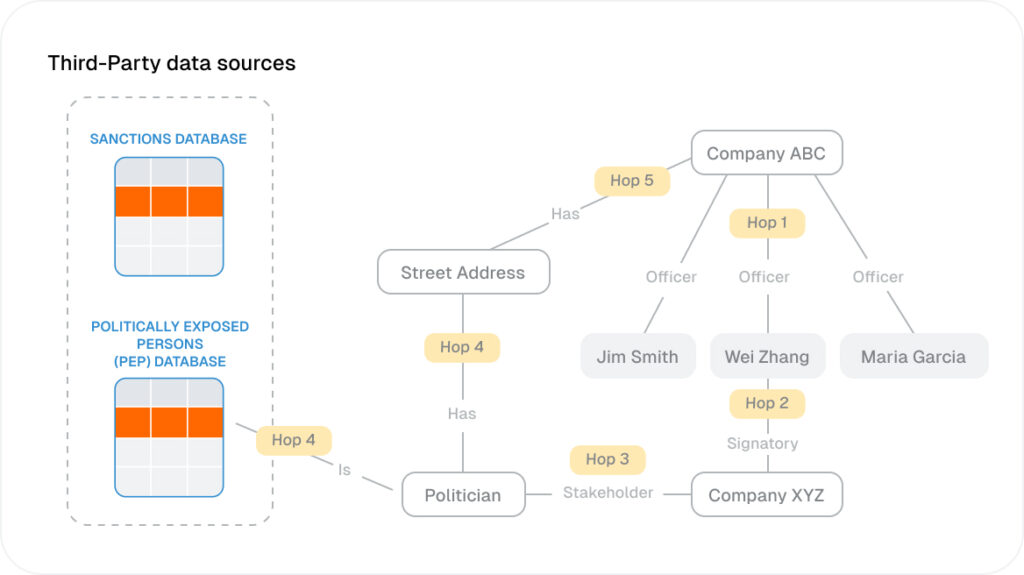
Assess and Monitor Regulatory Risk With Graph Analytics
FAQ
Risk assessment and monitoring is the process of identifying, evaluating, and tracking potential financial, regulatory, credit, operational, and counterparty risks across an organization. It is critical because modern risk is highly connected, often hidden across systems, and can create significant financial loss, compliance exposure, and business disruption if not detected early.
Graph databases improve risk assessment and monitoring by modeling customers, accounts, counterparties, transactions, stakeholders, instruments, and external data as connected entities. Unlike relational databases that require complex joins across separate tables, graph databases can traverse relationships in real time to uncover hidden exposure, indirect connections, and risk patterns across multiple parties.
TigerGraph’s risk assessment and monitoring solution supports real-time, deep link analytics across massive connected datasets. It can analyze multi-hop relationships across accounts, companies, beneficial owners, politically exposed persons, transactions, financial instruments, and third-party sources to detect hidden risk, update risk scores, and help teams make faster, better-informed decisions.
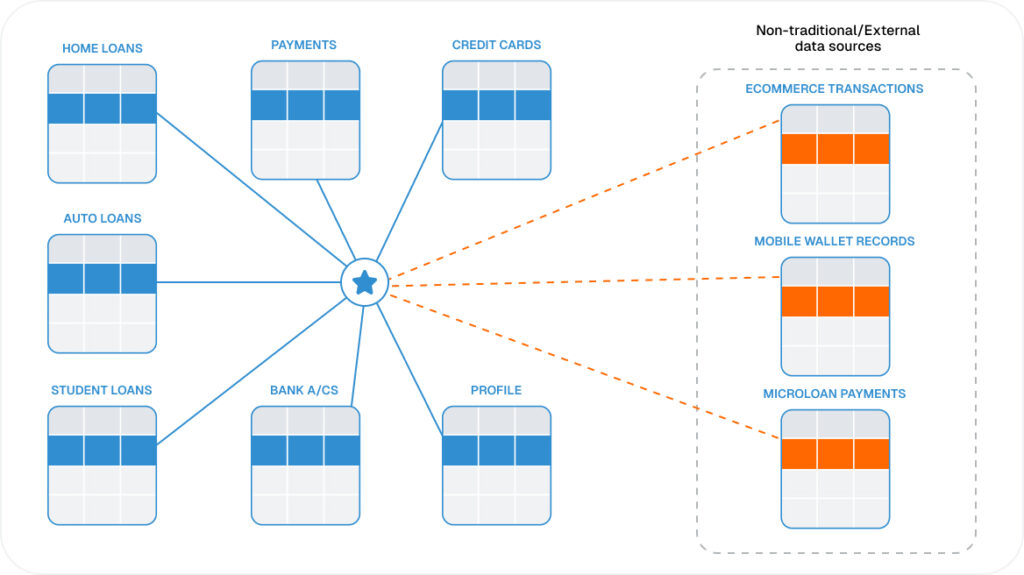
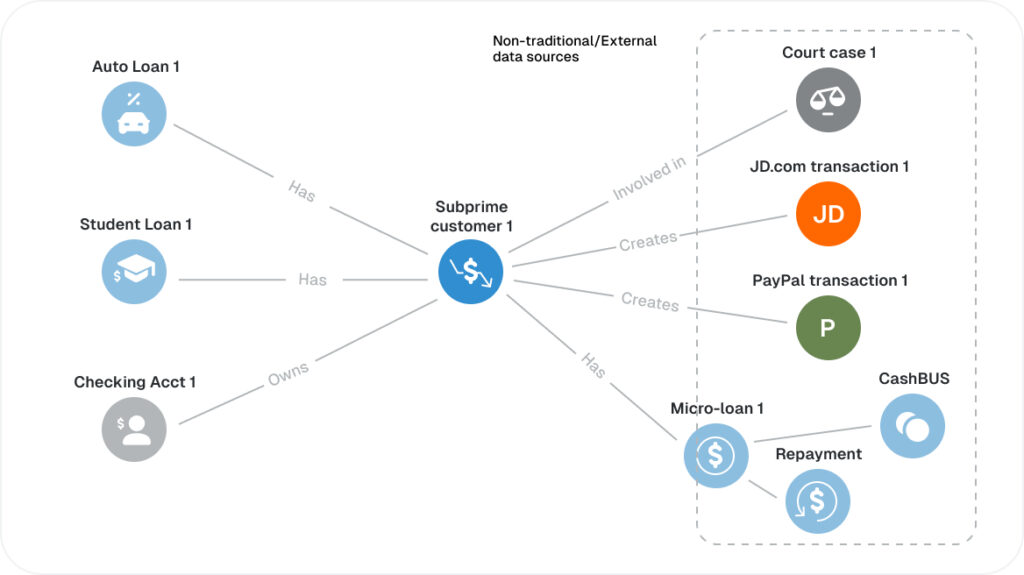
Yes. TigerGraph can support credit risk assessment by connecting traditional credit data with alternative data sources such as mobile wallet activity, ecommerce transactions, repayment history, account behavior, and related-party networks. This helps organizations build more complete risk profiles, identify undisclosed relationships, and assess applicants or counterparties with limited traditional credit history.
Real-time graph analytics helps organizations continuously monitor changing relationships, transactions, ownership structures, and external risk signals. Instead of relying on static snapshots or delayed batch reports, teams can detect new exposures, suspicious connections, regulatory risk, and changes in counterparty behavior as they emerge, enabling faster investigation and more proactive risk management.
The main challenges include fragmented data, complex ownership structures, changing regulations, limited visibility into indirect relationships, and the need to combine internal records with third-party sources. Traditional systems often struggle to connect these signals at speed and scale. A graph database addresses these challenges by analyzing connected risk data directly and in context.
TigerGraph supports regulatory risk and compliance monitoring by connecting customers, companies, officers, beneficial owners, addresses, transactions, sanctions lists, politically exposed persons, and third-party data sources. This helps teams identify hidden relationships, surface customer due diligence alerts, prioritize investigations, and maintain a clearer, explainable view of risk across complex business networks.