Jaguar Land Rover Accelerates Supply Chain Planning from Three Weeks to 45 Minutes
Jaguar Land Rover (JLR) is a global automotive manufacturer and leading technology company with vehicle assembly plants around the world, producing and selling over half a million vehicles in 127 countries.

The Challenge
JLR needed to perform a timely analysis of the impact of changes to the forecast orders to their supply chain, to reduce supplier charges and disruption.
The Solution
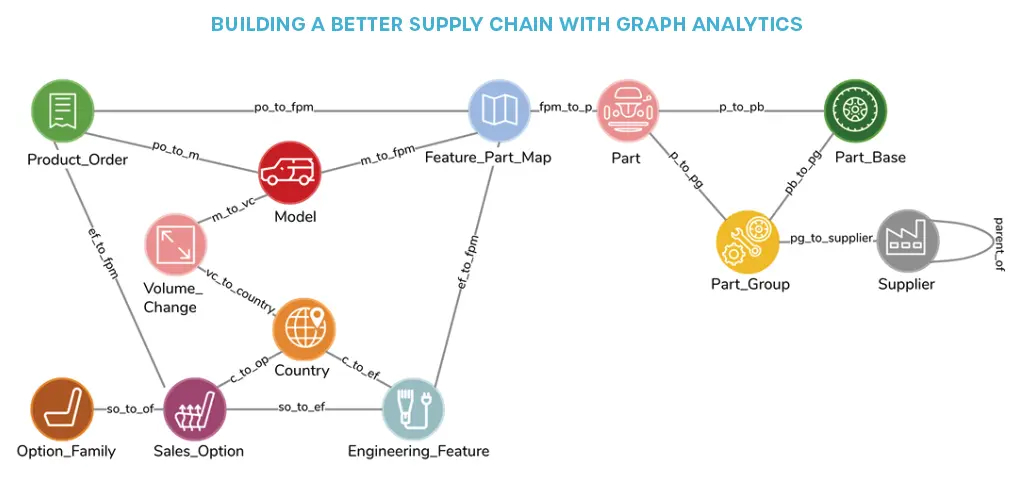
Using TigerGraph, JLR was able to combine 12 separate data sources in a graph equivalent to 23 relational tables, spanning the parts supplied by hundreds of suppliers, through the particular model and configurations’ bill of materials to the manufacturing build sequencing and order forecast for those cars.
The Results
With TigerGraph, JLR is able to easily and quickly model and evaluate complex processes. Queries across the supply chain model now take around 45 minutes where before they would take weeks, if they were even possible at all.
We used the graph to re-sequence how our vehicle orders were to be built in our factory in response to a supplier failure. A process which in the past might have taken days was both modelled and evaluated in less time than it took to write the PowerPoint slide to present the idea.”
The Challenge
Sales forecasts are typically made years in advance so suppliers can prepare and tool-up highly specialised production lines. From these forecasts, minimum buy volumes of parts are committed with penalties for not meeting the agreed upon volume. Actual demand can vary widely and quickly from the initial forecast due to changes in consumer preferences and market conditions resulting in significant impact to production and margins. JLR needed to perform a timely analysis of the impact of changes to the forecast orders to their supply chain, to reduce supplier charges and disruption.
The data necessary to gain transparency across the manufacturing process is distributed across numerous complex data sources from multiple departments, including forecast and supply chain data, parts data from a PLM system, and car configuration data output by a combination of the car-configuration and build-simulation systems. This diverse combination of data meant it was impossible to query across the data in a timely manner. The COVID-19 Pandemic disrupted the supply chain for the entire automotive industry, further emphasizing the need for fast supply chain replanning and optimization in days or even hours as opposed to weeks.
The data necessary to gain transparency across the manufacturing process is distributed across numerous complex data sources from multiple departments, including forecast and supply chain data, parts data from a PLM system, and car configuration data output by a combination of the car-configuration and build-simulation systems. This diverse combination of data meant it was impossible to query across the data in a timely manner. The COVID-19 Pandemic disrupted the supply chain for the entire automotive industry, further emphasizing the need for fast supply chain replanning and optimization in days or even hours as opposed to weeks.
The Solution
Using TigerGraph, JLR was able to combine 12 separate data sources in a graph equivalent to 23 relational tables, spanning the parts supplied by hundreds of suppliers, through the particular model and configurations’ bill of materials to the manufacturing build sequencing and order forecast for those cars. Flexibility of the TigerGraph solution enables JLR to quickly reflect changes in their immediate graph requirements as well as allowing for future expansion.
TigerGraph is installed from the Google Cloud Marketplace, and directly feeds the output of the queries back into the enterprise data-warehouse powered by Google BigQuery so the impact information can be integrated with their existing reporting infrastructure with Tableau, producing meaningful, repeatable and sustainable results in a matter of days.
TigerGraph is installed from the Google Cloud Marketplace, and directly feeds the output of the queries back into the enterprise data-warehouse powered by Google BigQuery so the impact information can be integrated with their existing reporting infrastructure with Tableau, producing meaningful, repeatable and sustainable results in a matter of days.
The Results
With TigerGraph, JLR is able to easily and quickly model and evaluate complex processes. Queries across the supply chain model now take around 45 minutes where before they would take weeks, if they were even possible at all.
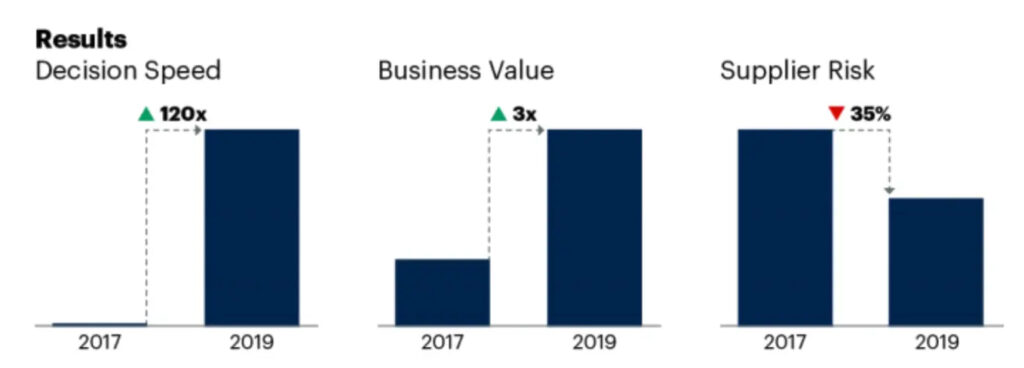
By identifying a common language to speak to both business and data analytics professionals simultaneously, and constructing a connected view of the business from demand to supply, JLR was able to resolve several key business questions. They reaped the following benefits – see diagram :
Increased business value from decreasing inventory costs, lower working capital, and greater profitability in two vehicle lines.
Lower business decision latency due to rapid information discovery and solution delivery amid sudden shifts in demand in the North American market.
Reduced supplier risk as the supply chain embraced graph data and analytics solutions.
More stories


Ready to Harness the Power of Connected Data?
Start your journey with TigerGraph today!