

Improve Machine Learning and Explainable AI With a Graph Database
Estimated business value from AI in 2021
Executives Implementing AI within 3 Years
Expenditures on AI and ML by 2021
Graph Machine Learning Has the Potential to Transform Businesses
Many organizations are using artificial intelligence (AI) and machine learning (ML) to provide them with competitive advantages. Businesses are expected to spend $57.6 billion on AI and ML by 2021 and to reap $2.9 trillion in business value as a result. Artificial intelligence and machine learning are behind the headline-grabbing applications such as self-driving cars and virtual personal assistants (such as Siri and Alexa), but they are also providing better performance and cost savings for universal tasks such as online chat and customer support, product recommendations, design support, and fraud detection. For enterprises, the decision has become not whether to use machine learning, but where to use it and how to do it well.
Read More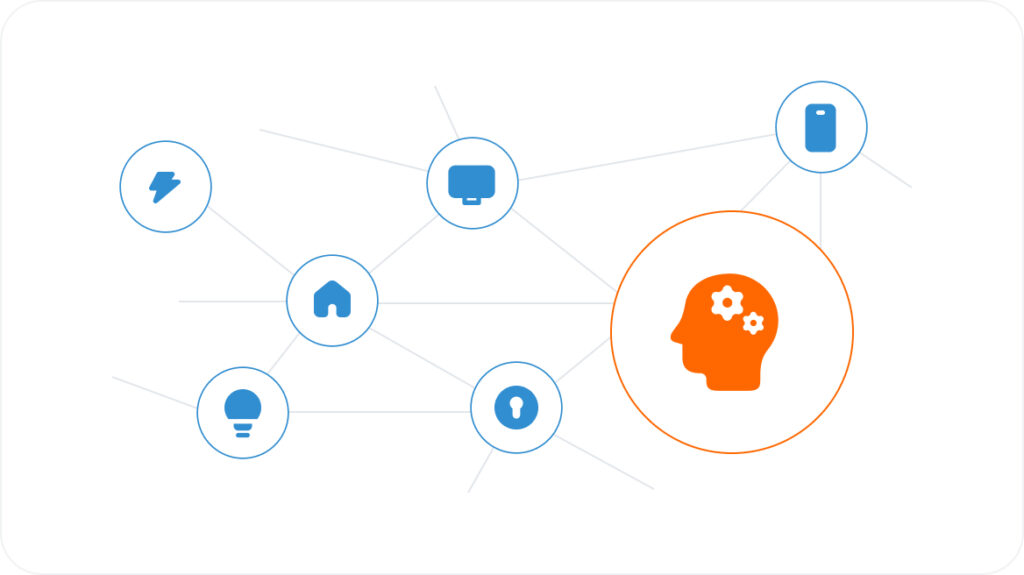
Legacy Approaches to Machine Learning Are Insufficient

Database for for Powering Artificial Intelligence and Machine Learning?
Develop Machine Learning Features With Develop Machine Learning Features With
Improve Explainable Artificial Intelligence With Graph Analytics


FAQ
AI and machine learning with graph analytics uses connected data to improve how models understand relationships, patterns, context, and behavior. Instead of relying only on isolated records or flat features, graph analytics captures how entities are connected, helping organizations build more accurate, explainable, and context-aware AI applications.
Graph databases improve AI and machine learning by modeling customers, accounts, transactions, devices, products, events, and behaviors as connected data. This relationship context helps models detect patterns that traditional tabular features often miss, improving prediction, personalization, fraud detection, risk scoring, recommendations, and other AI-driven decisions.
TigerGraph supports real-time, deep link analytics across massive connected datasets for AI and machine learning. It can traverse millions of relationships in a fraction of a second, generate graph-based features, support machine learning workflows, and provide the relationship context AI systems need to make faster, more accurate, and more explainable decisions.
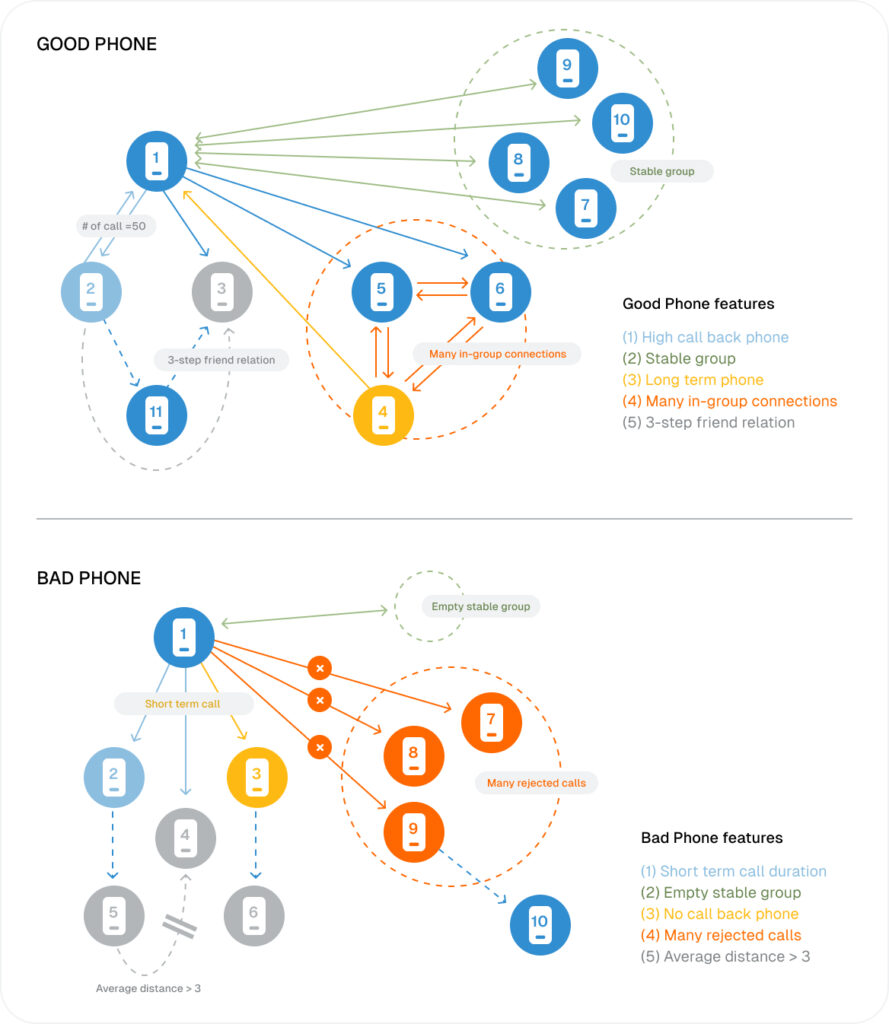
Yes TigerGraph can generate graph-based features such as shared connections, influence scores, community membership, shortest paths, centrality, similarity, and proximity to known risk or opportunity signals. These features help machine learning models understand network behavior, improve accuracy, reduce false positives, and identify patterns hidden in connected data.
Real-time graph analytics helps AI applications act on current relationship context instead of stale data snapshots. TigerGraph can continuously analyze changing connections across customers, products, transactions, devices, and events, enabling AI systems to deliver more timely recommendations, risk scores, fraud alerts, next-best actions, and operational decisions.
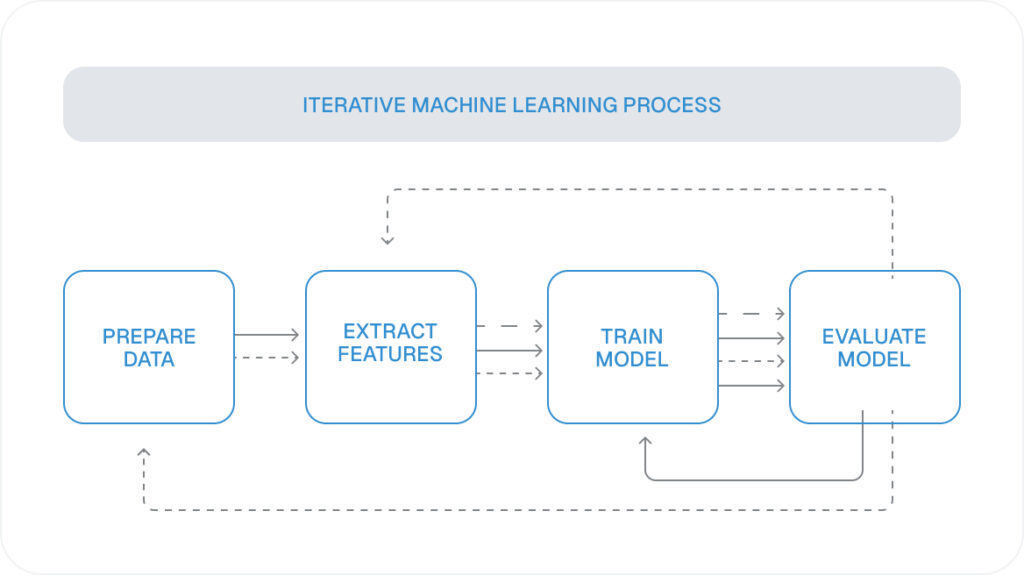
The main challenges include fragmented data, limited relationship context, slow feature engineering, complex multi-hop patterns, and difficulty explaining why models make certain predictions. Traditional systems often struggle to analyze connected data at speed and scale. A graph database addresses these challenges by making relationships directly queryable and usable for AI.
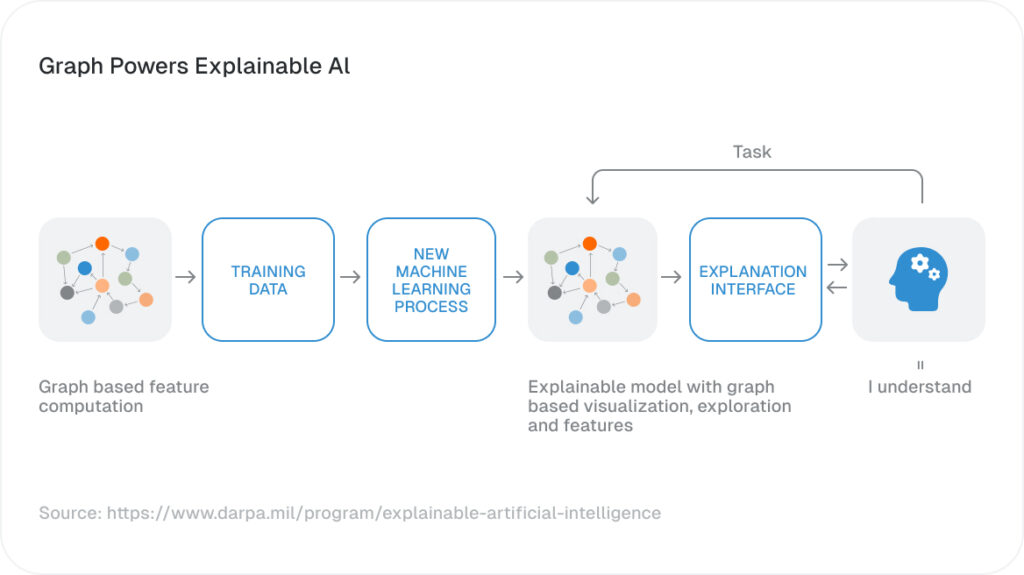
TigerGraph supports explainable and trustworthy AI by showing the relationships, paths, communities, and patterns behind a prediction or recommendation. Instead of producing only a model score, TigerGraph helps teams understand why an entity, transaction, customer, or event is connected to a risk, opportunity, or recommended action.