
The Company
TigerGraph is a graph analytics software company that specializes in connecting data assets to deliver enterprise-level knowledge and insights. TigerGraph provides a graph AI platform that is built on the industry’s first and only distributed native graph database which comes with a SQL-like query language and tightly integrates tooling and enterprise connectors to ensure data scientists and developers can design and deploy analytical solutions in weeks.
Graph Delivers Deeper Business Insights
Business leaders are asking their data scientists and analytics teams to dig deeper into data to find patterns and relationships that will convert data into business insights. Designed to reveal data relationships and context, graph database management systems (GraphDBMS) enable leaders to ask real-time business questions on fresh data to inform a rapid response. While traditional SQL databases are good at storing facts for easy storage and retrieval, they are not good at finding multilayer or multi-dimensional relationships which is where patterns and insights are found. Finding deep, multi-dimensional relationships and patterns is exactly what graph databases were built to do, and they do it fast.
Why Graph
Relationships Are the Strongest Predictor of Behavior
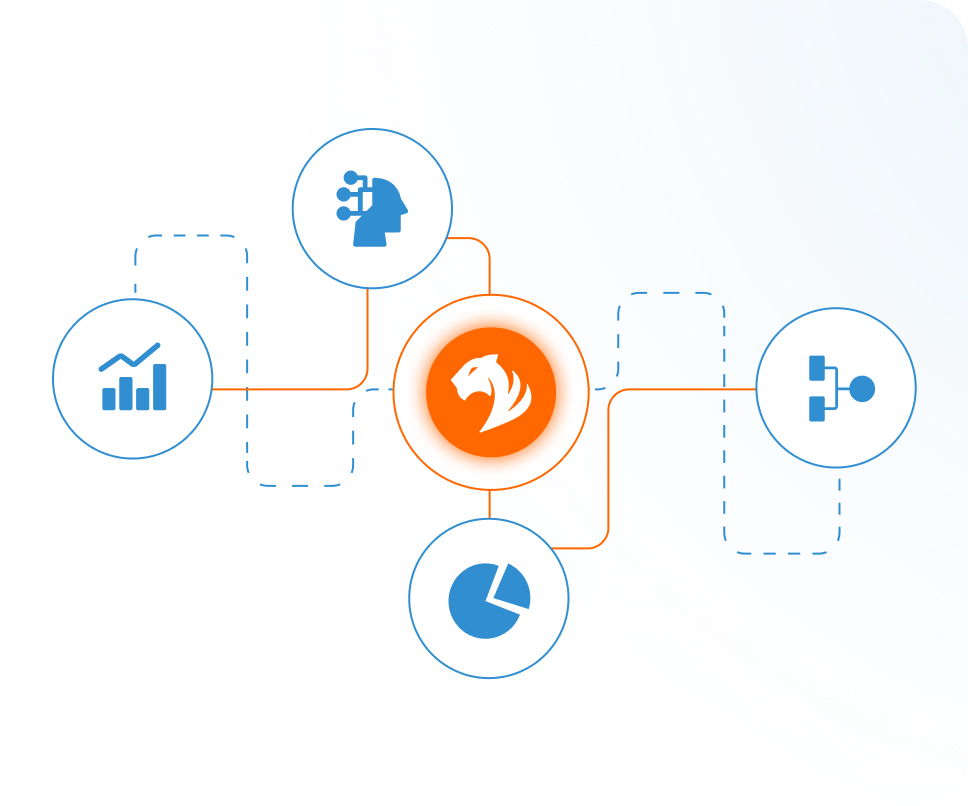
Graph analytics is a set of analytic techniques that shows how entities such as people, places, and things are related to each other. Graph analytics are uniquely suited to understanding structures and revealing patterns in datasets that are highly connected.
Get Fast Insights from Data
with personalized experiences based on deep insights.
Answer Complex Questions
that typical big data systems can’t answer, such as supply and demand inquiries.
Quickly Identify Hidden Issues
to proactively mitigate potential risks using a digital twin.
Improve Efficiency
with a performance-optimized and automated solution.
TigerGraph Products
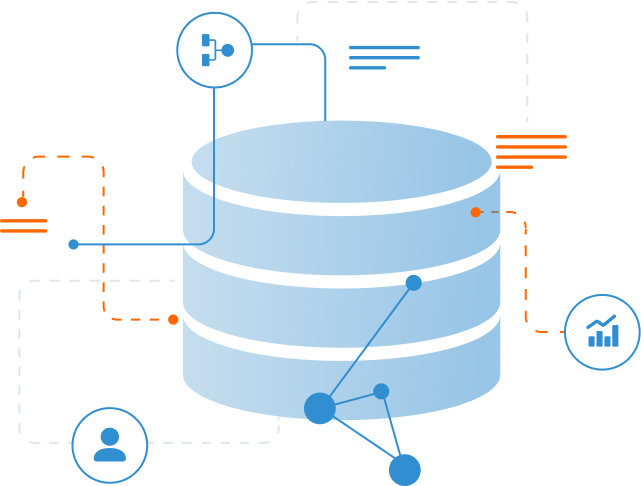
TigerGraph GraphDB
A native, distributed, massively parallel processing (MPP) graph database that supports AI and data science practices. It stores data as entities and the relationships between those entities to enhance decisions using combinations of prescriptive and predictive analytics, in graph database machine learning, and faster discovery of insights by connecting internal and external data. The result is faster delivery of an advanced infrastructure that more ably supports enhanced visualization and display capabilities.
Discover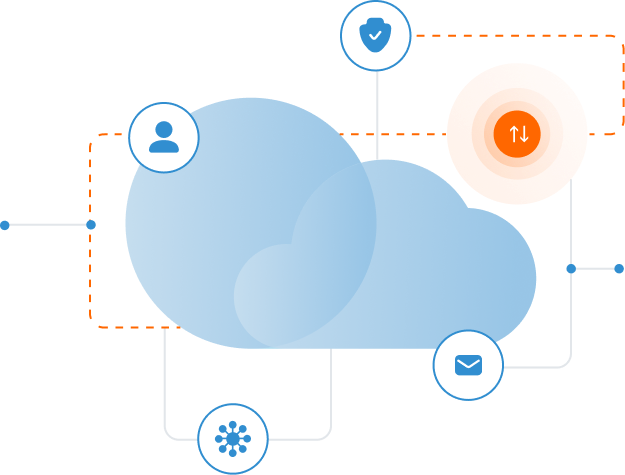
TigerGraph Savanna
Making graph accessible to all, TigerGraph Savanna is an easy-to-use service that is the ideal way to process analytical and transactional workloads in real-time. It allows users to get started in minutes, build a proof-of-concept model in hours and deploy a solution to production in days. Businesses can use the cloud vendor of their choice as it is available on Amazon Web Services, Google Cloud Platform, and Microsoft Azure.
Discover
Industry Solutions
Integrated UX tool kits are available for industry-specific use cases such as fraud, anti-money laundering, and data operations.
DiscoverTigerGraph Company Values
Our values represent who we are and who we strive to be as an individual, team and company.
01
See it from the customer’s pov

02
Earn your stripes

03
Be curious, ask questions

04
Focus on craftsmanship

05
Work as a team

06
The buck stops with you

Our Offices
Milpitas, CA 95035
James’ Square, Cheltenham,
England, GL50 3PR