

Optimize Mobile Networks, Cloud Infrastructure and IT Resources With TigerGraph
Yearly Loss due to the Mobile Network Outage
Cost of IT Downtime Per Minute
Percentage of Cloud Services with Overprovisioned Computing or Memory
The Hidden Cost of Poor Network Visibility and Analytics
Mobile telecom network outages cost over $15 billion annually. Outages affect both the top-line and bottom-line, as well as customer satisfaction and the reputation of the mobile operator. Cloud computing costs are increasing each month. A survey in 2017 found that over 84% of the cloud services are over-provisioned, meaning they have allocated more computing or memory than what’s required for the workload. Gartner estimates that IT downtime costs an organization over $5,600 per minute, with lost productivity.
It’s no surprise, therefore, that organizations are looking for new ways of optimizing telecom networks, cloud infrastructure and IT resources to reduce costs and improve productivity.
Read More

Database for Optimization of the Network, IT and Cloud Resources?
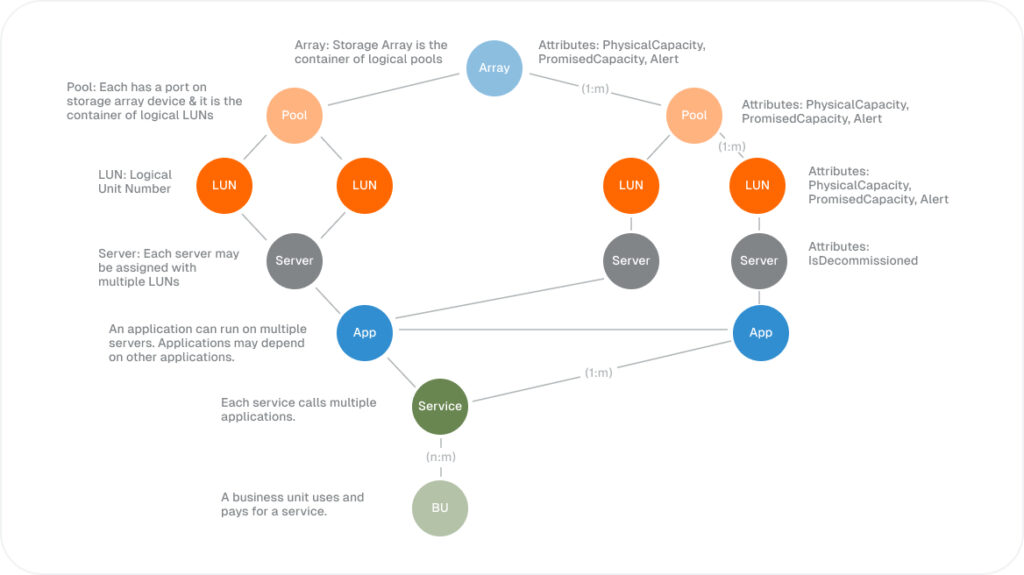
Optimize Mobile Network and It Resources With Graph Analytics
Optimize Cloud Infrastructure With Graph Analytics
With TigerGraph, organizations can model and visualize their cloud resource consumption with workloads for each department,team, product, and owner running on the servers. Cloud service administrators and cost optimization leaders can analyze and create recommendations for optimizing resource consumption to reduce costs while maintaining service levels for critical workloads. TigerGraph’s GraphStudio empowers the users to visualize and optimize tasks for each person or team to improve the operational efficiency while cutting the cloud bill.
Read More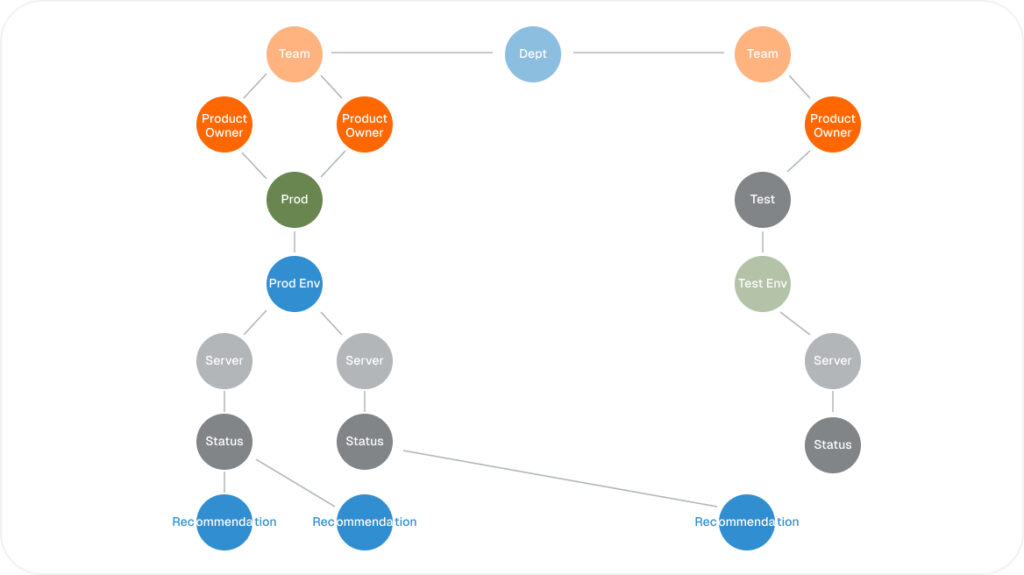


FAQ
Network, IT, and cloud resource optimization is the process of improving how infrastructure, workloads, storage, computing, and network resources are monitored, allocated, and managed. It is critical because outages, overprovisioning, underutilized capacity, and slow incident response can increase costs, reduce productivity, disrupt services, and damage customer experience.
Graph databases improve network and cloud resource optimization by modeling servers, routers, switches, workloads, applications, storage, teams, owners, and dependencies as connected data. Unlike relational databases that require complex joins across separate tables, graph databases can traverse relationships in real time to reveal dependencies, capacity risks, outage impact, and optimization opportunities.
TigerGraph’s network and cloud optimization solution supports real-time, deep link analytics across massive infrastructure and resource networks. It can analyze multi-hop relationships across workloads, applications, servers, storage, network devices, cloud services, teams, and owners to detect risk, reduce waste, optimize capacity, and improve operational resilience.
Yes, TigerGraph can help organizations reduce cloud infrastructure costs by connecting resource consumption, workloads, departments, teams, products, owners, and service-level requirements. This helps administrators identify overprovisioned resources, underutilized capacity, inefficient workload placement, and cost-saving opportunities while maintaining performance for critical applications and business services.
Real-time graph analytics helps operations teams understand how infrastructure issues affect connected workloads, applications, users, and business services. Instead of reacting to isolated alerts, teams can identify at-risk resources, predict downstream impact, prioritize critical workloads, and plan mitigation steps before outages or capacity constraints create broader disruption.
The main challenges include fragmented monitoring tools, complex infrastructure dependencies, changing workloads, overprovisioned cloud services, limited visibility into downstream impact, and slow analysis across disconnected systems. Traditional tools often struggle to connect these signals at speed and scale. A graph database addresses these challenges by analyzing connected infrastructure data directly and in context.
TigerGraph supports AI and machine learning for infrastructure optimization by generating graph-based features from connected infrastructure data, such as workload dependencies, resource criticality, capacity exposure, outage paths, and utilization patterns. These features help models improve anomaly detection, capacity planning, cost optimization, workload placement, and operational recommendations across complex environments.