

Obtain Insights From Temporal Data With TigerGraph
Number of Cellular IoT Connections by 2023
Executives in Technology, Telecom & Media investing in IoT in 2018
79ZB of IoT data
Internet of Things Data Is Deluging Utility Companies
Database for Analysis of Time Series Data?
Uncover Insights From Temporal Analysis of Internet of Things Data
Optimize Resources Using Insights Gained From Internet of Things Data
FAQ
Time series analysis is the process of analyzing data that changes over time, such as sensor readings, meter activity, network performance, demand signals, and operational events. It is critical because organizations need to detect trends, spikes, bottlenecks, failures, and anomalies quickly enough to improve reliability, reduce risk, and optimize operations.
Graph databases improve time series analysis by connecting temporal events to the assets, systems, customers, locations, and infrastructure they affect. Unlike traditional tools that analyze time-stamped data in isolation, graph databases reveal how changes move through connected networks, making it easier to understand causes, dependencies, impact, and operational risk.
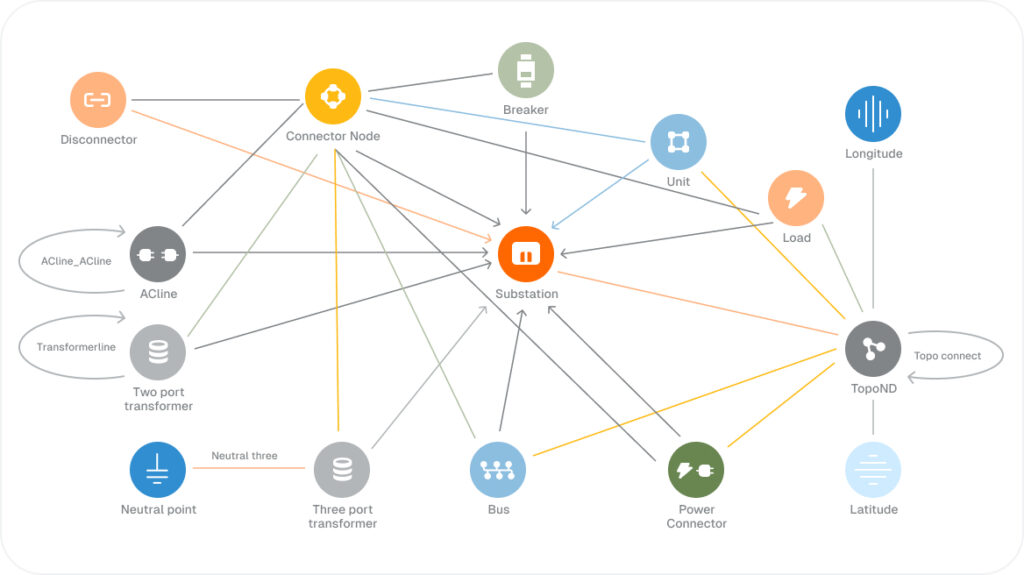
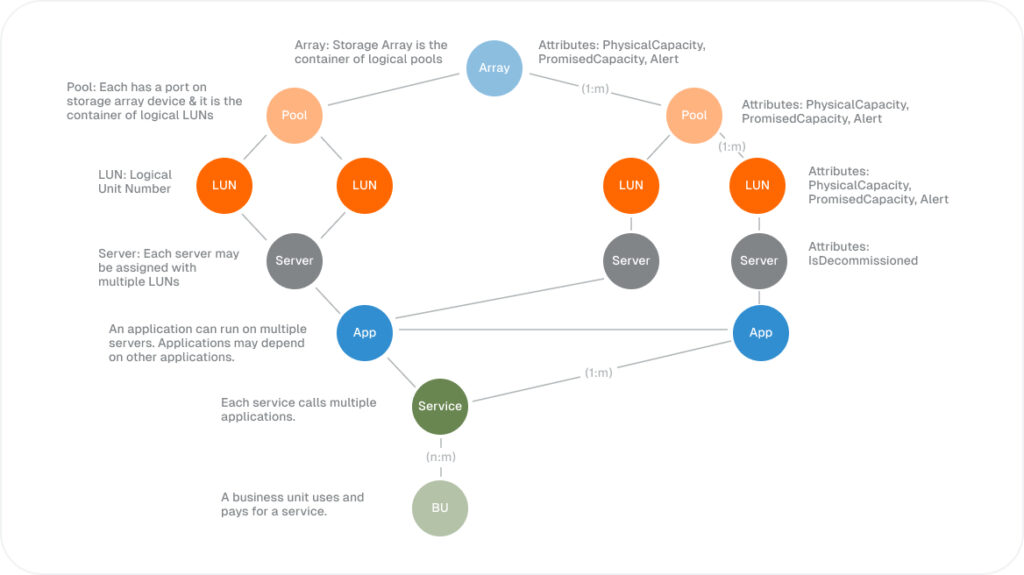
TigerGraph’s time series analysis solution supports real-time, deep link analytics across massive volumes of connected temporal data. It can analyze relationships across IoT sensors, meters, grid assets, servers, storage systems, routers, workloads, and business services to detect bottlenecks, predict capacity issues, and improve operational decision-making.
Yes, TigerGraph can analyze IoT and sensor data in real time by connecting sensor readings to the assets, systems, locations, and networks they monitor. This helps teams detect sudden demand spikes, supply drops, equipment wear, capacity constraints, and performance issues before they escalate into outages, failures, or customer-impacting disruptions.
Real-time graph analytics improves forecasting and monitoring by adding relationship context to temporal data. Instead of tracking metrics as isolated signals, organizations can understand how events affect connected assets, customers, workloads, and services. This enables faster anomaly detection, better impact analysis, more accurate forecasts, and more proactive operational response.
The main challenges include massive IoT data volumes, fragmented monitoring systems, fast-changing signals, complex infrastructure dependencies, and limited visibility into how events affect connected assets or services. Traditional systems often struggle to combine temporal data with relationship context. A graph database addresses these challenges by analyzing time-based and connected data together.
TigerGraph supports AI and machine learning for time series analysis by generating graph-based features from connected temporal data, such as asset dependencies, event sequences, shared infrastructure, load patterns, failure paths, and network criticality. These features help models improve anomaly detection, forecasting, predictive maintenance, capacity planning, and operational recommendations.