

Optimize Mobile Networks, Cloud Infrastructure and IT Resources With TigerGraph
Yearly Loss due to the Mobile Network Outage
Cost of IT Downtime Per Minute
Percentage of Cloud Services with Overprovisioned Computing or Memory
Unplanned Outages Are Costing the Utility Companies Billions
Mobile telecom network outages cost over $15 billion annually. Outages affect both the top-line and bottom-line, as well as customer satisfaction and the reputation of the mobile operator. Cloud computing costs are increasing each month. A survey in 2017 found that over 84% of the cloud services are over-provisioned, meaning they have allocated more computing or memory than what’s required for the workload. Gartner estimates that IT downtime costs an organization over $5,600 per minute, with lost productivity.
It’s no surprise, therefore, that organizations are looking for new ways of optimizing telecom networks, cloud infrastructure and IT resources to reduce costs and improve productivity.
Read More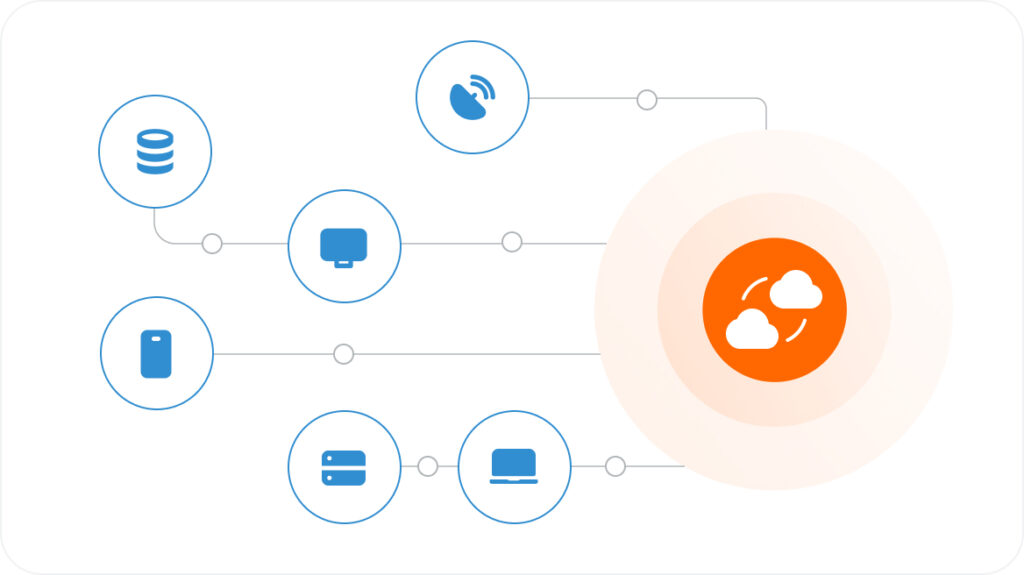
Database for Optimization of the Network, IT and Cloud Resources?
Optimize Mobile Network and It Resources With Graph Analytics
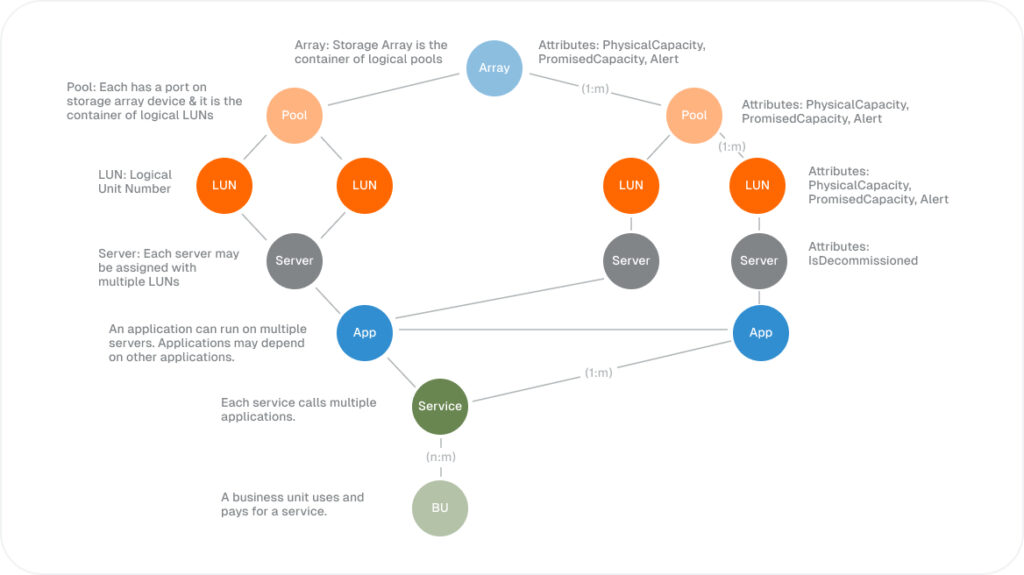
Optimize Cloud Infrastructure With Graph Analytics
With TigerGraph, organizations can model and visualize their cloud resource consumption with workloads for each department,team, product, and owner running on the servers. Cloud service administrators and cost optimization leaders can analyze and create recommendations for optimizing resource consumption to reduce costs while maintaining service levels for critical workloads. TigerGraph’s GraphStudio empowers the users to visualize and optimize tasks for each person or team to improve the operational efficiency while cutting the cloud bill.
Read More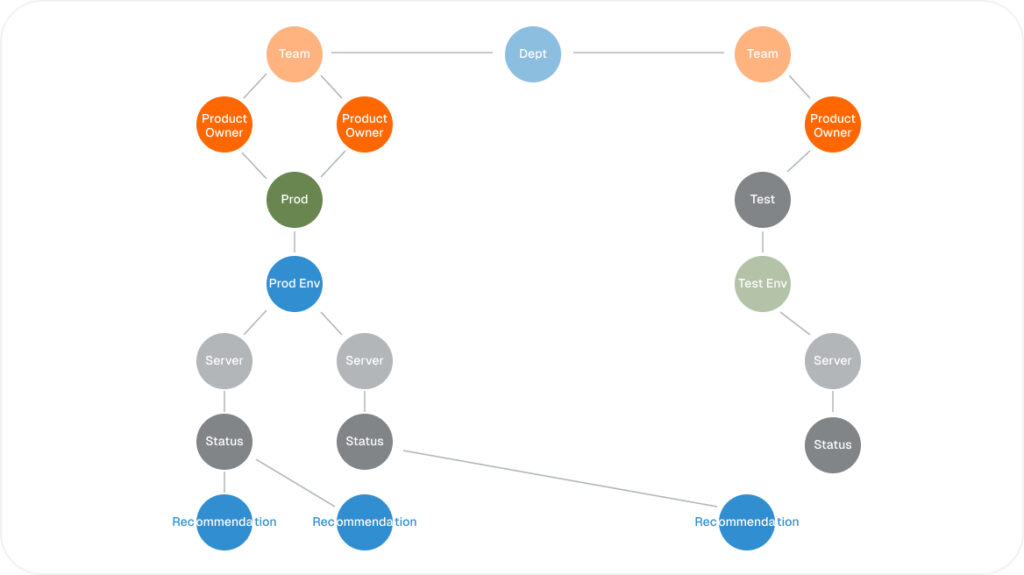
FAQ
Description