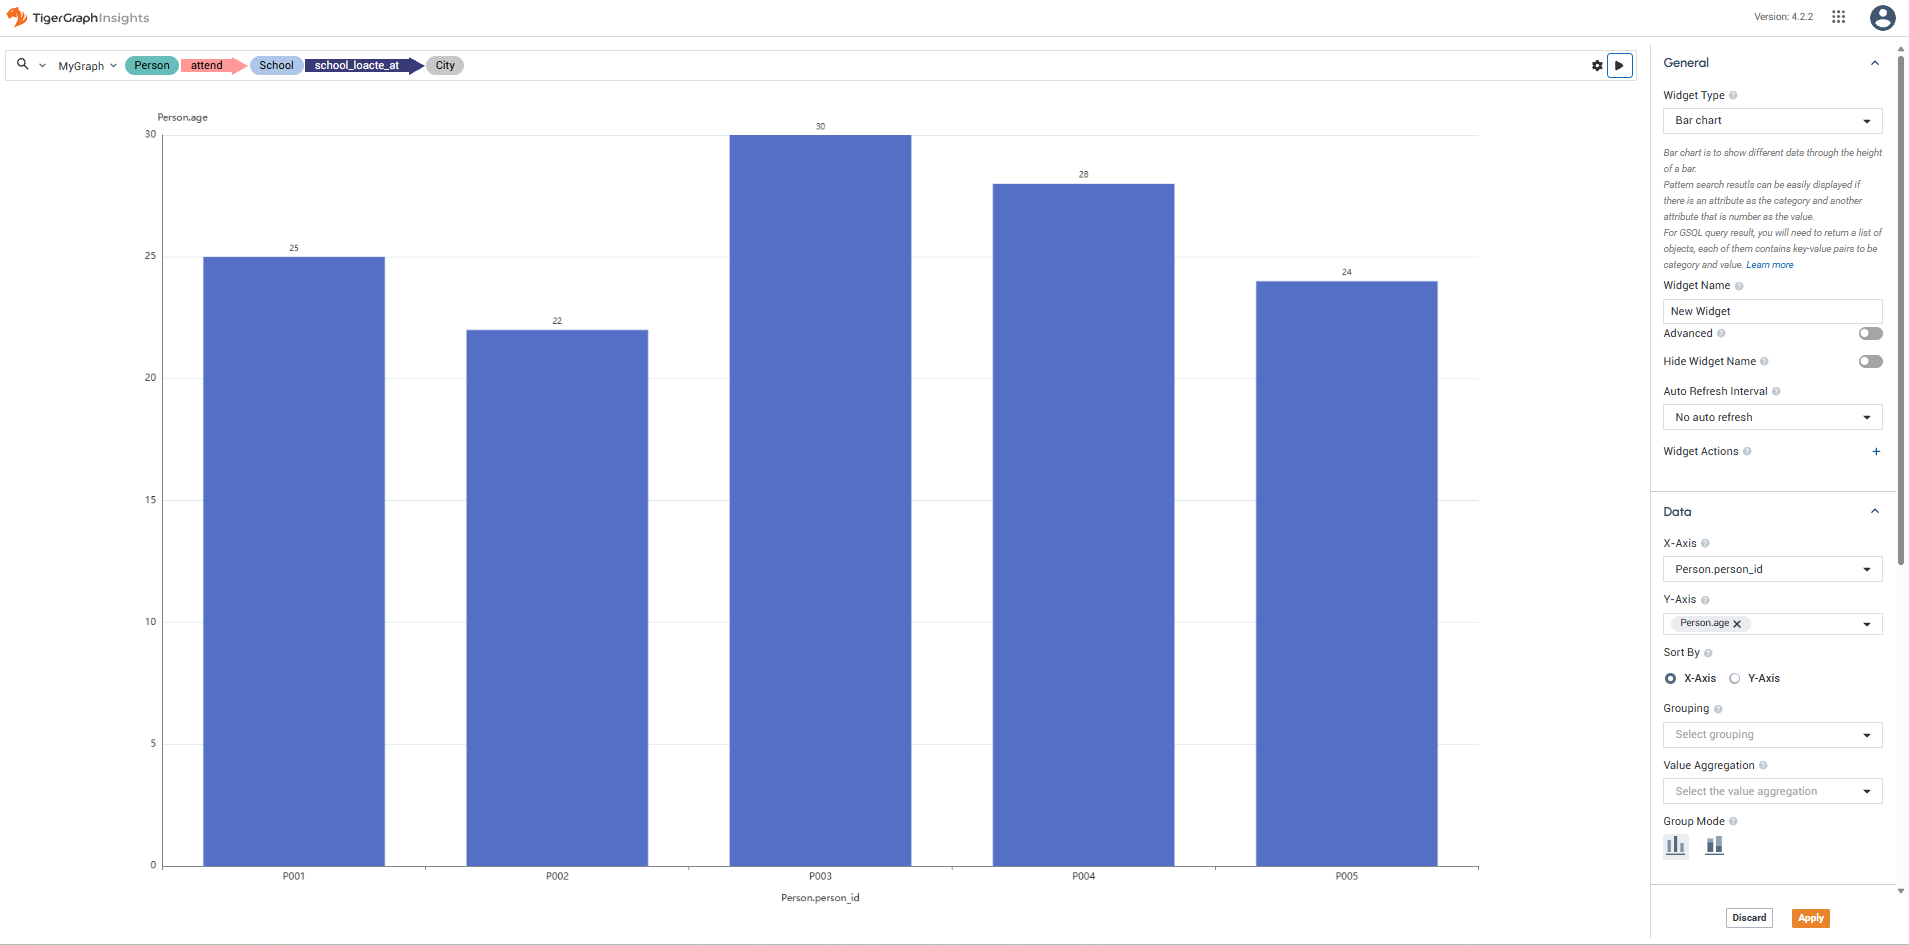
Bar Chart Widget
The Bar Chart Widget displays a bar chart created from the results of a pattern match search of your database.
Inputs
Accepts data as vertices and edges for a pattern search result. For a GSQL query result, accepts a list of objects that contain at least one numeric attribute to be used as the height of the bar.
Widget window
Sorting and grouping
Customize the Category (X-Axis) and Value (Y-Axis) to set the horizontal axis categories and bar height.
Sort the data by the category name (alphabetical left to right) or value (increasing left to right).
Use Grouping to select a column and create grouped or stacked bars based on the values in that column. Choose Grouped to display bars side by side, or Stacked to layer them cumulatively.
Use Value Aggregation to aggregate values using COUNT, AVG, SUM, MAX, or MIN.
Display options
You have several options to control the design of the X and Y axis labels of the graph, as well as turn on and off a key that explains each color present:
-
Toggle Show X-Axis Label and Show Y-Axis Label to show or hide axis labels.
-
Use X-Axis Label Rotation to adjust the angle of X-axis labels.
-
Toggle Show Label to show or hide bar values on the chart.
-
Use Direction to switch the bar orientation.
-
Configure Default Sorting to set the default sort order.
-
Toggle Show Legend to show or hide the chart legend.